- Intro
- Portfolio manager summary in four pictures
- Shareholder activism trends
- Shareholder activism in 2023
- Performance of stocks targeted by activist investors
- A guide for managements: Identifying sources of vulnerability
- Appendix A: Activist campaigns launched since January 2022
- Appendix B: Investors with the most number of campaigns in our universe since 2006
- Appendix C: Notes on methodology
Shareholder activism surged during 2022 but the pace moderated in 1Q 2023. Activists launched 148 campaigns against 120 distinct US corporations during 2022, a roughly 20% year/year jump, ranking among the top 5 most active years since 2006. During 1Q 2023, investors launched 27 campaigns against 26 companies, a 24% decline from 4Q 2022.
A changing regulatory landscape and an uncertain macro environment should support shareholder activism in 2023. The Universal proxy took effect last fall and will embolden activists during the upcoming proxy season. The valuation decline and increased cost of capital means activist investors will focus on profitability and idiosyncratic opportunities of potential targets.
Our analysis covers 2,142 shareholder activism campaigns launched since 2006 with a corporate valuation demand against Russell 3000 companies.
For INVESTORS: The median stock targeted by activist investors outperformed its sector by 3 pp in the week after the launch of a campaign. However, excess returns were short-lived and typically turned negative after six months. While 69% of targeted stocks outperformed during the first week, after one year only 42% of stocks outperformed their respective sectors and the median stock lagged by 5 pp. A wide performance distribution exists for both successful and unsuccessful activist campaigns and varies by type of activist demand. While the median activist target lagged its sector, the average activist target outperformed by 4 pp over 12 months. The asymmetric nature of returns suggests that "piggyback" portfolio managers with a consistent approach to investing in activist targets can generate positive returns over time.
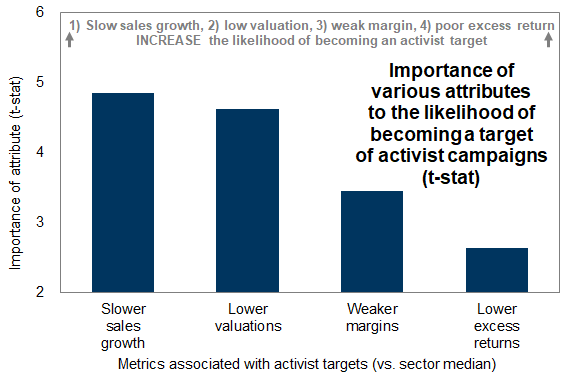
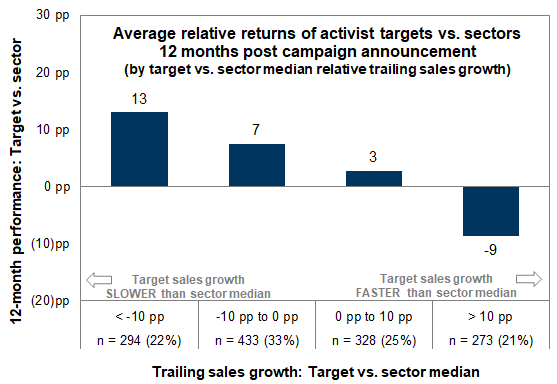
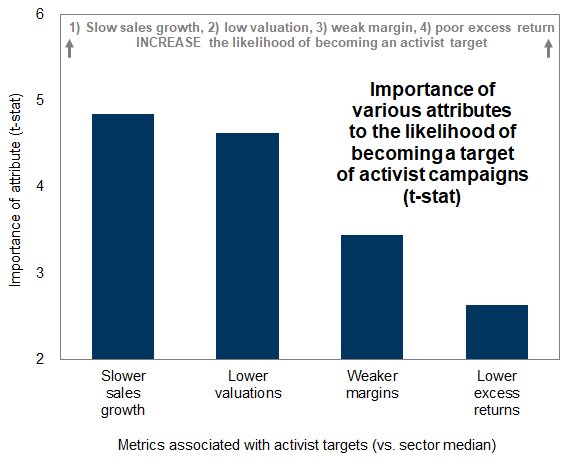
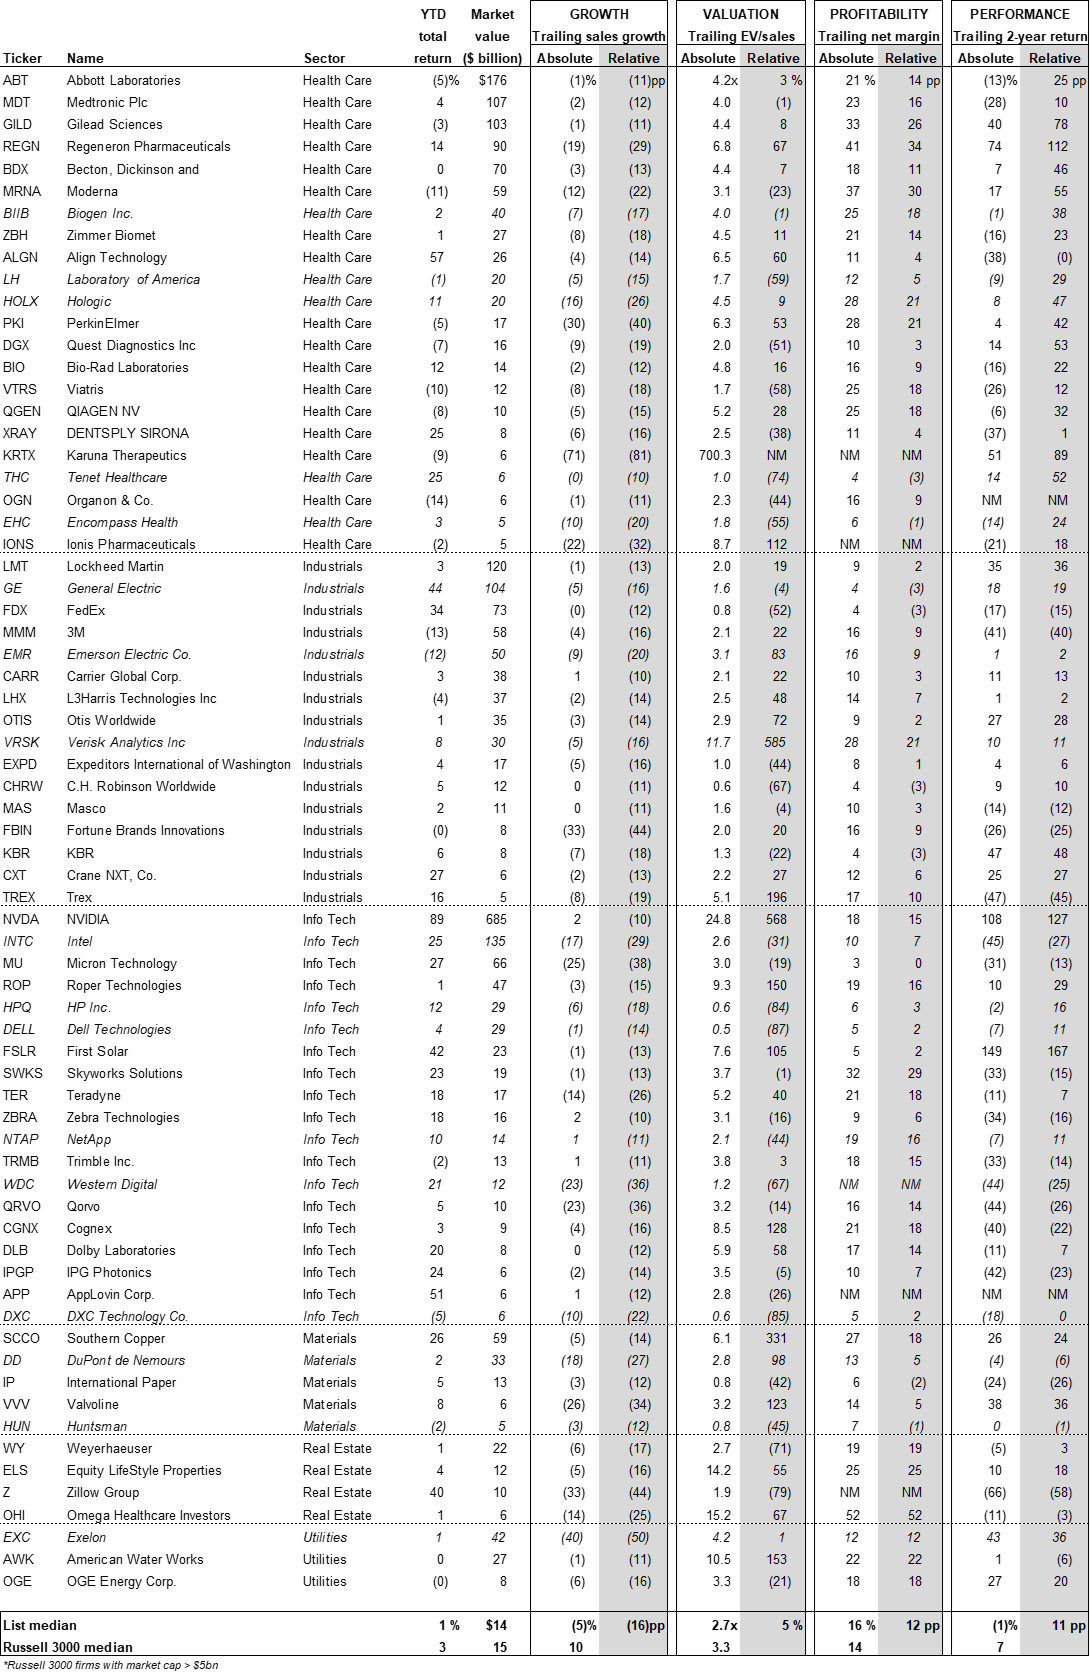
For MANAGEMENTS: We identify four metrics relative to the sector median that are associated with an increased likelihood of becoming an activist target: (1) Slower trailing sales growth, (2) lower trailing EV/sales multiple, (3) weaker trailing net margin, and (4) trailing 2-year underperformance. Note that low realized sales growth relative to the sector median is the metric most associated with a target company's share price outperformance following the launch of an activist campaign. Exhibit 19 lists 116 stocks that have experienced at least 10 pp slower realized sales growth relative to its sector median over the past 12 months and at least one source of vulnerability.
Portfolio manager summary in four pictures
Exhibit 1: Performance of companies targeted by activist investors
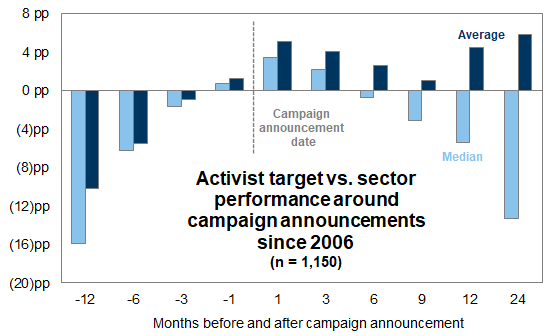
Exhibit 2: Distribution of 12-month excess returns vs. sector by activist investor demand
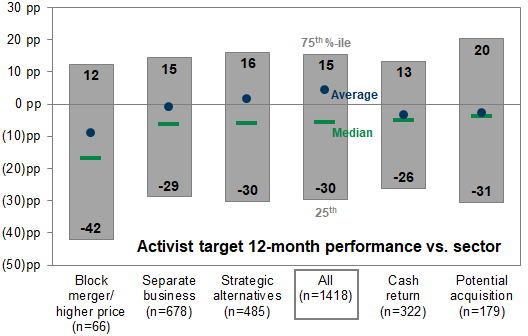
Exhibit 3: An equal-weight portfolio of activist targets has outperformed the Russell 3000
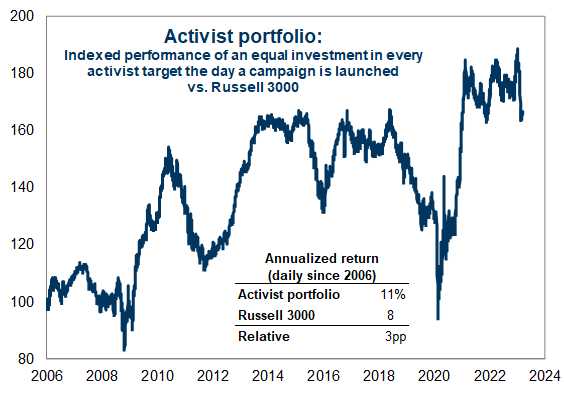
Exhibit 4: Importance of characteristics associated with companies targeted by activist investors
Shareholder activism trends
Exhibit 5: Number of companies targeted by activist investors by market cap
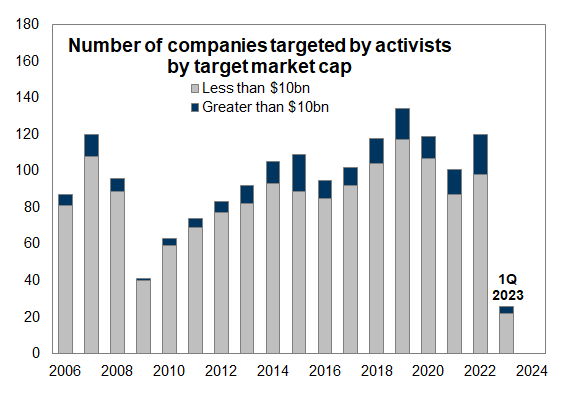
Exhibit 6: Value creation demands from activist investors
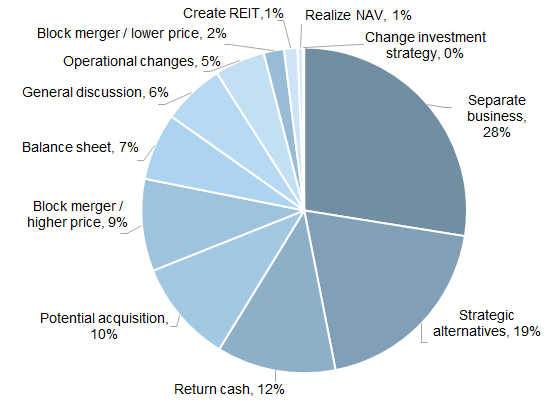
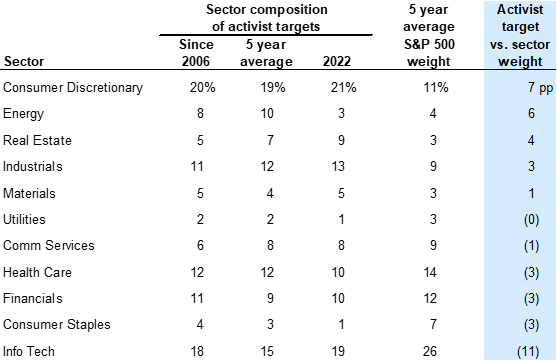
Exhibit 7: Sector composition of activist targets (share of campaigns)
Shareholder activism in 2023
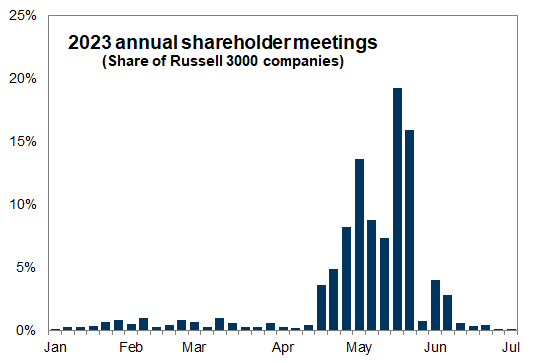
Exhibit 8: Annual shareholder meeting date among Russell 3000 companies
Performance of stocks targeted by activist investors
Exhibit 9: Short-term performance of companies targeted by activist investors
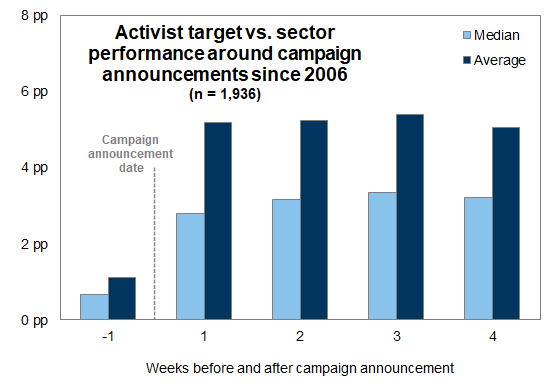
Exhibit 10: Performance of companies targeted by activist investors
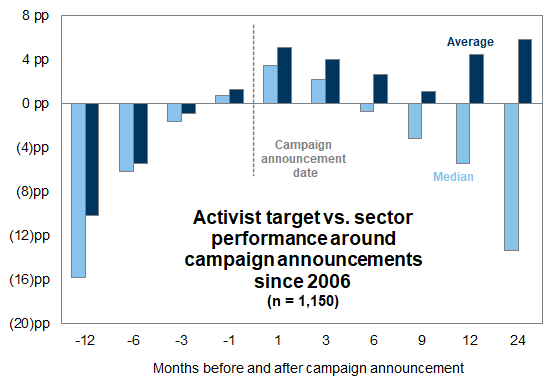
Exhibit 11: Forward P/E: Median activist target vs. sector
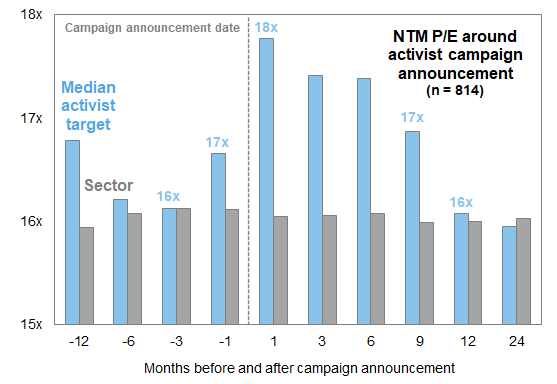
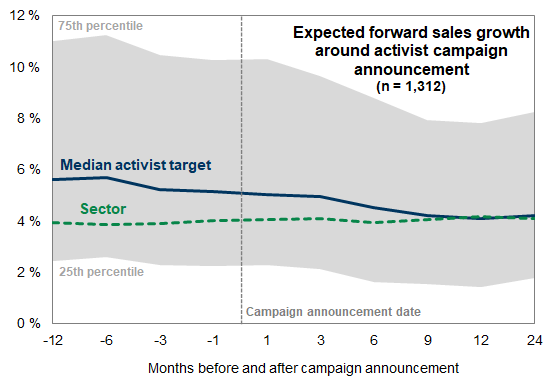
Exhibit 12: Expected forward sales growth: Median activist target vs. sector
Opportunities for outperformance
(1) Activist Portfolio
Exhibit 13: An equal-weight portfolio of activist targets has outperformed the Russell 3000

(2) Wide distribution of outcomes
Exhibit 14: Performance distribution of successful activist campaigns
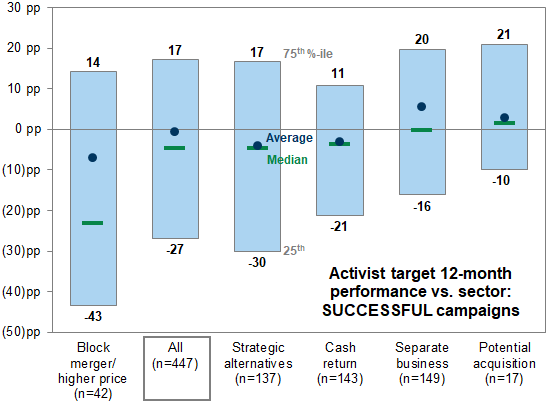
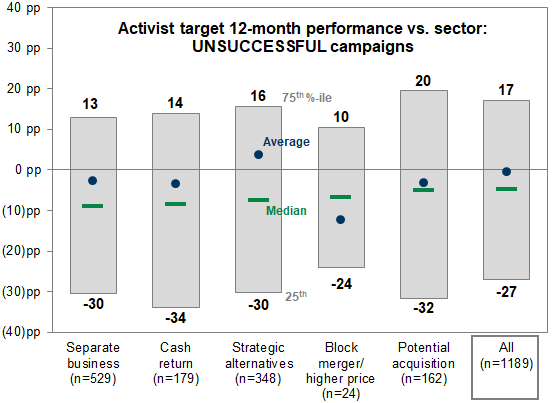
Exhibit 15: Performance distribution of unsuccessful activist campaigns
(3) Favorable target attribute
Exhibit 16: Targets with slower sales growth relative to sector median tend to outperform after 12 months
A guide for managements: Identifying sources of vulnerability
Exhibit 17: Sources of vulnerability for a potential target
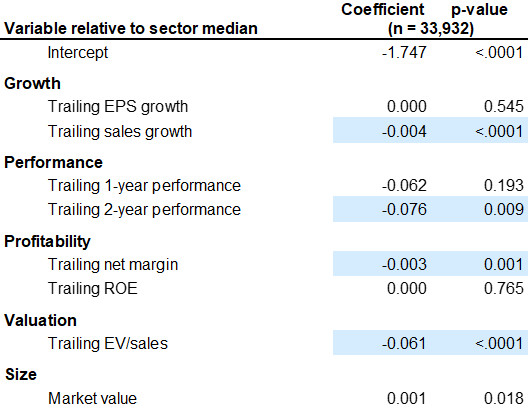
Exhibit 18: Importance of characteristics associated with activist targets
67% of targets underperformed their sectors during the 2 years prior to the campaign.
57% traded at an EV/sales discount.
55% had slower sales growth.
47% had weaker net margins.
Exhibit 19: Russell 3000 stocks vulnerable to shareholder activism (ranked by market cap within sector)
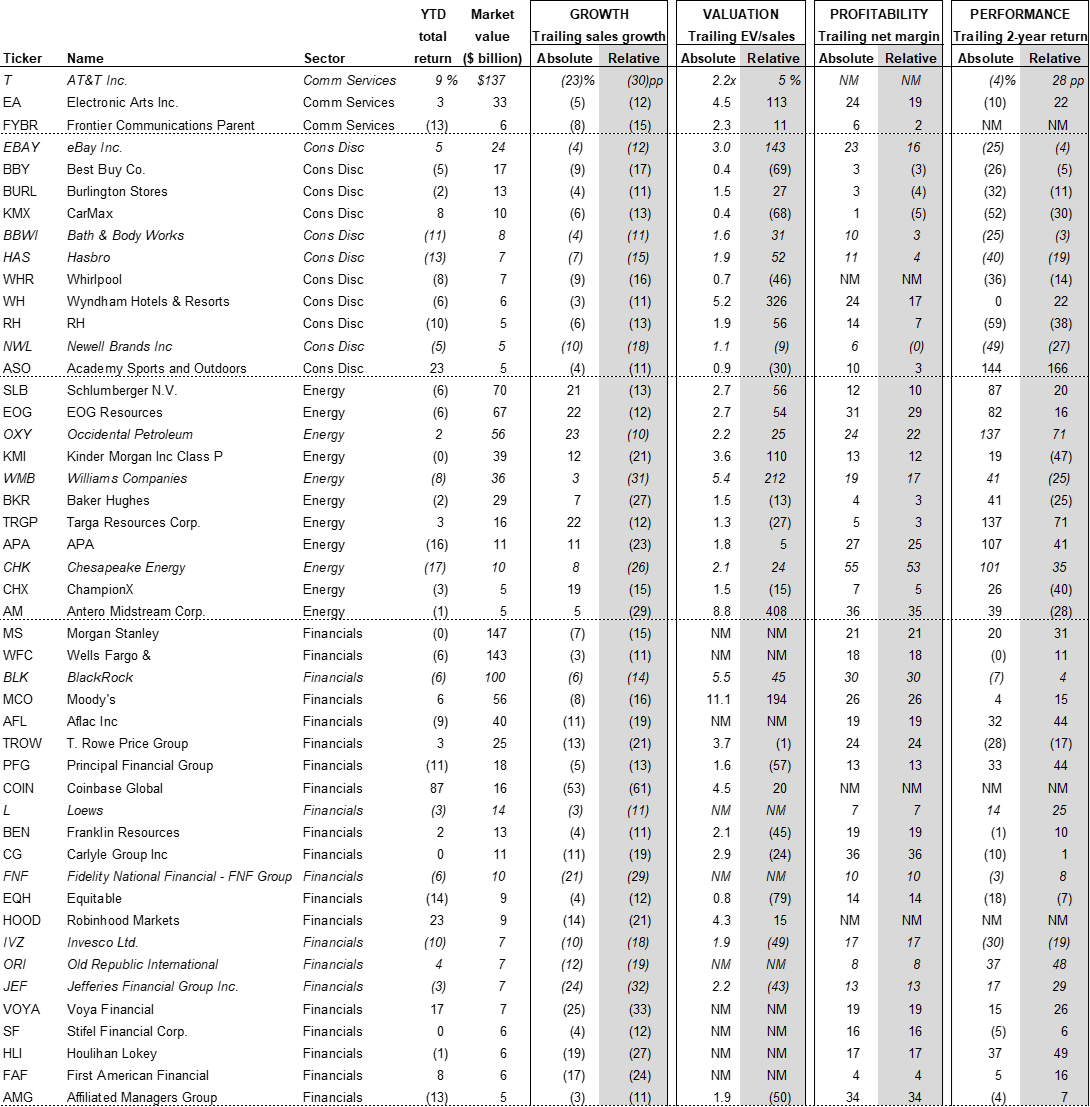
Exhibit 19 (continued): Russell 3000 stocks vulnerable to shareholder activism (ranked by market cap within sector)
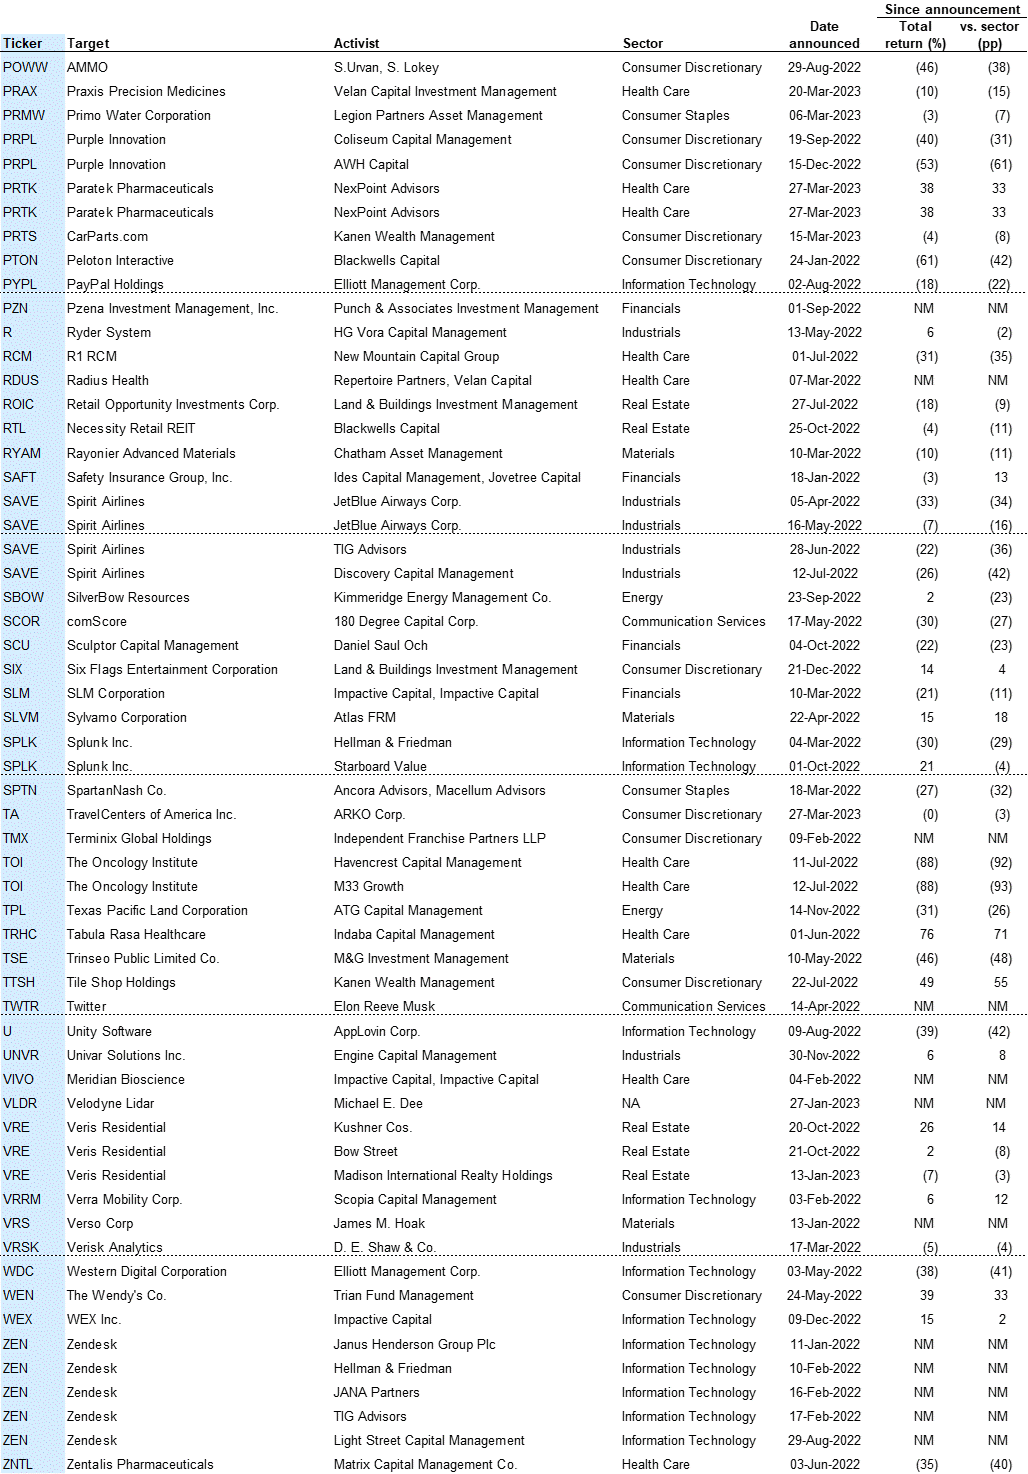
Appendix A: Activist campaigns launched since January 2022
Exhibit 20: Activist campaigns with a value creation demand launched since January 2022
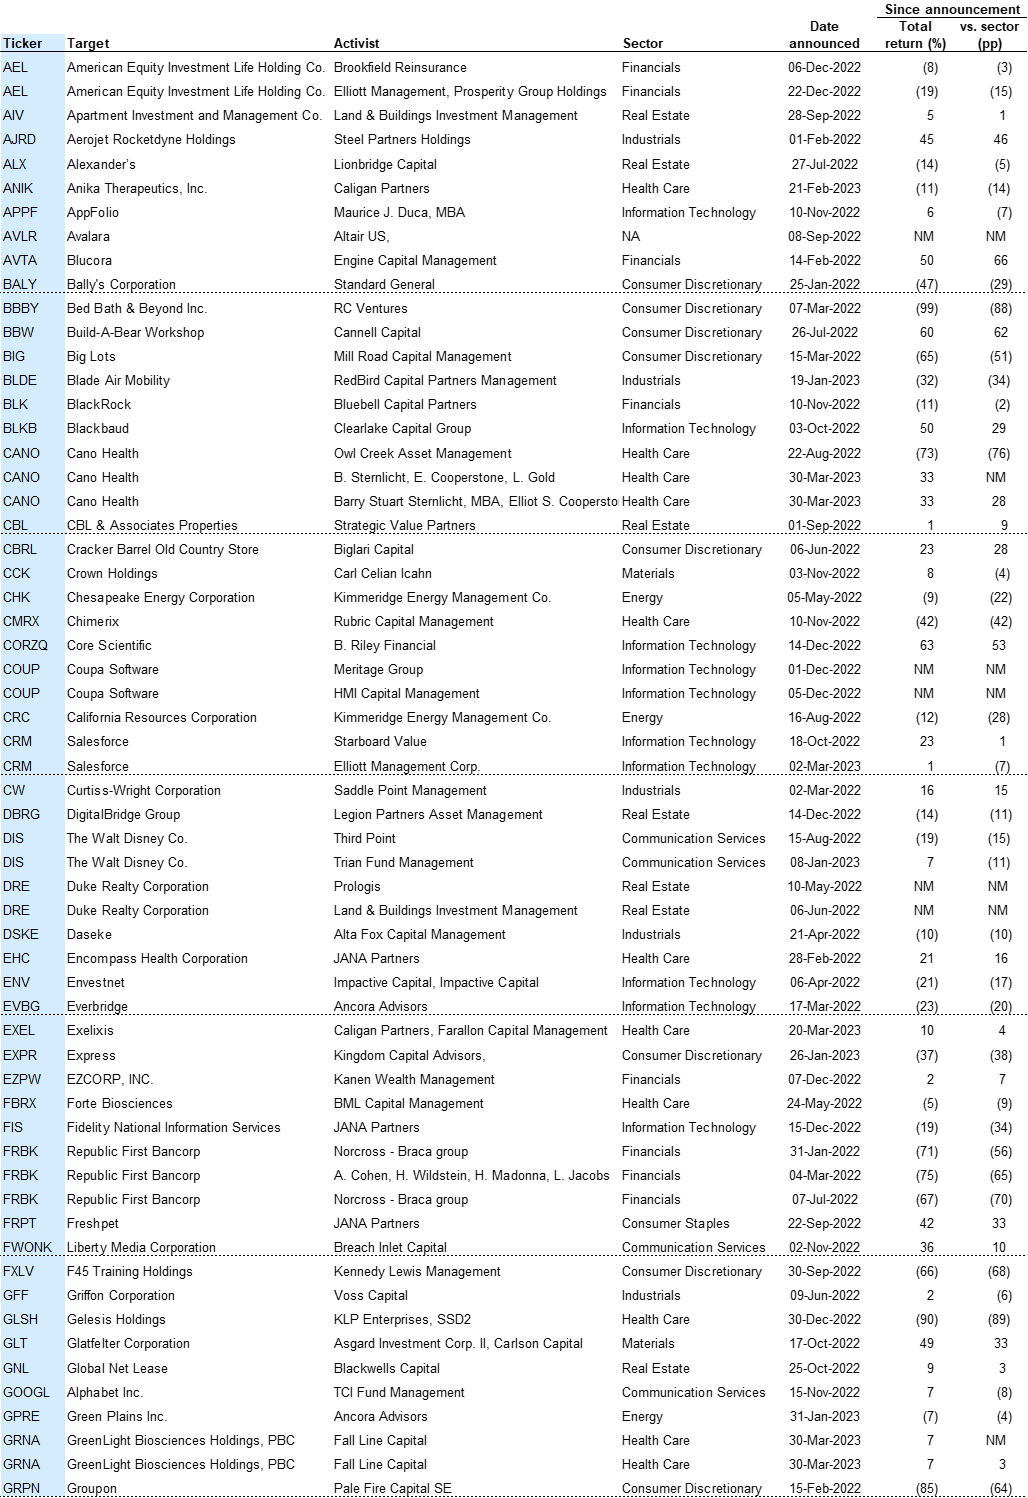
Exhibit 20 (continued): Activist campaigns with a value creation demand launched since 2022
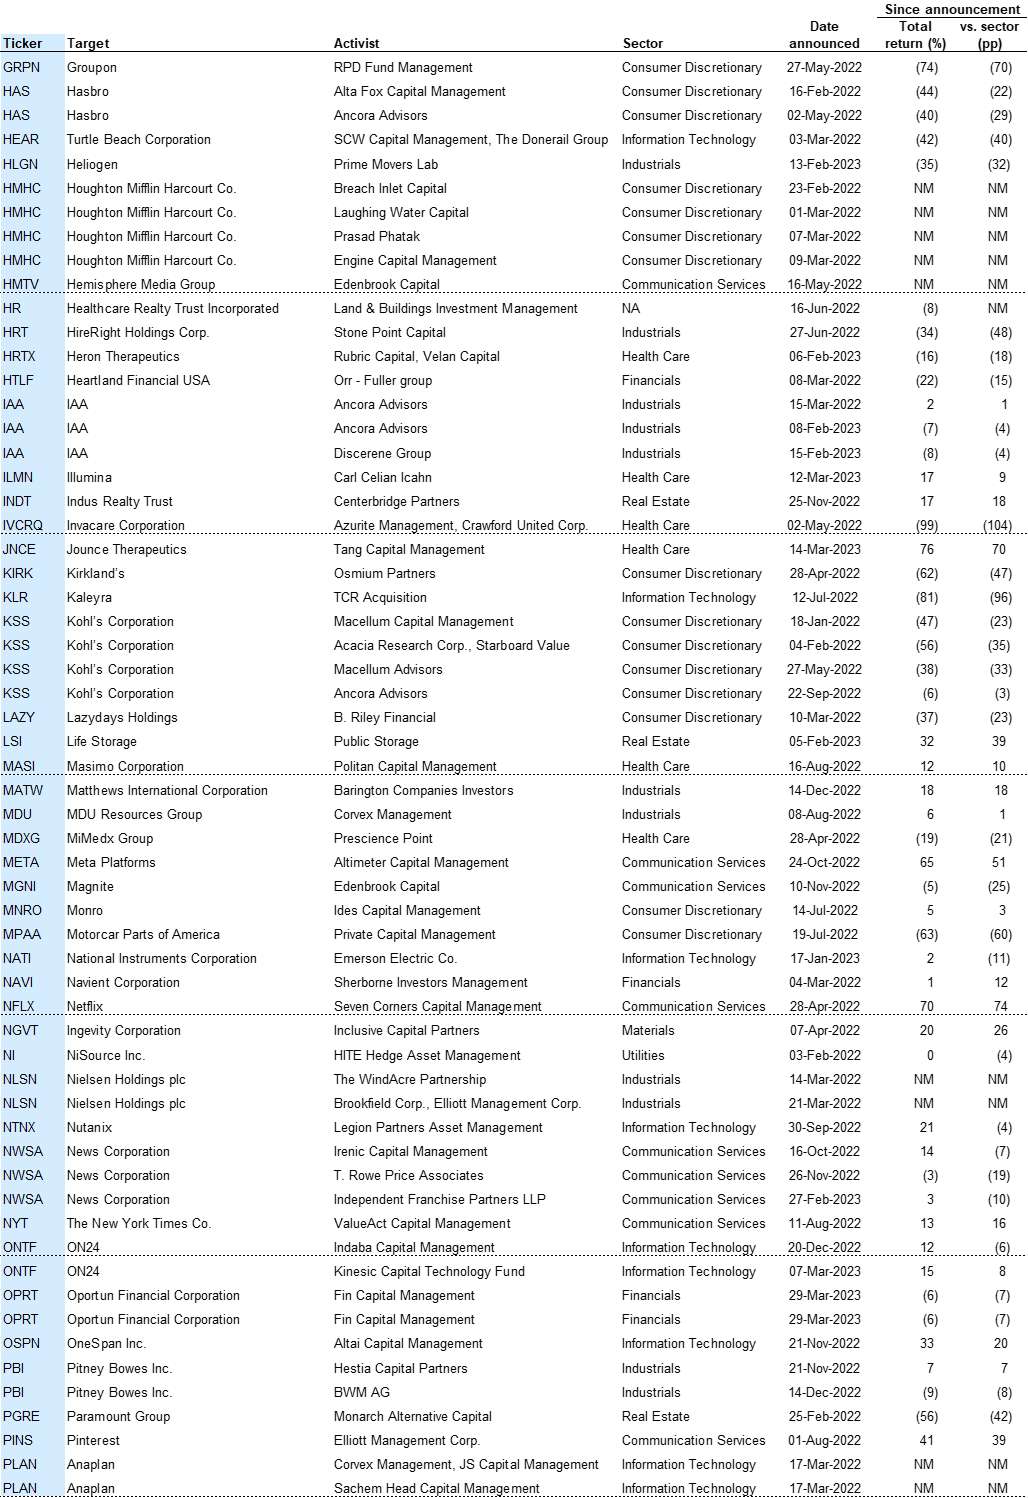
Exhibit 20 (continued): Activist campaigns with a value creation demand launched since 2022
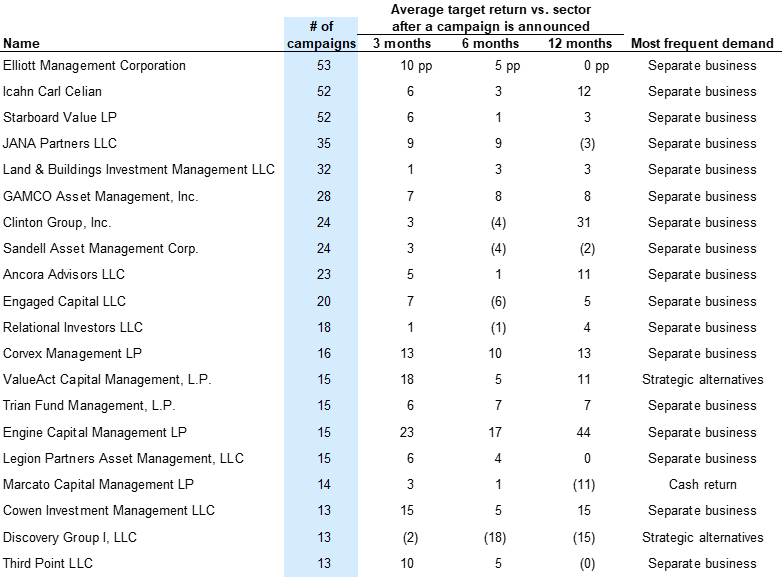
Appendix B: Investors with the most number of campaigns in our universe since 2006
Exhibit 21: 20 most frequent activist investors in our database
Appendix C: Notes on methodology
Activism data
Probit model on target selection
Investors should consider this report as only a single factor in making their investment decision. For Reg AC certification and other important disclosures, see the Disclosure Appendix, or go to www.gs.com/research/hedge.html.