Following the 15% selloff in oil prices over the last 3 weeks, forward prices now look unusually low relative to consensus and our own forecasts. We analyze the selloff, the implications of the large gap between consensus expectations and forwards, and the risks to our unchanged constructive Brent forecast.
We argue that near-term demand fears—related to US banking stress, China industrial weakness, and falling diesel margins—and financial amplification effects have driven the bulk of the recent selloff. Headlines about elevated oil supply in Russia and Iran, and fears of limited OPEC compliance to cuts have likely weighed on oil prices too, though we see these concerns as overblown. Statistically, we find that US banking stress and the OPEC cut together explain much of the daily price action over the last couple of months.
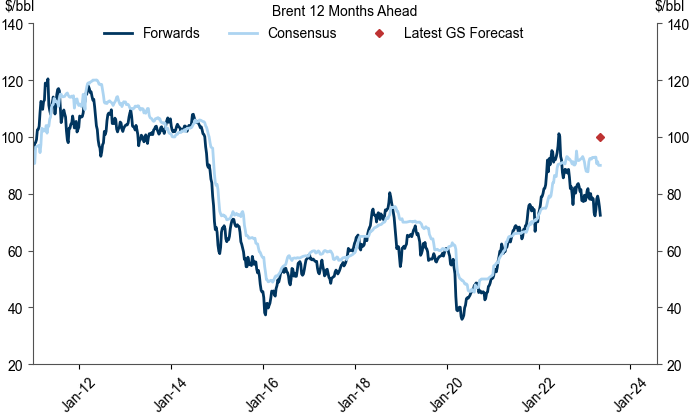
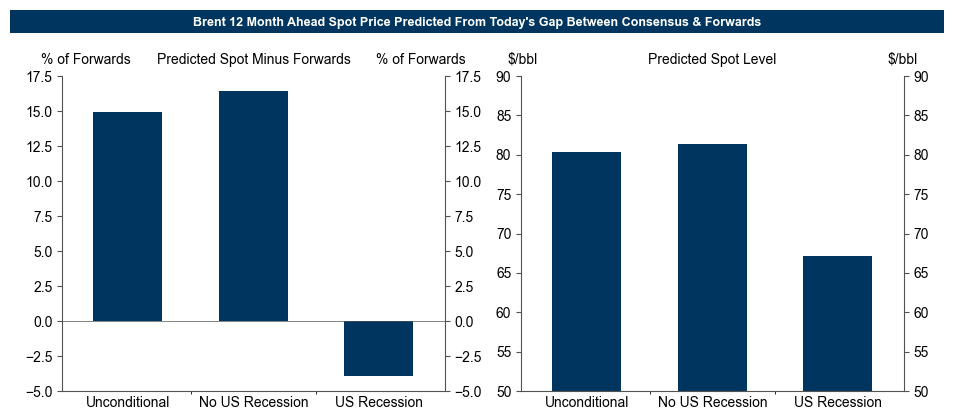
Today’s 29% gap between 12-months ahead Brent consensus expectations and the forwards ranks in the 98rd percentile vs. history. We find that future spot prices tend to end up significantly above forwards-implied levels when the consensus is above the forwards. A model using today’s gap suggests that spot prices in 12 months will end up 16% above today’s 12-month forwards outside a US recession, but 4% below in recession.
Our forecast remains that Brent rises to $95/bbl by December and $100/bbl by April 2024 as we expect large deficits in H2. While above-average DM recession risk and our China oil demand nowcast point to downside risk, we still expect rising EM demand to drive ¾ of the swing from the Q1 surplus to H2 deficits averaging 1½mb/d. The risks to our view that global supply edges down in H2 are two-sided with upside risks from Russia and Iran, but downside risks from potential additional OPEC cuts in H2 if oil prices were to not rise from here.
The Large Gap Between Consensus Expectations and Forwards Points to a Pessimistic Market Pricing Several Downside Risks
A Pessimistic Oil Market
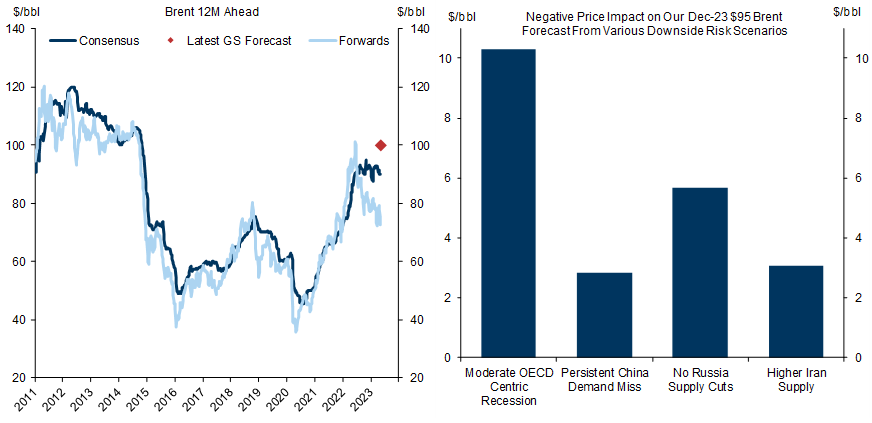
Exhibit 1: Oil Forwards Now Look Unusually Low Compared to Consensus Expectations
A Mostly Macro-Financial Selloff
Exhibit 2: Rising Concerns About US Banks and Falling Oil Prices
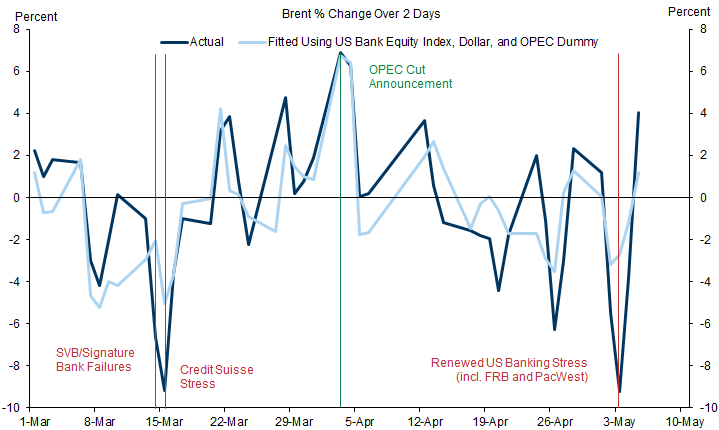
Exhibit 3: Demand Concerns on Weak China Manufacturing Data and Falling Distillate Cracks
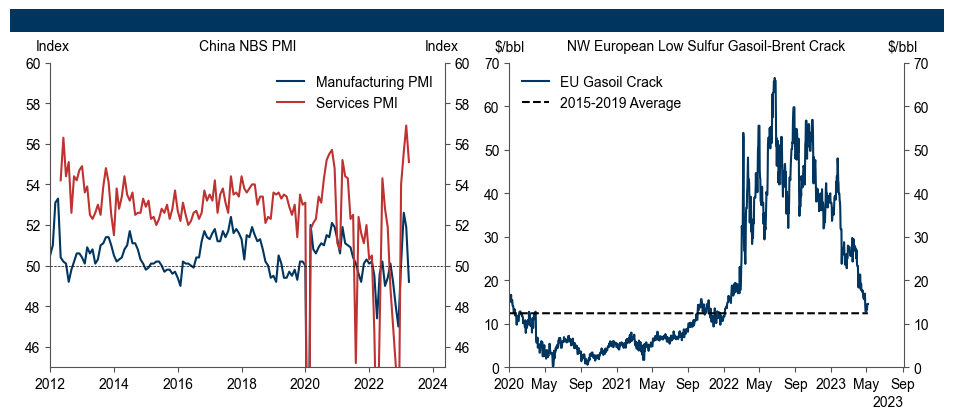
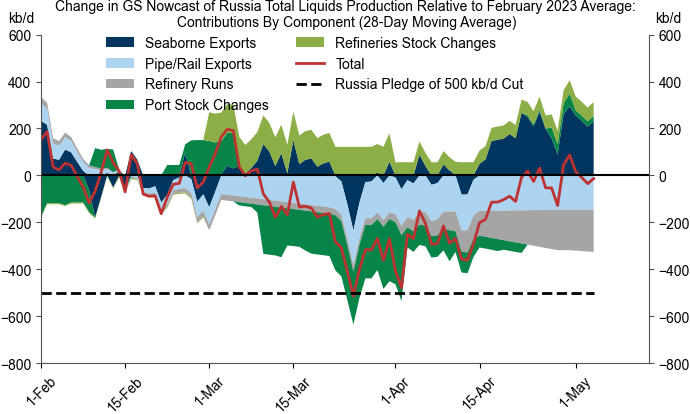
Exhibit 4: While Our Nowcast Offers No Evidence of Russia Production Cuts; We Suspect That Actual Production Has Fallen
Mind the Gap
Spot prices realize 4% above the consensus, and 7% above the 12-month forwards, consistent with a positive risk premium.
Spot prices end up significantly above forwards-implied levels when the consensus is above the forwards. Specifically, every 10% gap between the consensus and the forwards implies an additional 3% outperformance of spot versus the forwards (on top of the 6% outperformance when consensus and forwards are in line).
The predictive content of the consensus diminishes as the forecast horizon shortens, and disappears when the US economy ends up in recession.
Exhibit 5: Today’s Large Gap Between Consensus and the Forwards Suggests Spot Prices Will Likely End Up Well Above the Forwards
Some Downside Risks
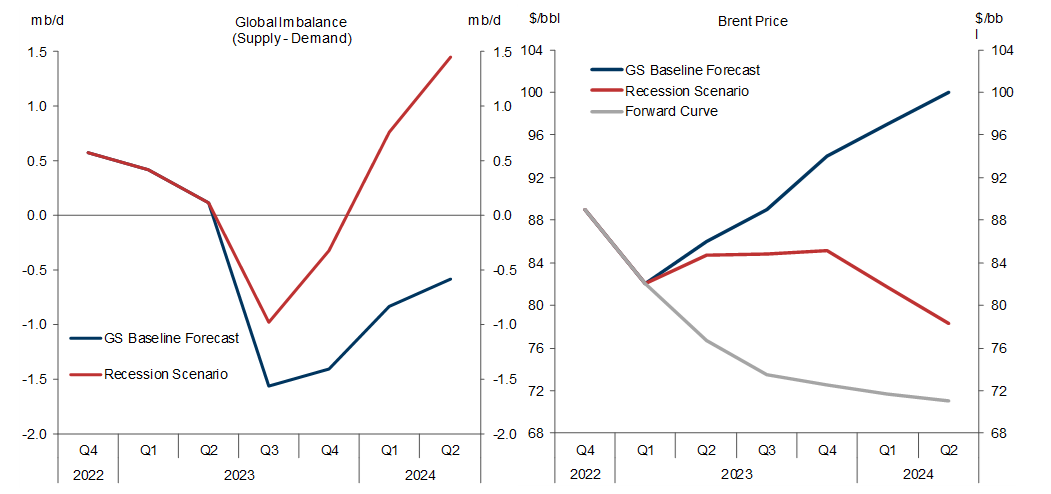
Exhibit 6: We Expect Deficits to Average 1.5mb/d in H2
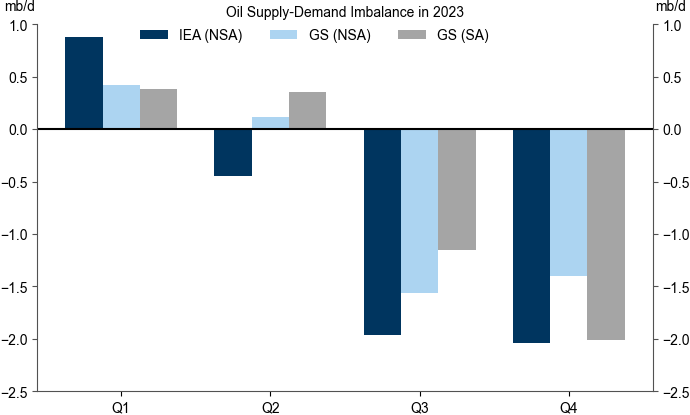
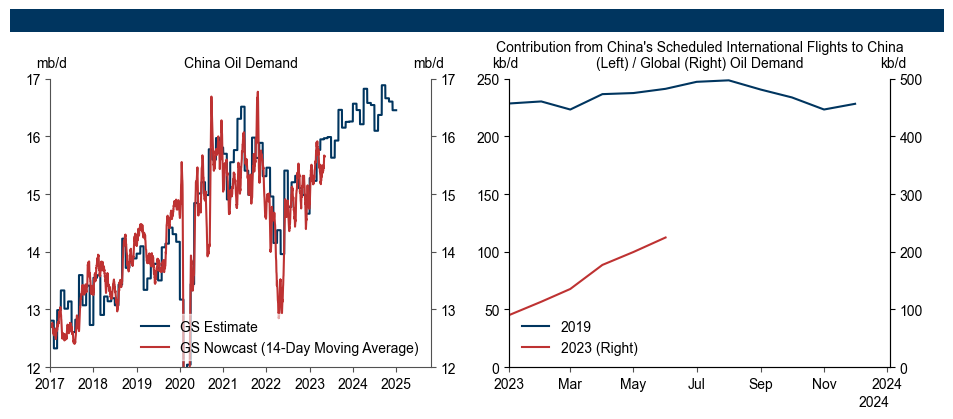
Exhibit 7: Room for Growth in International Travel and Jet Fuel Demand
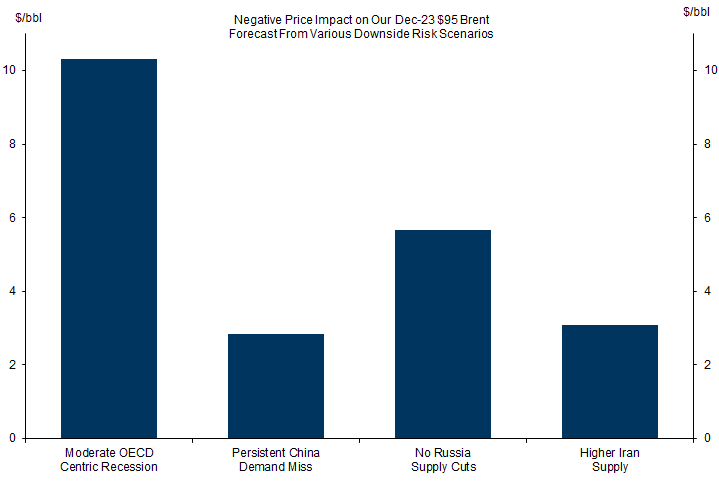
Moderate OECD-centric recession (-$10/bbl): This scenario assumes a moderate OECD recession starting in 2023Q3, lasting 4 quarters. It assumes a peak 4% hit to the level of GDP (relative to the GS baseline), which is slightly more moderate than the median historical recession in G10 economies, and modest spillovers to non-OECD economies. While the eventual hit to 2024Q2 prices relative to our baseline is sizable at -$22/bbl, the hit implied by our demand and pricing models to December 2023 prices is much smaller at just $10/bbl. The key reason is that spot oil markets generally price the near-term outlook for inventories, which only reach high levels after multiple quarters of demand damage. Exhibit 8 also suggests that oil markets are pricing an even more negative GDP outlook than this moderate recession (assuming the market shares our views on supply).
Exhibit 8: A Moderate OECD-Centric Recession Would Lower Brent Prices Eventually by $22/bbl
Persistent China demand miss (-$3/bbl): This scenario assumes that the 250kb/d miss on our China April demand forecast implied by the nowcast monthly average persists, and implies $3/bbl of downside risk to our December 2023 forecast.
No Russia supply cuts (-$6/bbl): This scenario assumes that Russia keeps total liquids production flat at its February level of 11.2mb/d, and implies $6/bbl of downside risk. Our central assumption remains that Russia cuts production, largely in the context of OPEC+ coordination.
Higher Iran supply (-$3/bbl): This scenario assumes that Iran production exceeds our forecast by $250kb/d from March onwards, and implies $3/bbl of downside risk.
Exhibit 9: Some Downside Risk To Our Constructive Brent Forecast
Daan Struyven
Romain Langlois
- 1 ^ We see some analogies with the tug of war in 2010-2012 between relatively tight fundamentals and European recession risk, where fundamentals eventually prevailed.
- 2 ^ Negative gamma effects are amplification effects resulting from producer hedging flows. Hedging often takes the form of put options, where market-making banks are short puts (i.e. long oil), and delta-hedge their exposure via futures. As prices fall, the put options move more in-the-money, leaving banks under-hedged unless they sell more futures. This leads to increasing selling of futures as prices decline, reinforcing the selloff.
- 3 ^ Our sample consists of weekly data from June 2006 to April 2023.
- 4 ^ In principle, expected future spot prices should equal the forwards plus the positive risk premium because oil demand and oil prices co-vary positively with the overall economy. Intuitively, holding oil entails risk, and, as a reward for that risk, investors will expect the spot price to rise above the current forward price.
- 5 ^ We also find that, on average, spot prices are modestly above the forwards, consistent with a positive marginal convenience yield (net of storage), and the need to incentivize production (rather than sitting on in-ground reserves which is equivalent to owning a call option with an exercise price equal to the extraction cost and the payoff equal to the spot price).
Investors should consider this report as only a single factor in making their investment decision. For Reg AC certification and other important disclosures, see the Disclosure Appendix, or go to www.gs.com/research/hedge.html.
Gallery
View all 10 exhibits