Goldman Sachs Research
China Data Insights
Why has youth unemployment risen so much in China?
Table of Contents
22 May 2023 | 7:14AM HKT | Research | Economics| By Maggie Wei and others
More
  • China’s youth unemployment rate (16-24 year olds) rose to 20.4% in April, despite a tick lower in the overall urban unemployment rate in April. Cross country experiences suggest youth unemployment rates tend to be higher than overall unemployment rates as this group appear particularly vulnerable to economic downcycles, likely due to a lack of experience. In this note, we examine potential drivers of China’s high youth unemployment rate.

  • We think both cyclical and structural factors have contributed to the elevated youth unemployment rate in China. On the cyclical front, the correlation between unemployment rate and services sector output gap is much stronger for the 16-24 age group compared with the 25-59 year-olds. NBS’s labor survey shows that services industries such as hotel and catering, education, and information technology sectors tend to hire more young workers. Services sector slackening before reopening therefore contributed to the high youth unemployment rate. The improvement in service sector activity growth in Q1 should lower youth unemployment rate in Q2 by 3pp based on our estimate. While the improvement in service activity growth implies rising demand for young workers, this increase in demand could be more than offset by strong supply seasonality. As we enter the graduation season, youth unemployment rate could rise by 3-4pp and peak in summertime (usually in July or August) before starting to decline from end of Q3, if we look at the seasonal pattern in 2018 and 2019 (prior to Covid).

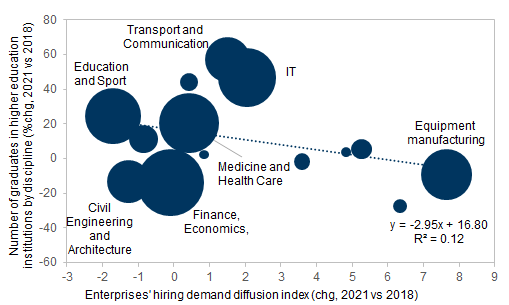
  • Structural imbalance is another reason behind the high youth unemployment rate. Despite the fact that a rising share of unemployed persons aged 16-24 years old have higher education, there appears to be misalignment of academic disciplines with business requirements. For example, the number of graduates from vocational schools who majored in education and sports rose by more than 20% in 2021 vs 2018, but hiring demand of education industry weakened meaningfully during the same period. Regulation changes over the past few years likely contributed to the weakening of labor demand in sectors such as Information Technology, Education and Property, which tend to hire more young workers. Skillset mismatches can only be dealt with gradually and might be a factor that contributes to high youth unemployment rate in the next few years.

  • We might see youth unemployment continuing its upward trend in the next few months on the back of strong supply seasonality despite government policies to create more jobs for graduates. Promoting further recovery of the services sector while exploring ways to reduce misalignment between discipline and business requirements seems key to reduce the youth unemployment rate over the medium term.

Why has youth unemployment risen so much in China?

Basic facts about youth unemployment
Chinese youth unemployment rate rose to 20.4% in April despite the falling overall surveyed urban unemployment rate—roughly double its level of around 10% pre-Covid—and anecdotal evidence suggests youth unemployment rate could be even higher than the official estimate. NBS stated that there are around 96mn 16-24year-olds in the urban areas; 32 mn 16-24 year-olds in the urban labor force (the rest are mainly still studying), 26mn 16-24 year-olds in urban employment (7% of urban employment), and roughly 6mn 16-24 year-olds unemployed (23% of urban unemployed persons). In other words, there are about 3mn additional unemployed 16-24 year-olds now relative to pre-Covid.
The youth population is an important driver for overall consumption. Macro data are lacking on this front, according to Zhu and Wei (2015), 15-24 year-old group accounted for 17% of total consumption (2010 data, based on household surveys and academic research). This age group tends to spend more on culture and education, residence (for example paying rents), transportation and communication.
While the elevated youth unemployment rate in China has caught a lot of market attention, when compared with global peers, China’s youth unemployment rate does not seem to be an outlier. Young people aged 15-24 years old appear particularly vulnerable when economic growth slows and labor market faces stresses. For example, ILO data showed youth unemployment rate in 2021 was more than 20% in a few European countries such as Spain, Italy, and close to 10% in the US in 2021. Note ILO’s definition is slightly different from NBS’s. ILO uses 15-24 age group while NBS survey looks at 16-24 age group. China does not seem to be an outlier when comparing its youth unemployment rate relative to income level among global peers.

Exhibit 1: Youth unemployment rate continued to climb in the first four months of the year despite China’s post-reopening recovery

1. Youth unemployment rate continued to climb in the first four months of the year despite China’s post-reopening recovery. Data available on request.
Source: NBS, Goldman Sachs Global Investment Research

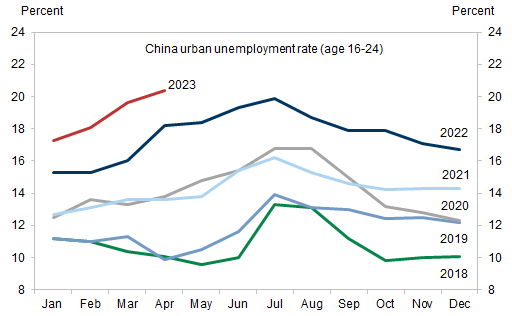
Exhibit 2: According to International Labor Organization’s data, China’s 15-24 age group unemployment rate was not really an outlier relative to other countries in 2021

2. According to International Labor Organization’s data, China’s 15-24 age group unemployment rate was not really an outlier relative to other countries in 2021. Data available on request.
Source: International Labor Organization, World Bank

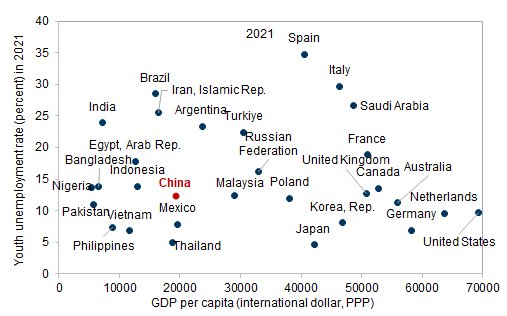
Exhibit 3: 16-24-year-olds contributed to more than 20% of urban unemployment

3. 16-24-year-olds contributed to more than 20% of urban unemployment. Data available on request.
Source: NBS
Why is youth unemployment rate so high recently?
As the youth accounted for close to 20% of consumption, increasing their employment and restoring their consumption power appear important to consumption recovery post reopening.
Youth tend to be particularly vulnerable during economic downcycles, probably due to a lack of work experience. Our analysis suggests that, compared with older workers, the 16-24 age group unemployment rate is more sensitive to fluctuations in the service activity growth. Exhibit 5 shows the correlation between unemployment rate and the 3-month lag of output gaps in the services sector for 16-24 age group and the 25-59 age group separately[1]. For each 1pp increase in services sector output gap, youth unemployment rate would rise by 0.6pp, while the unemployment rate for the 25-59 year-olds might be little changed. NBS data on employment suggest services sectors such as hotel and catering, education, and IT industries tend to hire more young employees compared with other sectors.
The services sector shows significant output gaps since last year as Covid outbreaks and related control measures weighed on services activities. Output gap in the services sector narrowed materially in Q1 this year from -7pp in December 2022 to -1.2pp in April 2023, on the back of reopening boost to the economy. This would imply 3pp lower youth unemployment rate in Q2 this year according to our analysis on the lead-lag correlation between youth unemployment and services sector output gap. While the improvement in service activity growth implies rising demand for young workers, this increase in demand could be more than offset by strong supply seasonality. As we enter the graduation season, youth unemployment rate could rise by 3-4pp and peak in summertime (usually in July or August) before starting to decline from end of Q3, if we look at the seasonal pattern in 2018 and 2019 (prior to Covid). As a result, we might see youth unemployment continuing its upward trend in the next few months.

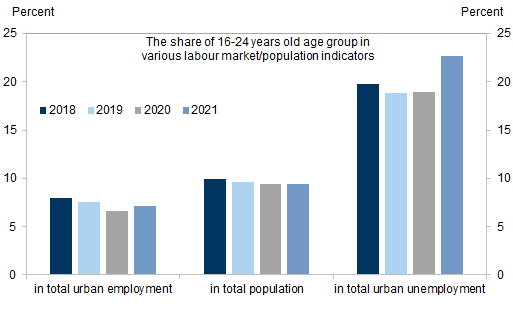
Exhibit 4: Youth unemployment rate demonstrated bigger cyclical pattern than unemployment rate for 25-59 age group

Note that estimates of services sector output gap could be quite sensitive to estimates to service production trend
4. Youth unemployment rate demonstrated bigger cyclical pattern than unemployment rate for 25-59 age group. Data available on request.
Source: NBS, Goldman Sachs Global Investment Research

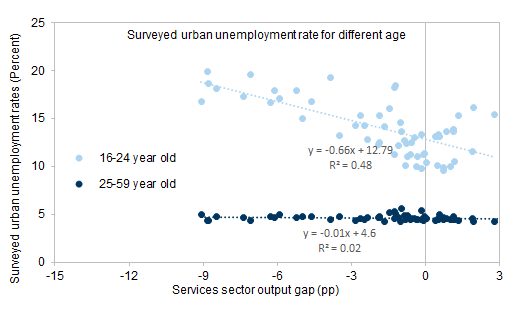
Exhibit 5: Hotel and catering, education, household services industries tend to hire more 16-24 year-old employees

5. Hotel and catering, education, household services industries tend to hire more 16-24 year-old employees. Data available on request.
Source: NBS
Structural reasons behind elevated youth unemployment rate
Although our analysis above suggests youth unemployment rate is quite cyclical and is set to decline as service activity growth improves, there may be other structural headwinds contributing to the high youth unemployment rate. In particular, mismatches between skillset graduates acquired from their higher education and skillset required by employers in industry with booming labor demand might have caused frictions in the labor market and therefore contributed to high youth unemployment rate.
We plot a chart on the growth of the number of graduates by discipline and hiring demand by industry, according to NBS’s data.[2] There appears to be misalignment between discipline and business requirement, though graduates could choose jobs that are not directly relevant to their discipline. For example, the number of graduates in education/sports discipline grew by more than 20% in 2021 relative to 2018, while hiring demand of education industry as a whole weakened materially during the same period. As we discussed in our previous report, regulation changes in recent years towards IT, education, and property sector might have contributed to the weakening of labor demand in these sectors.

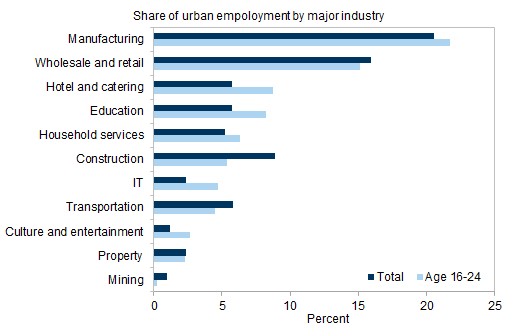
Exhibit 6: According to NBS survey, hiring demand weakened materially in 2022

6. According to NBS survey, hiring demand weakened materially in 2022. Data available on request.
Source: NBS

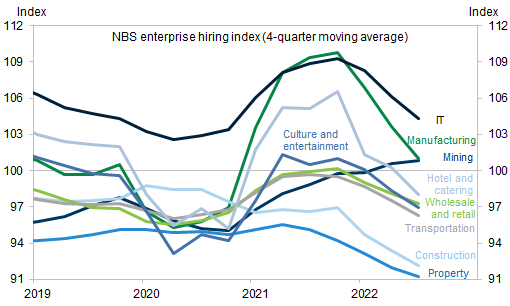
Exhibit 7: ...and there seems to be misalignment between discipline and business requirements (bubble size represents the number of graduates by discipline)

7. ...and there seems to be misalignment between discipline and business requirements (bubble size represents the number of graduates by discipline). Data available on request.
Source: Ministry of Education, NBS
Policy solutions
Our analysis and detailed data on youth unemployment suggest promoting services activity growth could help lower youth unemployment rate. A complete closure of service sector output gap from current level could reduce youth unemployment rate by up to 7pp according to our estimate, although this could overestimate the potential improvement if some of the weakness in sectors such as education and information technology may have become structural on regulatory tightening.
Policymakers announced different measures to promote employment for college graduates, for example through various activities to encourage enterprises to expand their hiring of graduates, Chinese military’s recruitment prioritizing college graduates, and SOEs are creating 1 million internship positions for graduates over the next two years. These measures could help graduates to find jobs though the impact on nationwide youth unemployment could be relatively limited. Addressing the misalignment between school disciplines and business demand would help, but this is a difficult and medium-term task and unlikely to yield significant improvement in the short run.
*We thank Sabrina Luk, the intern in Asia Economics team, for her contribution.
  1. 1 ^ We estimate the output gap of the services sector by looking at the difference between actual performance of the service production index, after SA, and our estimate of the trend level of services output. We apply HP filter to estimate trend before 2019, and roll the trend level series forward through 2023 by assuming the trend growth rate from 2020 to 2023 decelerates by around 0.5pp per year vs the growth rate in 2019. We also tried to include output gap of the manufacturing sector in the analysis, but it is not significant.
  2. 2 ^ We look at vocational schools’ data as the Ministry of Education provides more comprehensive data on vocational schools’ disciplines. Graduates from vocational school take around 40% in total graduates from higher education institutions.

Investors should consider this report as only a single factor in making their investment decision. For Reg AC certification and other important disclosures, see the Disclosure Appendix, or go to www.gs.com/research/hedge.html.