Commodity Views
The 'great de-stocking'
1. Unprecedented physical de-stocking. While it is tempting to blame the large sell-off in oil and commodities on financial liquidation given unprecedented paper selling, physical selling is nearly as large. Bulls, like ourselves, find comfort in the fact that end-use demand across the commodity complex has not shown recessionary signs and investment in supply remains elusive, but this misses the point that we were wrong on price expectations. Despite weak manufacturing-related demand, overall demand and inventory data across the commodity complex support our more bullish view. Yet, prices continue to move against our forecasts. What is the explanation? It is likely the largest commodity de-stocking the complex has ever witnessed; hence, the 'great de-stocking.' Such unprecedented de-stocking should not be surprising. Markets have rarely seen such a sharp rise in funding costs from such a low level. And, given the rare inflationary backdrop faced by governments around the world, they are using every tool at their disposal. French, Chinese and US SPRs are down c.250 million barrels, and the recent collapse in clean freight rates and long-awaited decline in Iranian floating storage is indicative of Western governments taking a less discerning approach to sanctioning commodity supply, including Russia where supply has surprised to the upside. US shale oil DUCs[1] have also been de-stocked. However, it is not just oil and governments fighting inflation. The analogy extends to metals and non-energy sectors as goods production and manufacturing in the West has been lower than demand. In our view, recessionary concerns, higher rates and healing in global goods supply chains have led to a broad de-stocking of wholesale goods and inputs. While this creates weaker industrial production and stokes recessionary fears, it does not reflect weak end-use demand in the West which, in our view, is skewed to the upside from here on improved supplies in gas and energy markets in Europe with TTF gas prices now below EUR 30/MWh.
Exhibit 1: Oil has kept destocking over the past 2 years, while investors have recently shed most of their positions in the market
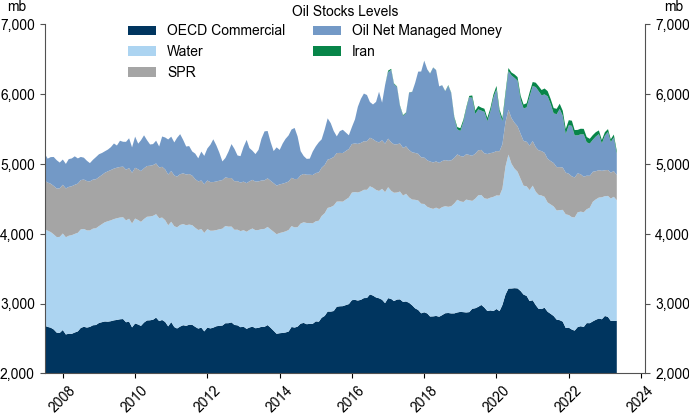
Source: EIA, IEA, Kpler, CFTC, Refinitiv Eikon, Goldman Sachs Global Investment Research
2. An equally large financial de-stock. Financially, paper commodities experienced a similar de-stock given the cost of holding positions against higher funding costs and more volatility. In the past 30 days, oil has seen 250 million barrels of paper selling and copper 0.4 mt of paper selling. This makes industrial commodities like copper and gasoil net short, bringing managed money in commodity indices to a new low going back to the early 2000s. For crude oil, net positioning is now as short as it was during Covid when inventories reached record levels, breaching capacity constraints which caused oil prices to quickly turn negative. Why has market positioning swung so negatively? In our view, mounting concerns over the health of the financial sector, US debt ceiling risks, fears of an impending demand slowdown in the West as well as a disappointing recovery in China in April have further raised fears of an upcoming US or global recession. The bottom line is markets have cashed in on their insurance policies in the form of physical and financial hedges. On net, this leaves the entire complex exposed to upside should recessionary risks not materialize. From a portfolio perspective, this also makes a strategic commodity allocation a very good hedge. Commodities and rate markets have priced in a recession while equities have only priced in the positive aspects of that outcome via lower interest rates and lower commodity prices. The absence of a recession would likely lead to higher oil and commodity prices as well as higher rates, to which equities would likely react poorly. We now forecast the S&P GSCI to return 30.3% on a 12-month horizon.
3. Rock beats paper. De-stocking is not irrational if one expects a US recession over the next year, a probability the market puts at 55% versus GS at 35%. We acknowledge Western manufacturing demand for metals has been weak, as has the goods sector overall, as it normalized from the Covid surge. However, like in oil, strong EM demand has been offsetting that weakness keeping inventory levels low. Nonetheless, recessionary concerns have resulted in commodity prices that are lower than what fundamentals would suggest. In oil, we estimate this at around $10-15/bbl and in copper around $1000/mt. If we view rock as commodity fundamentals (oil included) and paper as speculative positioning in financial commodities, then paper is currently beating rock as in traditional Rochambeau (as the paper covers the rock). Such a statement may seem contradictory since we have long argued that commodities are spot assets, driven by today’s fundamentals, and not anticipatory like equities and bonds which are driven by expectations of future fundamentals. To see why this is not contradictory goes to the point that, key paper distortions, if incorrect, will disappear over time. Barring a global recession, rock (fundamentals) should beat paper (positioning) during 2H23, creating an unwind of the significant build-up in shorts. Moreover, a sharp rise in commodity prices could shift the trend and attract long-term money back to the space. The key is what could be the catalyst? As much of the physical and paper de-stocking was motivated by recessionary fears, a risk reversal must come from an easing of such fears or a strong rebound in Chinese manufacturing once margins improve, concurrent with a physical tightening in commodity markets.
Exhibit 2: Oil positioning is back to early Covid levels
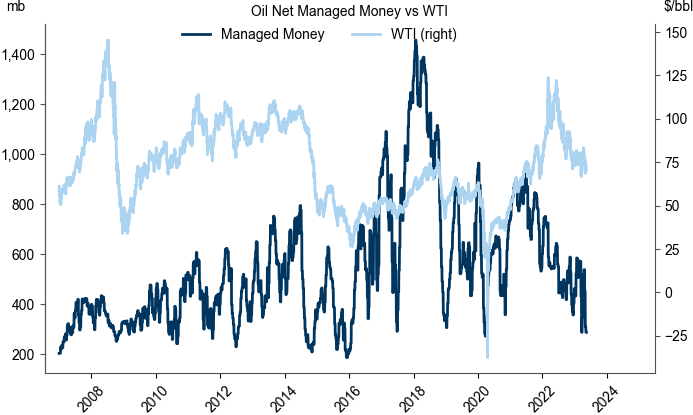
Source: CFTC, Reuters, CME, Goldman Sachs Global Investment Research
Exhibit 3: Commodities AUM slumped as investors exited the oil trade
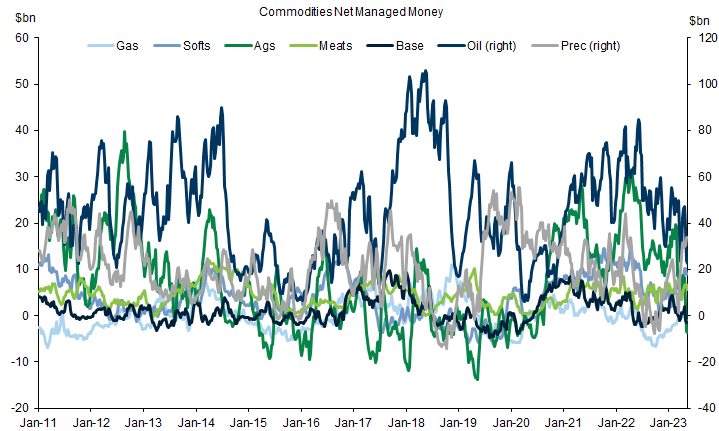
Source: CFTC, CME, Bloomberg, Goldman Sachs Global Investment Research
Exhibit 4: Net managed money is currently at its 3rd percentile as investors exit the oil space
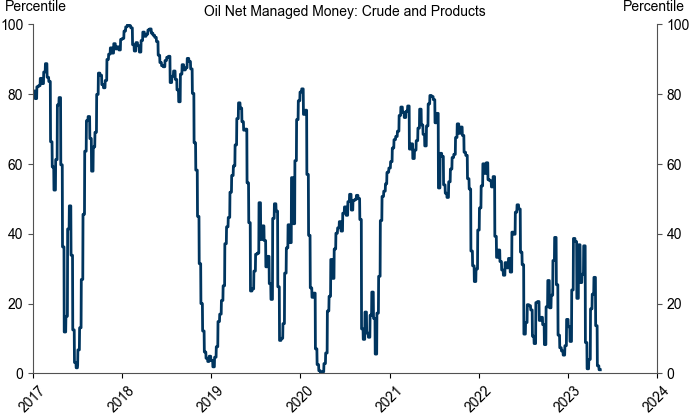
Source: CFTC, Refinitiv Eikon
4. In oil, demand has surprised to the upside. Despite all the concerns over a recession that many market participants view as almost certain during 2H23, it is important to emphasize that the evidence in commodities supports stronger not weaker demand. Beginning with oil, the IEA and other forecasters, including ourselves, have actually steadily increased oil demand growth forecasts this year. In fact, the IEA has raised projections every month since last November, and as recently as this week as strong EM demand continues to outpace a weaker DM environment. Further, given that 70% of oil demand is tied to the service sector in both the West and China where there is still plenty of room to rise back to trend, such strong growth in oil demand should be expected into the end of this year. Indeed, the IEA just increased its Chinese demand growth outlook due to the strong service sector performance that has more room to run. That is not to say commodity fundamentals have been rock-solid; however, we believe that it is mostly supply, rather than demand, that is to blame for softer-than-expected balances. Crude oil output in Russia surprised by a remarkable 2 million b/d since the middle of last year, leading to stronger-than-expected exports of both crude oil and distillates at a time when Western sanctions were softened. The more seamless redirection of Russian barrels, particularly to Asia and the Middle East, was further met by rising exports of Iranian barrels on a sharp decline in floating storage, all of which explains why oil inventories, with the exception of stocks on water, have continued to rise, despite the announced OPEC+ curtailment. Although we believe the supply developments in oil to be temporary, as we expect OPEC to remain highly compliant to its announced cut, the ongoing dynamic with regard to Russian supply is a bearish risk for oil.
Exhibit 5: The IEA has been revising up its global oil demand growth forecast over the last six months
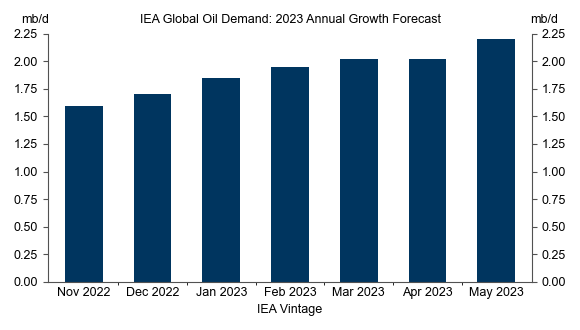
Source: IEA, Goldman Sachs Global Investment Research
Exhibit 6: 70% of global oil demand is related to the still growing services sector
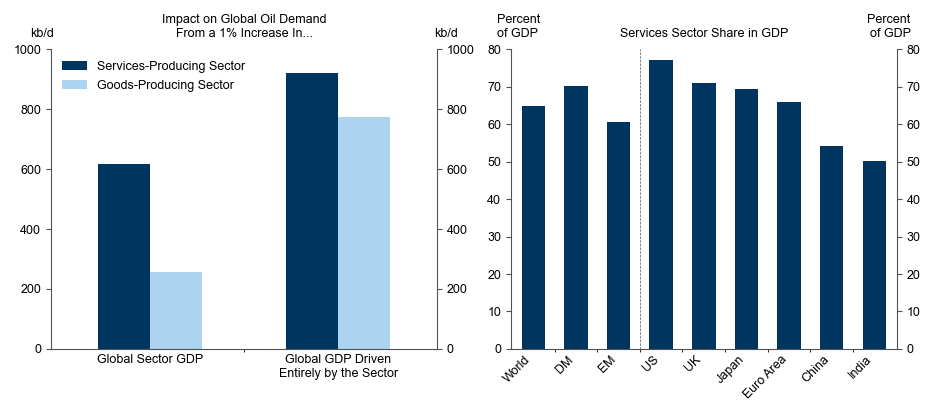
Source: IEA, Haver, Goldman Sachs Global Investment Research
5. China's demand lags front-loaded production. Turning to China, both goods and services demand are below trend as Chinese consumers did not receive subsidies in the form of stimulus checks as US consumers did to create a surge in goods demand. In fact, goods output in China surged before demand could recover without government help. Without government help consumers need to rebuild income and are more reluctant to spend out of savings, unlike what we've seen in the US. Manufacturers stand in sharp contrast to this, however, in the sense that they just needed workers to return to factories, and they could, and did, front-load output into the first quarter. This caused margins to weaken, which then created a drop in output during April; however, this doesn’t signal a reversal in Chinese demand but rather the need for supply to catch back down to demand. While much has been made of the April weakness in Chinese goods demand, much of that was in housing where pent-up demand from lockdowns and the Chinese New Year created a surge in March property demand that is now normalizing. It is important to emphasize that service demand such as that in restaurants is steadily improving as incomes improve, consistent with the more steady improvement in Chinese oil demand and mobility.
6. China’s de-stock merely delays the onshore copper offset. Our initial constructive view on industrial metals for this year has centred on China’s growth and demand resurgence acting as offsets to Western cyclical headwinds. The reality ytd has been that China’s metals demand resurgence has been on track with our expectations, at least for the green economy tied metals (aluminium and copper), but that this has yet to fully pass through into import trends, which would then act as a tightening effect on ex-China balance. Despite China’s copper demand growing by 5% y/y year-to-date, in line with our full-year expectation, over the same period net refined imports have fallen 15% y/y. With Western metals demand deteriorating over the same timeframe, this has left ex-China markets skewed toward surplus in the short term. We do, however, see this dislocation in metal market dynamics as temporary, given that the disjuncture between China end-demand and metal imports reflects a significant run-down of local inventories. That inevitably is feeding a mounting incentive for imports that has been reflected in the progressive positive trend in arbs, which is now close to open for copper. As this adjustment plays out, we think this will be a critical stabiliser for price dynamics with short covering risks high given spec positioning is at its highest net short since the initial Covid impact in Q120. However, the potential for sustained bullish momentum in prices will likely be tied to an improvement in China activity data momentum, at least until the micro can provide an extreme bind via inventory depletion risk, a scenario still possible by mid-Q4 this year. Importantly, we continue to project a full year metal deficit for copper (GSe 167kt vs. 248kt prior deficit) and expect a resurgence in upside after this trough phase (current price targets on a 3/6/12M basis of $7,750/9,200/10,000/t).
Exhibit 7: A slowdown in global manufacturing has weighed on macro sentiment and investor positioning in industrial metals
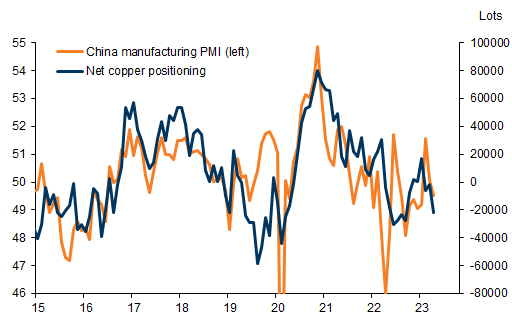
Source: Goldman Sachs Global Investment Research, Bloomberg, Haver Analytics
Exhibit 8: However, after downgrades to ex-China demand assumptions, our balances still point to clear global copper and aluminium deficits, but clear surpluses in nickel and zinc
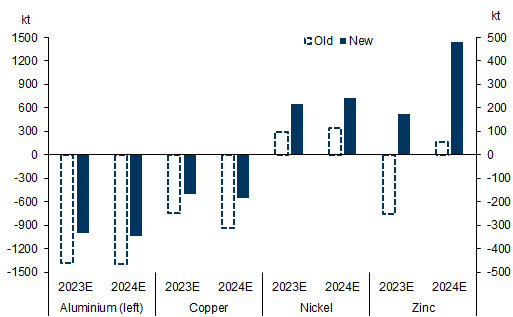
Source: Goldman Sachs Global Investment Research
Exhibit 9: Visible stock cover has fallen sharply in China since February's peak, which points to an upswing in imports to prevent onshore depletion which will, in turn, re-tighten ex-China markets

Source: Goldman Sachs Global Investment Research, Wind, Bloomberg, SMM
Exhibit 10: Historical performance suggests that copper can achieve high returns if a recession is avoided past peak inflation
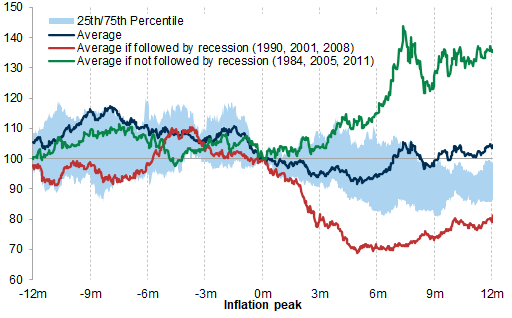
Source: Goldman Sachs Global Investment Research
7. Western strategic metals stockpiling. At the same time, in metals, Western governments are proposing new insurance policies in the form of building strategic reserves of green metals to meet the expected surge in green demand. The French government has already announced plans to launch a fund (sized as €2 billion) to finance security of supply in raw minerals key to the green transition. The EU have also indicated plans to create a platform for the joint purchase of critical minerals for green technologies, which follows on from the recent success of a similar programme deployed for joint gas purchases. Moreover, the EC proposed in March that such joint purchases could be used to build better stock buffers of critical minerals for green technologies. Such a solution could replicate the strategic stockpiles of key commodities undertaken by China’s Strategic Reserve Bureau (on metals) and the US Strategic Petroleum Reserve (on oil), which target holding 3 months of commodity import volume cover. If such a mechanism were replicated in Europe for critical minerals, based on current import volumes that would imply building a regional stockpile of 250kt of refined copper and 1.4Mt of primary aluminium. If the US were also to replicate such a policy – for now they do not classify copper or aluminium as critical minerals – that would mean building stockpiles of 180kt of refined copper and 1Mt of primary aluminium, respectively. Given that current visible global inventories of copper (370kt) and aluminium (1.2Mt) are broadly equivalent to just one region's 3-month import cover, even an attempt at more modest import cover would generate a meaningful tightening effect on respective markets. In that context, while some stockpiling of these metals is ultimately likely as part of a portfolio of supply security solutions, it is also probable that governments incentivise traders to secure supply via subsidised credit, just as the German government announced earlier this year.
Exhibit 11: An attempt to build a three-month import cover stockpile would generate a meaningful tightening effect on copper and aluminium market
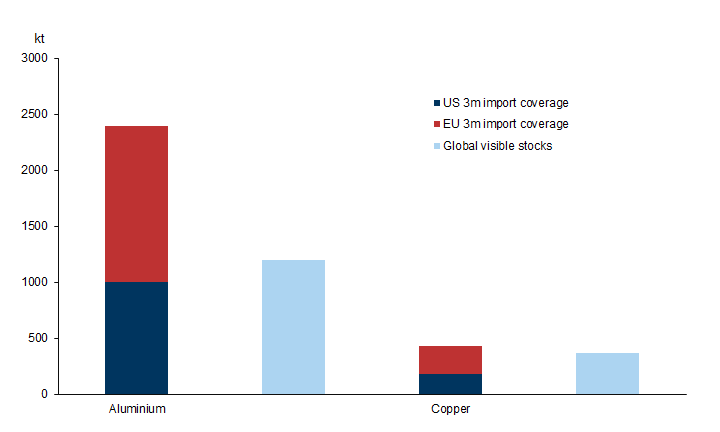
Source: Goldman Sachs Global Investment Research, Eurostat, GTT
8. With uncertainty elevated, investors are likely to turn to gold. While such a recessionary outlook would normally be good for gold, recently gold prices have stagnated around $2000/toz. The key reason for this is that the situation with the regional banks in the US had proved to be far less concerning than originally thought by the market, and recent data even suggest that our economists' small expected hit to US growth may turn out to be pessimistic. Nonetheless, we do like gold from here as we are moving past Fed hawkishness since the US is seemingly slowing without derailing growth elsewhere. That should support a rise in investment demand for gold that has been virtually absent in the last two years. Meanwhile, China and EM central banks continue to rapidly purchase gold, a trend that we expect to continue to dominate gold demand on the back of elevated geopolitical risks and de-dollarisation trends. All in, we stick to our gold target of $2050/toz.
9. Low natural gas prices to spur demand and manufacturing in Europe. In European natural gas, the weakness in energy-intensive manufacturing visible in the April data exacerbated the softness in the market illustrated by exceptionally high storage levels coming into summer and led us to lower our Sum23 TTF price forecast. However, even in gas, we believe that current low prices, restocking, and above-consensus economic activity will lead to sequentially rising demand. Further, the gradual improvement we expect in China demand for goods over the course of the year will likely support China manufacturing and, as a result, China LNG imports for industrial consumption, leaving fewer cargoes available to Europe. This will ultimately drive European gas balances tighter and, hence, require higher prices later this year. Importantly, even if industrial demand remains sluggish this summer, this is not a guarantee that European storage will be comfortable throughout winter. The combination of winter weather risk and potentially declining conservation efforts by households can quickly tighten balances, enough to trigger a sharp rise in winter prices above 100 EUR.
Exhibit 12: European industrial activity remains soft, particularly in energy intensive sectors
EU industrial production, index
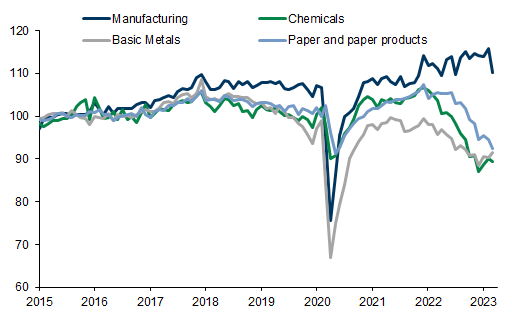
Source: Eurostat, Haver Analytics, Goldman Sachs Global Investment Research
Exhibit 13: We expect a recovery in Chinese industrial activity to lead to higher LNG imports year-on-year
China LNG imports (GSe from May23), mtpa
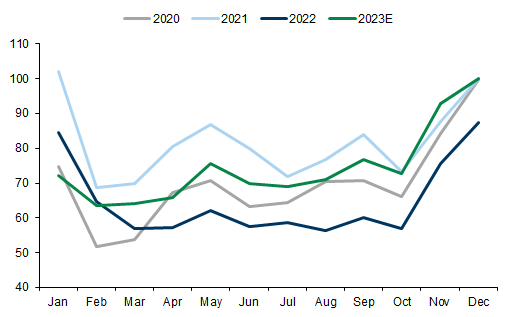
Source: Kpler, Goldman Sachs Global Investment Research
10. Abundant supplies driving grains lower. Regarding grains, corn and wheat sold off following the extension for 2 months of the current Black Sea grain deal. This extension reduces the risk of disruptions to Ukrainian – and Russian – exports in both markets, ensuring the availability of cheap grain in Eastern Europe. This recent move compounds with excellent planting in the US, where the latest WASDE report mentions a total 2023 acreage in line with 2021 highs at 314 million. More specifically, soybean prices just hit 9-month lows, on high USDA projections for the 2023-24 harvest, and still weak signals regarding feed demand in China. For corn, on top of high production estimates for 2023-24, the USDA also lowered its forecasts for the use of 2022-23 production, as US exports remain noncompetitive against a very low Brazilian and Argentinian basis.
Exhibit 14: Bloomberg Commodity Index Forecast
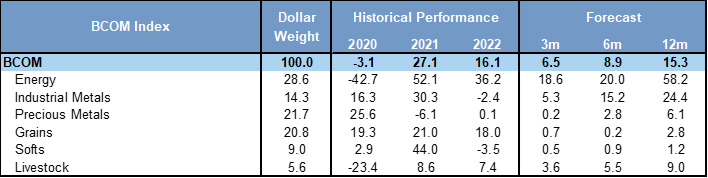
Source: Goldman Sachs Global Investment Research
Exhibit 15: S&P GSCI® Forecast
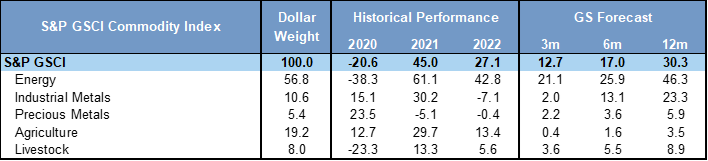
Source: Goldman Sachs Global Investment Research
- 1 ^ DUCs refer to drilled but uncompleted wells.
Investors should consider this report as only a single factor in making their investment decision. For Reg AC certification and other important disclosures, see the Disclosure Appendix, or go to www.gs.com/research/hedge.html.