Goldman Sachs Research
Global Economics Analyst
The Path to 2075 — Capital Market Size and Opportunity (Daly/Gedminas)
8 June 2023 | 8:37AM EDT | Research | Economics| By Jan Hatzius and others
More
  • We recently set out long-term growth projections for the global economy, covering 104 countries out to the year 2075. We expect EM growth to continue to outstrip DM over the remainder of this decade (3.8% vs. 1.8%). In 2050, we project that the world's five largest economies (measured in US$) will be China, the US, India, Indonesia, and Germany. By 2075, China, the US, and India are likely to remain the three largest economies and, with the right policies and institutions, seven of the world's top ten economies are projected to be EMs.

  • We now extend our analysis to project the future growth of global capital markets, focusing on equity market capitalisation. To convert our long-term GDP projections into estimates of future equity market capitalisation, we exploit the fact that equity market capitalisation-to-GDP ratios tend to increase with GDP per capita. Given the convergence taking place in EM GDP per capita levels, this implies that EM equity assets are likely to grow more rapidly than GDP.

  • We expect EM equities to outperform DM in the longer run, due to stronger earnings growth and, as risk premia fall, multiple expansion. However, the most important dynamic underlying EM capital market growth in our projections is the equitisation of corporate assets, the deepening of capital markets, and the disintermediation that takes place as financial development proceeds (processes that do not, by themselves, imply EM equity outperformance).

  • Our projections imply that EMs' share of global equity market capitalisation will rise from around 27% currently to 35% in 2030, 47% in 2050, and 55% in 2075. We expect India to record the largest increase in global market cap share – from a little under 3% in 2022 to 8% in 2050, and 12% in 2075 – reflecting a favourable demographic outlook and rapid GDP per capita growth. We project that China’s share will rise from 10% to 15% by 2050 but, reflecting a demographic-led slowdown in potential growth, that it will then decline to around 13% by 2075. The increasing importance of equity markets outside the US implies that its share is projected to fall from 42% in 2022 to 27% in 2050, and 22% in 2075.

  • Openness to trade and capital flows is a necessary condition for the successful development of capital markets. Of the many risks to our projections, we view the possibility that populist nationalism leads to increased protectionism and a reversal of globalisation as the most significant.

The Path to 2075 — Capital Market Size and Opportunity

We recently set out long-term growth projections for the global economy, covering 104 countries out to the year 2075. We found that, although real GDP growth has slowed in both developed and emerging economies in the past 10-15 years, income convergence between emerging (EM) and developed (DM) economies remains intact, despite the variety of shocks that the global economy has faced over this period (including the Global Financial Crisis and the Covid pandemic).
The continuation of EM-DM income convergence implies that the share of global GDP accounted for by EMs will continue to rise over time; their incomes will converge gradually towards developed economy levels; and the distribution of global income will shift towards this growing group of ‘middle-income’ economies.
In this Global Economics Analyst, we extend our analysis to project the future growth of global capital markets, identifying the economies that we expect to become major capital markets over time.

Our Long-Term Projections — The Rising Importance of Major EMs

Before looking at the implications for capital markets growth, we first review the long-term projections that we had set out in detail in our previous paper.[1] Exhibit 1 provides a high-level summary of our projections for the major regional aggregates, broken down by decade. Because of the large swings in GDP growth generated by the Covid pandemic, the 2024-29 column provides the cleanest indication of what our model indicates for near-term potential growth.
Our projections imply that global growth in 2024-29 (2.8%) will be faster than in 2020-24, but slower than in the 2010-19 decade (3.2%, based on market FX weights). We project that EM growth will continue to outstrip DM (3.8% vs. 1.8%), with more than half of this difference due to (relatively predictable) demographic factors rather than (less predictable) productivity growth differentials. We expect Asia (ex-DM) to remain the fastest-growing region but, reflecting a marked slowdown in Chinese potential growth, it is also projected to see the largest deceleration relative to 2010-19.

Exhibit 1: A Gradual Slowdown in Global Economic Growth, With EM Growth Continuing to Outstrip DM

1. A Gradual Slowdown in Global Economic Growth, With EM Growth Continuing to Outstrip DM. Data available on request.
Source: Goldman Sachs Global Investment Research
Exhibit 2 and Exhibit 3 combine our GDP estimates with our long-term real exchange rate projections, to project the real US Dollar value of major economies over time.
In 2050, we project that the world's five largest economies will be China, the US, India, Indonesia, and Germany (with Indonesia displacing Brazil and Russia among the list of largest EMs over this horizon). We estimate that China will overtake the US as the world’s largest economy around 2035.[2]
If we extend the projection horizon to 2075, the world's three largest economies are China, India, and the US, with India (just) overtaking the US. Interestingly, US potential GDP growth is expected to be materially faster than China's at that horizon because of its better demographic outlook. Given the right policies and institutions, we project that current EMs will make up seven of the world's top ten economies in 2075.[3]

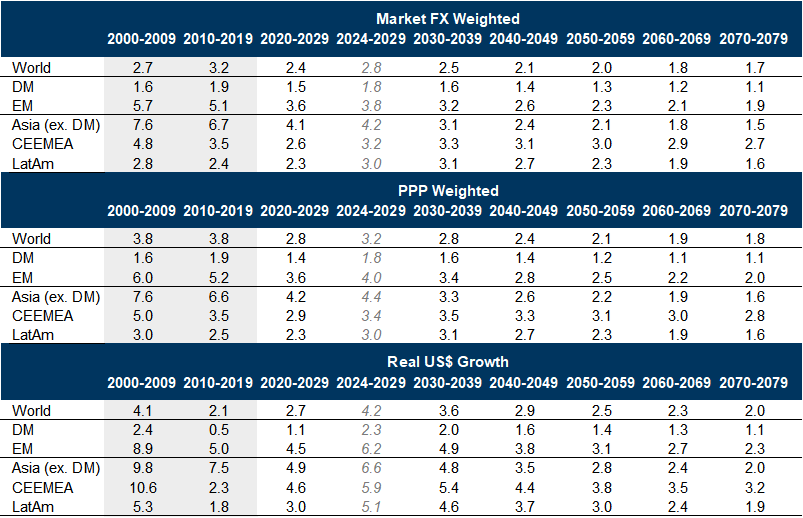
Exhibit 2: Our Projections Imply that China, the US, India, Indonesia, and Germany Will be the World's Five Largest Economies in 2050

World's largest economies (measured in US$)
2. Our Projections Imply that China, the US, India, Indonesia, and Germany Will be the World's Five Largest Economies in 2050. Data available on request.
Source: Goldman Sachs Global Investment Research

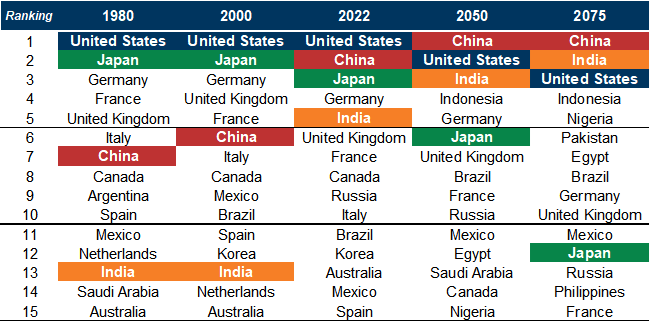
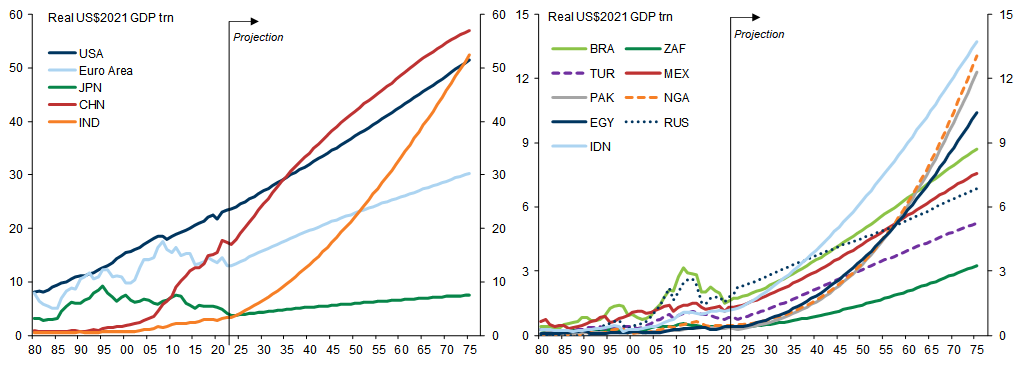
Exhibit 3: China to Overtake US Around 2035, While India Should Catch up By 2075; EM Leaderboard to Change Significantly by 2075

GDP level projections in Real (2021) US$ trillion
3. China to Overtake US Around 2035, While India Should Catch up By 2075; EM Leaderboard to Change Significantly by 2075. Data available on request.
Source: Goldman Sachs Global Investment Research
Exhibit 4 sets out our 2075 GDP level projections, broken down by population and GDP per capita levels. There are two notable points:
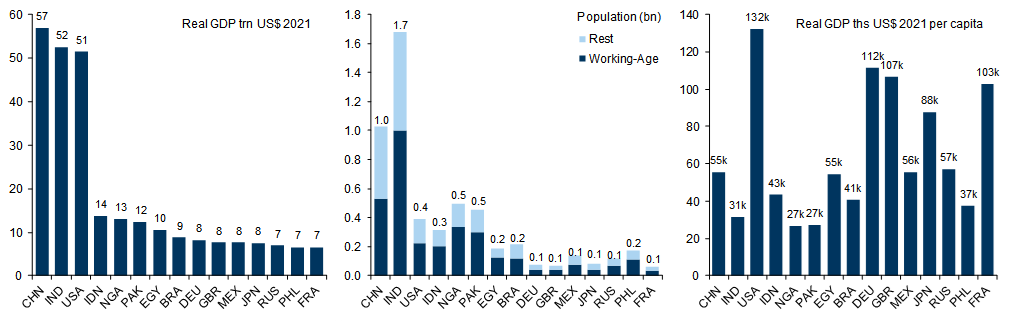
  • First, there is a large gap between the largest three economies (China, India, and the US) and all other economies (although the Euro area represents a fourth economic superpower if it is treated as a single economy). Thus, although Indonesia, Nigeria and Pakistan are projected to be placed fourth, fifth, and sixth in the 2075 GDP rankings, each is projected to be less than one-third of the size of China, India, and the US.

  • Second, while China and India are projected to be larger than the US by 2075, our projections imply that the US will remain more than twice as rich as both (and five times as rich as countries such as Nigeria and Pakistan). This reflects the relatively conservative assumptions on income convergence that we have factored into our projections and underlies the importance of demographic differences in driving the projected ordering of country size in 50 years' time.

Exhibit 4: China and India are Projected to be Larger than the US by 2075, But the US Will Remain More than Twice as Rich as Both

Real GDP levels, population and GDP per capita at 2075
4. China and India are Projected to be Larger than the US by 2075, But the US Will Remain More than Twice as Rich as Both. Data available on request.
Source: Goldman Sachs Global Investment Research
Making economic projections over a 50-year horizon for 104 countries inevitably involves a considerable degree of risk and uncertainty. Indeed, given the difficulties in forecasting even one or two years ahead, some readers may be sceptical of the value of forecasts that extend so far into the future. However, one advantage of making long-term projections is that cyclical risk – an important source of short-term forecasting error – tends to mean-revert over time, leaving GDP mostly determined by slower-moving trends in population, capital, and technology.[4]
One recent example of how extending the forecast horizon in this way makes the forecaster’s task easier rather than more difficult comes from China’s recent experience with Covid regulations. The timing of China’s decision to abandon its Zero Covid policy was a key source of risk for GDP growth in 2023 but matters much less for where Chinese GDP is likely to be in 10 or 20 years’ time.

Projecting Capital Market Size

To extend our analysis to project the future growth of global capital markets, we focus on equity market capitalisation as a proxy for the importance of capital-market-related activity more generally.[5] Our work builds on previous long-term projections of equity market capitalisation for the BRICs (published in 2004) and for EM economies (2013).[6]
To convert our long-term GDP projections into estimates of future equity market capitalisation, we exploit the link that exists between equity market capitalisation-to-GDP ratios and GDP per capita levels. Exhibit 5 displays how this relationship has evolved on a decade-by-decade basis for 68 markets since the 1980s.[7] The relationship has strengthened over time, supporting our forecasting assumption.

Exhibit 5: Richer Countries Tend to Have Higher Equity Market Capitalisation Ratios

Scatterplots of real GDP per capita vs. market capitalisation as % of GDP - decade averages
5. Richer Countries Tend to Have Higher Equity Market Capitalisation Ratios. Data available on request.
Size of scatter points reflects market size
Source: Goldman Sachs Global Investment Research
The link between equity market capitalisation (EMC) ratios and GDP per capita levels exists for two reasons: first, richer countries tend to have more equitised capital markets (i.e., a greater share of their domestic corporate assets are quoted on local stock exchanges) (Exhibit 6, LHS); second, the equity markets of richer countries tend to trade on higher earnings multiples than lower income economies, all else equal (Exhibit 6, RHS).[8] Quantitatively, the former factor is more important than the latter: increasing GDP per capita from 50% to 100% of US levels implies a 29pp increase in equity market capitalisation (normalising for differences in valuations) and a 3.9pt increase in average valuations, all else equal.

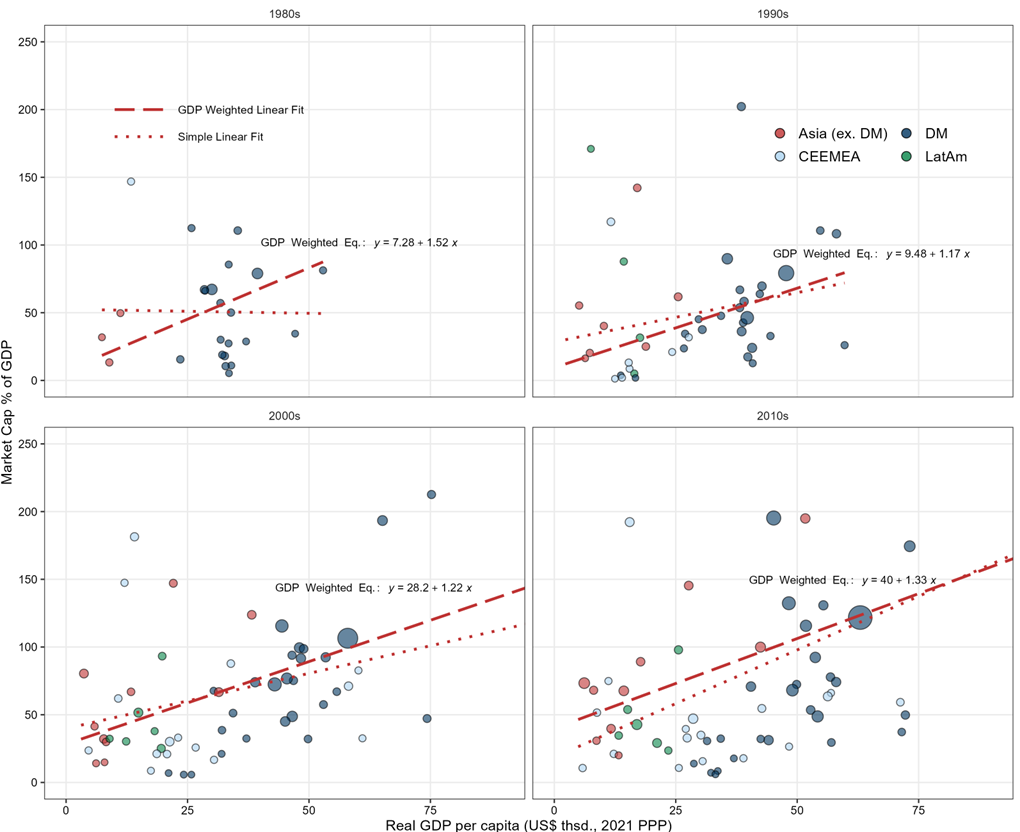
Exhibit 6: Richer Economies Typically Have More Equitised Capital Markets and Higher Equity Valuations

Real GDP per capita vs. average market cap % of GDP since 2000 (LHS) and vs. average P/E ratio since 2000 (RHS)
6. Richer Economies Typically Have More Equitised Capital Markets and Higher Equity Valuations. Data available on request.
Size of scatter points reflects market size
Source: Goldman Sachs Global Investment Research
We model equity market capitalisation ratios as a linear function of GDP per capita.[9] This may seem overly simplistic – after all, it would be impossible for EMC ratios to continue to rise linearly relative to GDP per capita levels forever (given that total company earnings are constrained by GDP). However, the experience of most high-income economies – including the US, the UK, Japan, among others – suggests that the relationship remains linear even at relatively high levels of income (Exhibit 7). We do not find this surprising, as there are several factors driving capital market expansion – such as the mobilisation of pension savings – that typically accelerate at relatively high income levels. It is also important to note that, to the extent that we are wrong and EMC ratios do level off in rich economies, this would imply that we are over-forecasting the growth of capital markets in DM vs. EM economies (and, by implication, under-forecasting the likely share of global equity capitalisation accounted for by EMs).

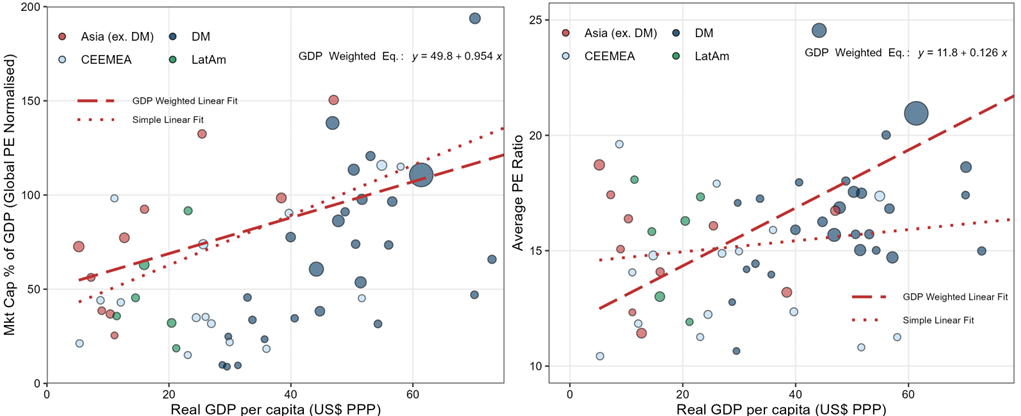
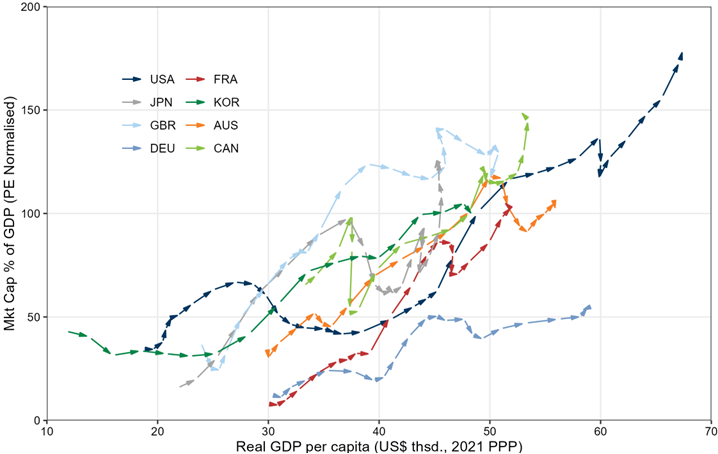
Exhibit 7: Relationship Between GDP per Capita and Market Cap Remains Relatively Linear Even at Higher Levels of Income

Historical path of market capitalisation as % of GDP vs. real GDP per capita (5Y moving average)
7. Relationship Between GDP per Capita and Market Cap Remains Relatively Linear Even at Higher Levels of Income. Data available on request.
Source: Goldman Sachs Global Investment Research
Finally, despite the strong relationship between equity market capitalisation and GDP per capita levels, there is also a significant degree of heterogeneity in the relationship at both low- and high-income levels. We find this heterogeneity to be persistent – i.e., while EMC ratios tend to rise with GDP per capita, we find no evidence that they converge over time. Reflecting this, our projections assume that EMC ratios rise linearly with GDP per capita but without convergence to a single fitted relationship.

Capital Market Size and Opportunity: Growing Importance of EM, With High Potential in India

In projecting global market capitalisation, we combine our country level GDP and GDP per capita projections with our estimates of the relationship between GDP per capita and EMC ratios. This gives us an estimate of real US$ market capitalisation going forward.
Given the positive relation between equity market capitalisation ratios and GDP per capita levels, we expect equity assets to grow more rapidly than GDP as EM income levels rise. Part of this increase is likely to come from multiple expansion as risk premia fall, but we expect the main dynamic to be the equitisation of corporate assets, the deepening of capital markets, and the disintermediation that takes place as financial development proceeds. New issuance and privatisations are likely to be an important part of that process.
We lay out our global market capitalisation projections in Exhibit 8. One implication of faster-growing market capitalisation relative to GDP is that the importance of EM equity is likely to increase significantly (albeit from relatively low levels). In 2022, EMs represented around 27% of total global market cap but around 45% of global GDP (measured in US$). Over the course of the projections, we project that EMs' share of global market cap will rise to 35% by 2030 (50% for GDP), to 47% by 2050 (60% for GDP), and to 55% by 2075 (68% for GDP).

Exhibit 8: Share of EM in Global Market Cap to Grow Over Time

Projected market capitalisation for DM and EM
8. Share of EM in Global Market Cap to Grow Over Time. Data available on request.
Source: Goldman Sachs Global Investment Research
Looking at this at a more granular level, we expect the relative share of the US in global equity market cap to decline from 42% in 2022 to 35% in 2030, 27% in 2050, and 22% in 2075 (Exhibit 9). By contrast, we expect China’s share in global market cap to rise from 10% to 15% by 2050, but decline to around 13.5% by 2075. We see the biggest scope for global market cap share increase in India, where our projections imply that India’s global equity market cap share will rise from around 2.5-3% in 2022 to 8% in 2050, and 12% in 2075. Likewise, we project the rest of EMs' share to rise, from 13.5% in 2022 to 17% in 2030, to 24% in 2050, and to 30% in 2075. Our projections imply that this will come at the expense of declining shares for DM economies.

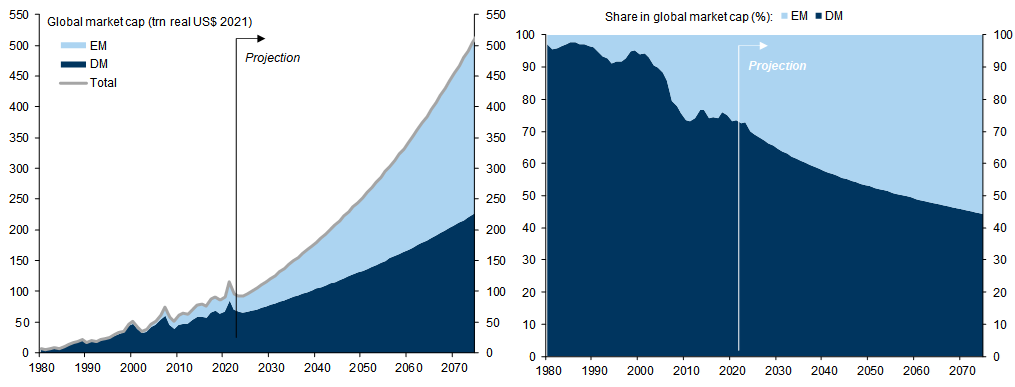
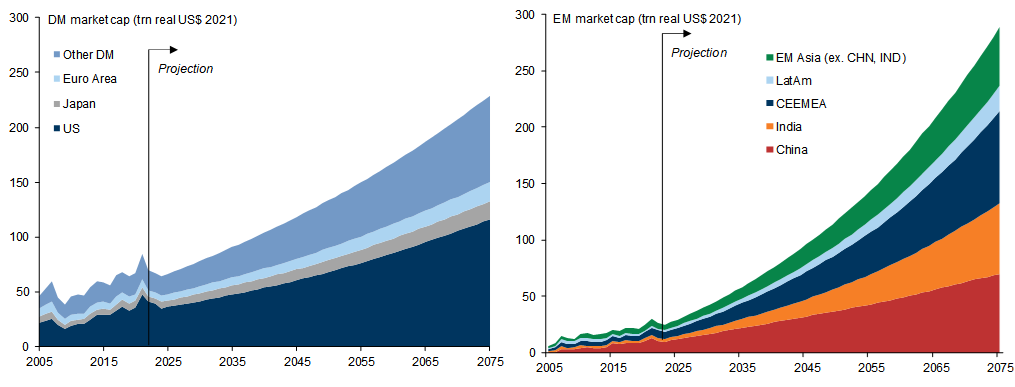
Exhibit 9: Growing Importance of India, China and Other EMs in Global Market Cap

Projected market capitalisation
9. Growing Importance of India, China and Other EMs in Global Market Cap. Data available on request.
Source: Goldman Sachs Global Investment Research
Lastly, we also consider the relative shifts within the DM and EM baskets (Exhibit 10). In DM, the most notable relative shift is for the US to decline from 60%, but stay at a relatively high share of around 50%. By contrast, we expect both Japan and the Euro area to decline at the expense of other DM economies (e.g., Canada and Australia, among others, reflecting faster potential growth in the latter). Within EMs, we see the biggest change taking place between the two largest EM economies – China and India. While we expect EM Asia (ex. China and India) to fluctuate around 20%, CEEMEA around 25-30% and LatAm around 5-7% throughout the forecast horizon, we expect China’s relative EM share to decline from 40% in 2022 to 30% in 2050, whereas we project India's to rise from 12% in 2022 to 17% in 2050. This relative shift from China to India reflects two factors: India's stronger demographic outlook and a more rapid pace of GDP per capita growth (from lower levels).

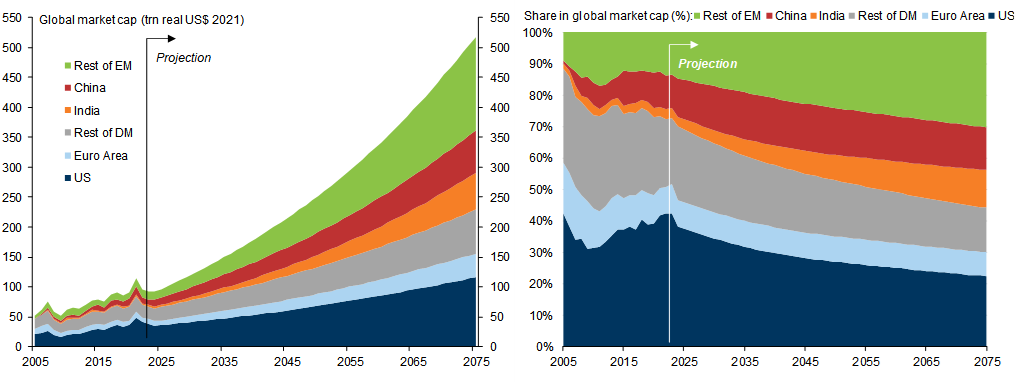
Exhibit 10: Rising Share of Other DMs, India and CEEMEA

Projected market capitalisation
10. Rising Share of Other DMs, India and CEEMEA. Data available on request.
Source: Goldman Sachs Global Investment Research

Equity Market Growth ≠ Equity Market Outperformance

Do our projections that EMs’ share of global equity market cap will rise at the expense of DMs imply that long-term investors should overweight EM vs DM equities? Not necessarily.
To the extent that the growth of EM capital markets comes from the equitisation of corporate assets – and we expect this to be the major driver – this does not have a clear implication for the performance of equities themselves.
That said, we expect EM equities to outperform DM equities in the longer run for other reasons: namely, the combination of stronger long-run earnings growth and multiple expansion, as risk premia fall.[10]

Key Long-Term Risk to Capital Markets Growth — The Rise of Populist Nationalism

Of the many risks to our economic projections, we identified rising protectionism and climate change as the most important long-term risks. Of these, we view the first as the more important risk to the growth of capital markets – specifically, the risk that populist nationalism leads to increased protectionism and a reversal of globalisation.
The successful development of open capital markets is particularly exposed to this risk because it relies on the ability and willingness of investors to commit capital to foreign jurisdictions. To date, the rise of populist nationalism has led to a slowdown rather than a reversal of globalisation, in our assessment. However, there are already examples of populist nationalism bringing about a clear reduction in openness to trade and capital flows — such as the impact of Brexit on the UK — and the risk of a broader reversal of globalisation is clear.
The development of deep equity markets also requires a commitment from domestic policymakers to follow a mix of capital-market-friendly policies that encourage innovation, transparency, listing, protection of private property rights, etc. It is impossible to incorporate each of these elements into an analytical framework satisfactorily, which is why we have focused on the broader relationship that exists between GDP per capita and equity market capitalisation ratios. In modelling equity capital market growth in this way, we implicitly assume that the conditions required for economic growth are also the conditions required for capital market development. But this won't always be the case, which presents risks (especially to our EMC projections for any individual country).
Finally, the development and dissemination of Generative Artificial Intelligence is another important risk to our projections. Because it is likely to raise global productivity and GDP per capita levels, we view it as an upside risk to the development of global capital markets. However, as the effects appear likely to be larger in DM than EM economies, this implies that it poses a downside risk to the projected increase in EMs’ share of global equity market capitalisation.[11]
Kevin Daly and Tadas Gedminas

Appendix

Data Sourcing

For sourcing equity market capitalisation data, we start with World Bank (WB) data on cross-country EMC ratios as a percentage of GDP. The advantage of this data is that it has relatively broad coverage and a relatively long history. Nevertheless, the data suffers somewhat from a lack of timeliness (the latest available data point is currently for 2020) and it takes end-of-period rather than year-average values (potentially making it susceptible to year-end).
To supplement this market capitalisation data, we use the WB's primary source directly – the World Federation of Exchanges (WFE). Here, we first cross-check that the data coming from individual exchanges reported by the WFE corresponds to WB data, to gauge whether any country-specific adjustments are required. And, where the differences are reconcilable, we use WFE as our primary source, and we take the annual average level of market cap as % of GDP, rather than taking the end-of-period values for the annual data. WFE data, however, tends to have a shorter history and a narrower coverage in some cases, so we use WB data to supplement any gaps.
Finally, we also source data from Datastream for country-level equity market capitalisation data. This also allows us to retrieve price-to-earnings (P/E) ratios for key markets, which helps in normalising the data. Nevertheless, Datastream coverage tends to be narrower than WB and WFE in terms of country sample, as well as not having a complete overview of the whole market (e.g., excluding smaller companies as well as companies that are not fully eligible for foreign market participants). We therefore use Datastream data to supplement our existing sources, where there is missing data, and reconcile some differences where needed. We find that market cap measures based on Datastream data as well as WFE/WB tend to be highly correlated, with the WFE/WB typically having a higher level of GDP equity market cap, but otherwise mirroring the underlying dynamics and fluctuations.
One implication of our data sourcing is that our measures of global market cap give a larger share to EMs than common global benchmark indices (e.g., the MSCI All Country index). The reason for this is that benchmark indices exclude some countries and some stocks due to smaller size, restricted foreign investor participation, a lack of liquidity, and other factors. While these factors may be relevant from the perspective of many international investors (in particular, index investors), focusing on a narrower coverage makes less sense in gauging the importance of broader capital market development.

Adjusting EMC Ratios for Short-Term Fluctuations in Valuation

In our historical analysis and in setting the starting point for our projections, we normalise EMC measures to smooth out cyclical variation (by taking decade-long averages) and adjust for cross-country differences in EMC ratios due to valuations. For the P/E adjustment, we consider two options: i) normalising all markets to the long-term global P/E ratio average (17.2); and ii) normalising markets to their own long-term (10-year) rolling P/E ratio average. The former approach is more 'absolutist', as it discounts any cross-country variation in P/E ratios, even if those variations are due to structural factors (such as differences in the composition of stock markets or differences in the risk premia applied to low- and high-income economies). Although we have compared both approaches, we think the latter approach is more appropriate and have used this for our projections, as it allows for long-term/structural cross-country differences in P/E ratios, while normalising for any short-term/temporary differences. However, it is important to note that the positive relation that we find between EMC ratios and GDP per capita levels is strong and significant under both approaches.
To prevent there being a discontinuity between the historical data and our projections, we also apply this approach in normalising the starting point of our projections (2023) – i.e., taking both the 10-year averages of market cap and P/E ratios in setting the market cap. In practice, this implies that the starting point of our equity capital market projections is lower than current levels for most markets, as P/E ratios are currently above their 10-year averages in most markets (although much less so than at their peak in 2021).
  1. 1 ^ The Path to 2075 — Slower Global Growth, But Convergence Remains Intact”, Global Economics Paper, 6 December 2022.
  2. 2 ^ Given the recent pessimism around China's long-term growth prospects, some readers may be surprised that we expect China to overtake the US at this horizon. However, three points are worth bearing in mind in this regard: First, China has already closed most of the gap with US GDP (China's GDP has risen from 12% of the US in 2000 to around 80% currently). Second, despite significant downward revisions, potential growth in China remains significantly higher than the US on our revised estimates (4.0% vs. 1.9% for 2024-29). Third, in addition to differences in potential growth, we expect some of the US Dollar’s real overvaluation vs. the Chinese Yuan to be unwound over the next 10-15 years.
  3. 3 ^ For our projections, we assume that EM economies are a fixed group – i.e., they do not become re-classified as DM economies as they become more developed.
  4. 4 ^ The most important source of forecast uncertainty over longer horizons is productivity growth because errors in forecasting productivity trends tend to accumulate over time, whereas cyclical fluctuations tend to be mean-reverting.
  5. 5 ^ We focus on equity market capitalisation as, in contrast to debt capital markets and banking sector development, it is relatively straightforward to measure on a like-for-like basis across many countries. In practice, stock market development is also closely correlated with debt capital markets and banking sector development (see “Stock Markets, Corporate Finance and Economic Growth: An Overview”, Demirguc-Kunt and Levine, World Bank Economic Review, 1996). One consequence of focusing on each country’s equity market capitalisation is that we exclude the value of foreign direct investment (FDI). However, we view this as a positive feature because, while FDI plays a key role in economic development, it does not directly contribute to the development of domestic capital markets.
  6. 6 ^ See “The BRICS and Global Markets: Crude, Cars and Capital”, Global Economics Paper, 14 October 2004 and “EM Equity in Two Decades – Refreshed”, GOAL – Global Strategy Paper, 15 March 2013.
  7. 7 ^ By comparing decadal averages for P/E ratios and GDP per capita ratios, we effectively control for the effects of cyclical and other temporary fluctuations in P/E ratios that might otherwise distort this relationship.
  8. 8 ^ Exchange rate developments are a separate factor driving the US$ value of equity markets over time. However, our economic projections are already converted to real US$ values, using exchange rates that assume convergence towards PPP equilibrium rates as economies grow richer.
  9. 9 ^ In our 2004 projections for the BRICs economies, it was assumed either that equity market capitalisation-to-GDP ratios remain fixed at current levels or that they would converge over time to the same level. In our 2013 projections for EM economies, equity market capitalisation ratios were modelled as a non-linear function of GDP per capita levels.
  10. 10 ^ EM Long-Term Growth and Equity Earnings – Stronger Growth, (Somewhat) Better Earnings”, EM Macro Themes, 25 May 2019.
  11. 11 ^ The Potentially Large Effects of Artificial Intelligence on Economic Growth”, Global Economics Analyst, 26 March 2023.

Investors should consider this report as only a single factor in making their investment decision. For Reg AC certification and other important disclosures, see the Disclosure Appendix, or go to www.gs.com/research/hedge.html.