Goldman Sachs Research
Global Strategy Paper
Women (Still) Hold Up Half the Sky
  • We wrote the first paper on Women Hold Up Half the Sky in 2008, stating at the time that the old Chinese proverb was more aspiration than fact. In developed and developing countries alike, gender gaps persist in education, health, work, wages and political participation.

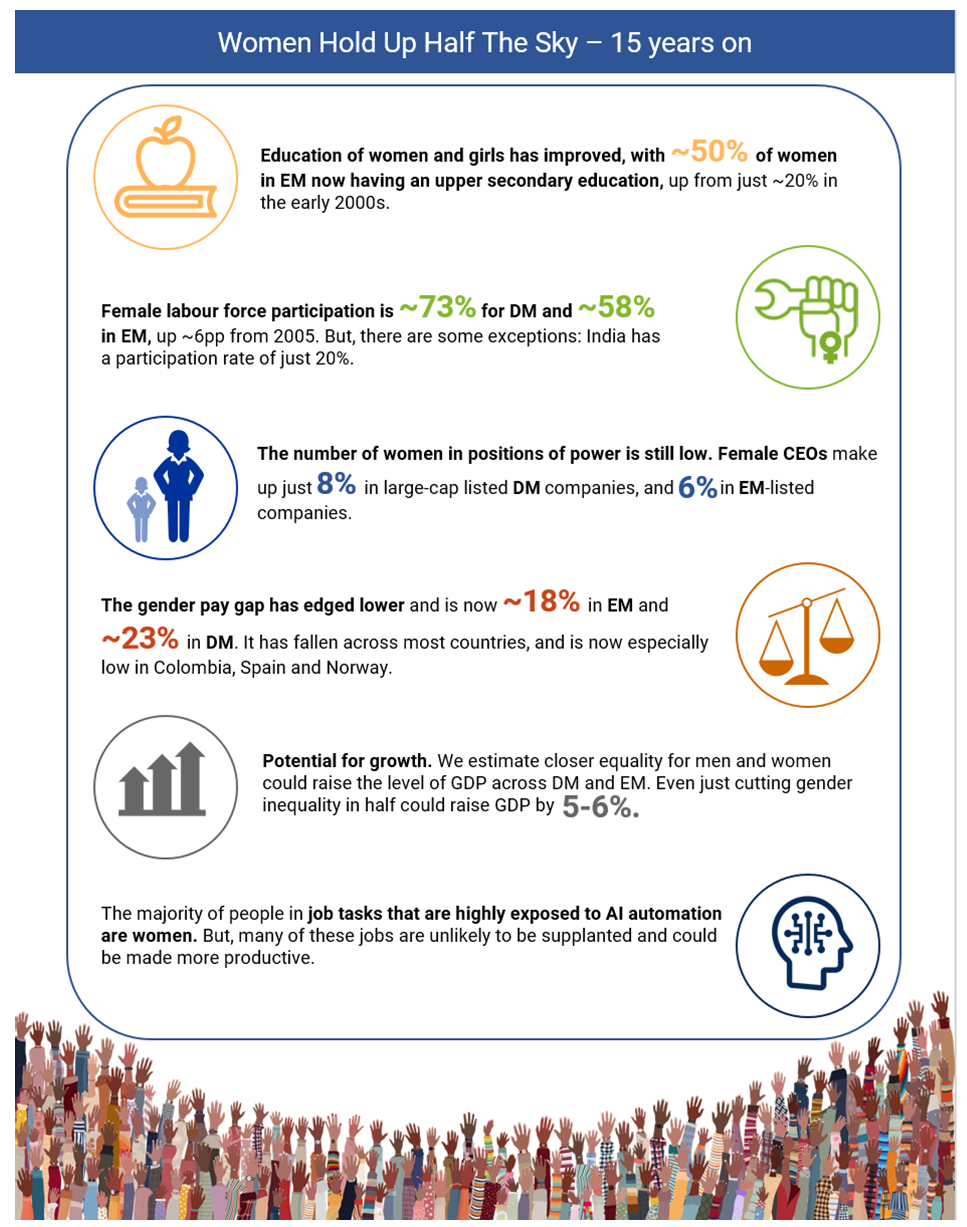
  • Looking at these issues afresh, we find that shrinking working age populations mean that it is now more important than ever to utilise the full resources women have to offer (and to reward them fully). We estimate that even just halving the pay and employment gap between men and women could raise the level of GDP across DM and EM by between 5% and 6%.

  • We have seen plenty of progress over the past 15 years – especially with respect to education and labour force participation – but we also see persistent gaps. Despite recording stellar GDP growth, India, which already had low female labour force participation, has seen it fall further. Japan and Korea have seen their pay gaps fall, but these gaps remain notably higher than elsewhere.

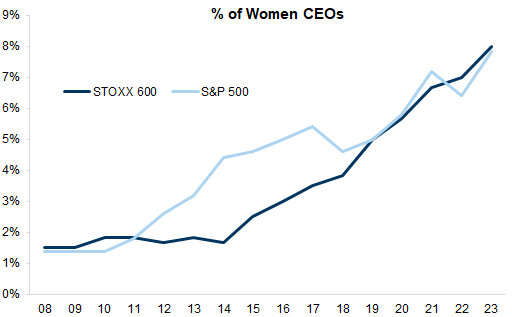
  • Women are moving into positions of leadership in politics and business. But, as with much of the recent progress, it is slow, and representation at the very top remains elusive. Men account for 92% of CEOs in large-cap listed DM companies and 94% in EM-listed companies.

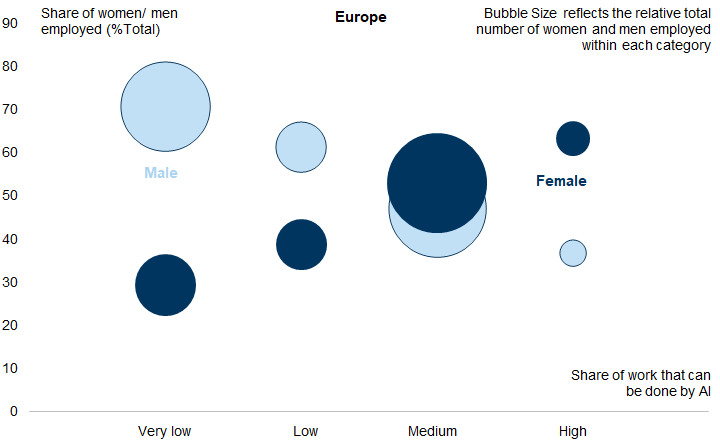
  • New challenges have emerged as well. The jobs that our economists assume will be most impacted by AI also tend to be held by women rather than men: ~60-70% of the workforce in these areas are women. That said, roles that require a high degree of face-to-face interaction, or caring professions – both areas where women dominate – are likely to be made more productive via AI and are unlikely to be supplanted by it.

Data available on request.

Gender equality becoming more pivotal

There are two large shifts globally that make gender equity and the contribution of women to growth especially relevant to investors today:

1. Ageing Demographics

The working age population is shrinking in most countries and, even for the few countries where it is not shrinking yet, growth rates are declining (Exhibit 1 and Exhibit 2).
Japan's ageing demographic used to be unique across the world, as our former colleague Kathy Matsui wrote in the 1990s in Japan Womenomics. But in recent years Japan has been joined by Italy, Germany and most of the rest of Europe. And this is not only a concern for developed markets: the decline in working age population growth is sharpest in parts of the emerging world (Exhibit 3).

Exhibit 1: Working age population growth is declining in developed markets...

15-64 cohort population growth; United Nations forecast, working age annual population growth
1. Working age population growth is declining in developed markets.... Data available on request.
UN uses probabilistic models for birth rates, mortality and migration based on past experience of each country and potential future changes based on the past experience of other countries under similar conditions
Source: Haver Analytics, United Nations, Goldman Sachs Global Investment Research

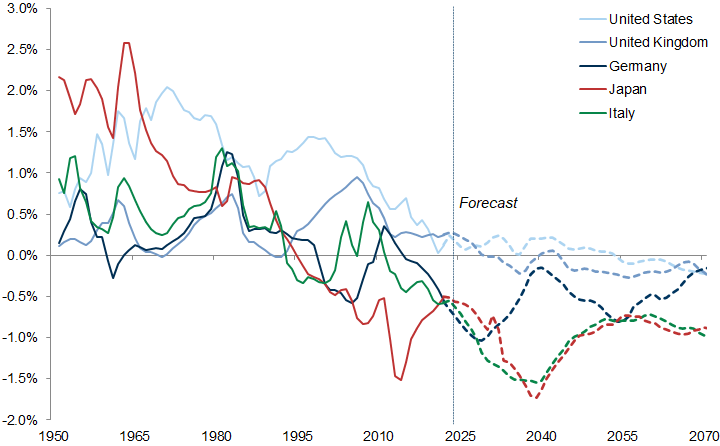
Exhibit 2: ...and in many emerging markets

15-64 cohort population growth; United Nations forecast
2. ...and in many emerging markets. Data available on request.
UN uses probabilistic models for birth rates, mortality and migration based on past experience of each country and potential future changes based on the past experience of other countries under similar conditions
Source: Haver Analytics, United Nations, Goldman Sachs Global Investment Research

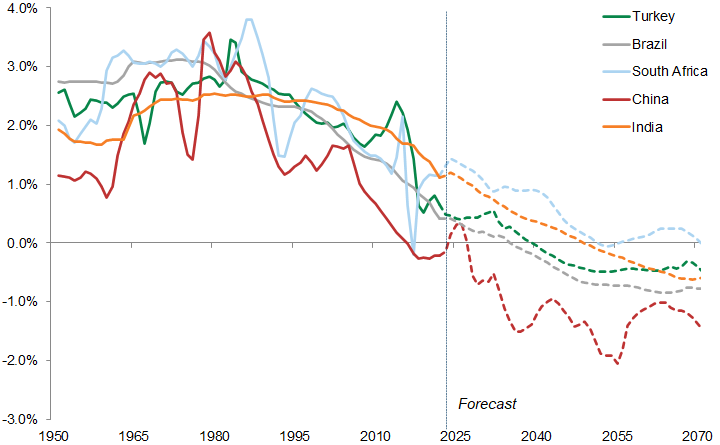
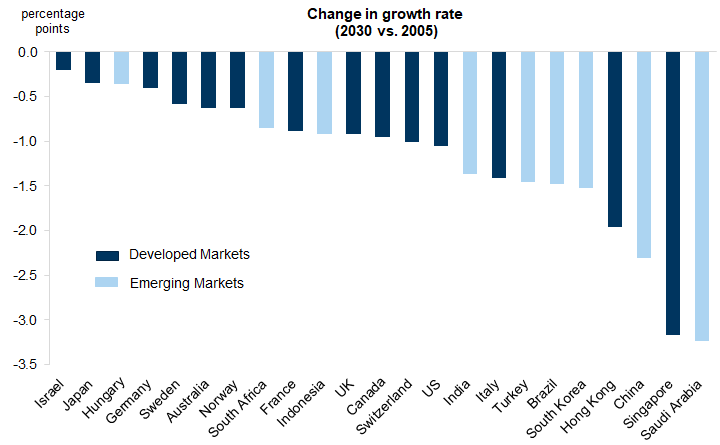
Exhibit 3: The decline in working age population growth rates is sharpest in the emerging world

Change in working age population growth rate between 2005 and 2030E, United Nations forecast
3. The decline in working age population growth rates is sharpest in the emerging world. Data available on request.
Source: Haver Analytics, United Nations, Goldman Sachs Global Investment Research
Fifteen years ago, our research focused on the positives of the ‘demographic transition’. This is a powerful effect caused by falling fertility; fewer children but plenty of working age population growth have been a boon for many EMs. However, this window was closing back then, and is now largely closed. At the time, we noted that China’s window would close in about 15 years' time; we are now seeing this as China’s population starts to decline.
And in DM, declining working age population will be compounded by other issues:
  • Geopolitical risks – and, as a result, public policy – are increasingly pushing companies towards home-production just at a time when WAPs are declining and wage demands increasing. The US IRA and the recent European Green Deal both have an element of local sourcing of supply chains.

  • In addition, many developed markets have a pension funding problem exacerbated by the decline in the workforce and the increased dependency ratio.

Greater female participation in the labour force could help by improving the sustainability of public-funded pensions, and alleviate the gaps created by a declining cohort of working age people.

2. ESG funds are growing

Minuscule 15 years back, ESG funds now represent the marginal dollar invested in many markets. For example, one-third of EM equity fund flows have been ESG-focused, based on cumulative data over the last six years (Exhibit 4). And ESG funds focus on the key standards of women’s representation in the workforce and in leadership.
Also, as noted in our EM Womenomics research, countries that do well on gender equality tend to do well on other ESG metrics (Exhibit 5).

Exhibit 4: The share of ESG-focused equity fund flows in EM has risen to roughly one-third in recent years

Cumulative weekly EPFR flows (Early Proximal Flow Rate) since 2008, USD bn
4. The share of ESG-focused equity fund flows in EM has risen to roughly one-third in recent years. Data available on request.
Source: EPFR, Goldman Sachs Global Investment Research

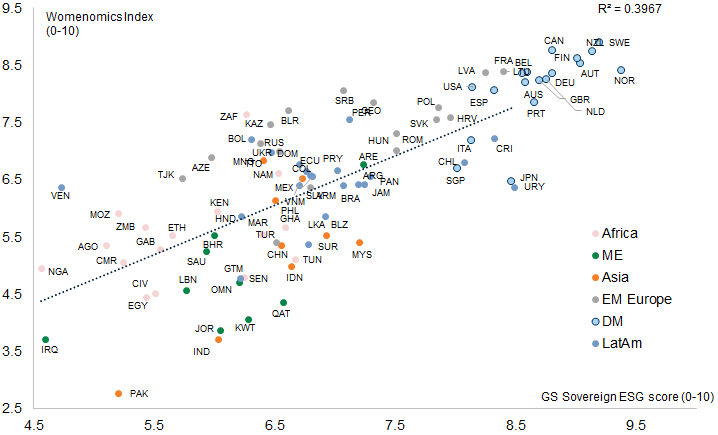
Exhibit 5: Countries that do well on gender equality tend to do well on other ESG metrics

Correlation between our GS Womenomics Index and our latest Sovereign ESG scores, both of which are standardised between 0 and 10, where 10 is the highest
5. Countries that do well on gender equality tend to do well on other ESG metrics. Data available on request.
Source: : World Bank, SDG Database, Fund for Peace, Freedom House, University of Notre Dame, The Social Progress Imperative, Doing Business, Our World in Data, European Commission, Haver Analytics, UN Sustainable Development Goals, Goldman Sachs Global Investment Research

Women's equality and its progress

We look at the progress that has been made since our first research on gender equality 15 years back. As a measure of progress on equality, we focus on female labour force participation and pay. Both capture elements of equality, but are by no means all-encompassing. For example, we acknowledge that, in some instances, women and men may choose not to work, or to work fewer hours (working part-time for example, or staying longer in education) and, from that perspective, higher participation in itself is not exactly the goal of equality. Instead, the goal is that opportunities are equal and that work is equally valued and rewarded. At the moment, we find this is far from the case.

Female labour force participation is on the rise

Looking at female labour force participation over the last 15 years, we have seen a slow but steady increase of ~6pp in women's labour force participation across both developed and emerging market economies, both outright and relative to men's labour force participation (Exhibit 6). Nevertheless, the overall female labour force participation remains low, at ~73% for developed market economies (~85% of that of men), and just ~58% for emerging market economies (~71% of that of men).

Exhibit 6: The female labour force participation rate has inceased across DM and EM over the last 15 years

6. The female labour force participation rate has inceased across DM and EM over the last 15 years. Data available on request.
Female Labour Force participation is standardised by the ILO, and updated to 2019. For 2020-2021, we use the ILO's estimates for female-to-male labour force participation to infer the trend developments for the outright female labour force participation rate.
Source: ILO, Haver Analytics, Goldman Sachs Global Investment Research
Zooming further out to the 1990s, and focusing on women in employment as opposed to the labour force (i.e., excluding those looking for jobs), Exhibit 7 shows that, while most of the improvement for women in employment came in the late 1990s and early 2000s, the gap between male and female employment has declined steadily over the period (Exhibit 8): the gap is now ~22 percentage points in EM and ~10 percentage points in DM, a decline of almost 10 percentage points across both regions since the 1990s, despite the negative impact from Covid-19.

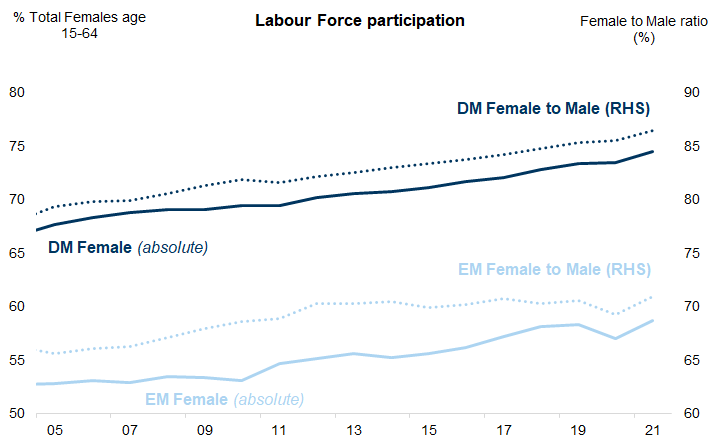
Exhibit 7: The female employment ratio has increased since the 1990s

7. The female employment ratio has increased since the 1990s. Data available on request.
Source: World Bank, Goldman Sachs Global Investment Research

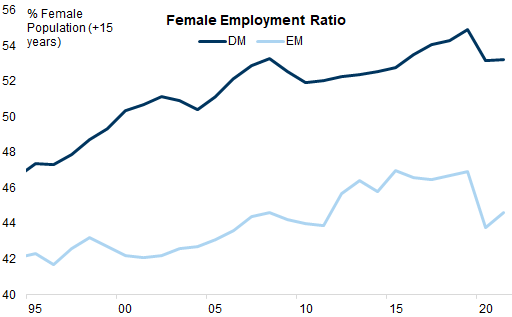
Exhibit 8: The employment gap between men and women has narrowed, but progress stalled during Covid-19

8. The employment gap between men and women has narrowed, but progress stalled during Covid-19. Data available on request.
Source: World Bank, Goldman Sachs Global Investment Research
It is worth noting that there is a large discrepancy across both DM and EM when it comes to women's participation in the labour force. Exhibit 9 shows the latest female-to-male labour force participation ratio across ~92 economies, and how this has changed since 2005. Countries that have seen the biggest improvements in female-to-male labour force participation include Singapore and Spain among developed markets, and Cote d'Ivoire among emerging markets. Women across many Middle Eastern economies, such as the UAE, Qatar and Saudi Arabia, have also seen significant improvements in female labour force participation, though the overall participation rate remains low. Conversely, some of the countries with the lowest female labour force participation rate, such as India and Egypt, have also seen the participation rate decline (see the Box on India for more detail).

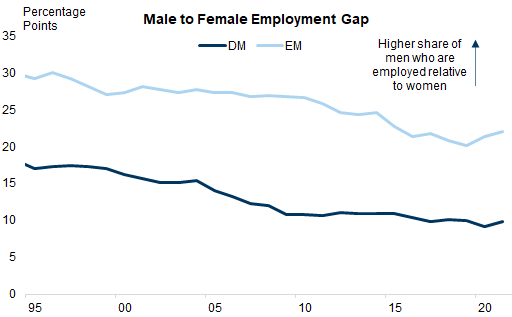
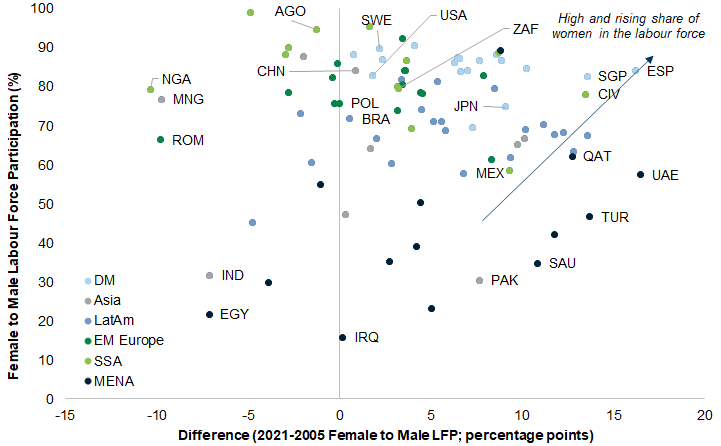
Exhibit 9: There is a significant dispersion in countries' female-to-male labour force participation, and the change since last 15 years

ILO Estimate
9. There is a significant dispersion in countries' female-to-male labour force participation, and the change since last 15 years. Data available on request.
Source: Haver Analytics, Goldman Sachs Global Investment Research

India: Female labour force participation has fallen despite rising GDP

The recorded Indian female labour force participation rate (LFPR) is exceptionally low. A mere 20% of all working-age women in India are in employment, and only a few countries have lower rates, such as Egypt, Iraq and Jordan (Exhibit 10).
Not only is the rate low, but it has declined sharply in recent years. To be fair, the overall LFPR has fallen, but the rate of decrease in the female LFPR has been significantly greater than that of the male LFPR, and from a significantly lower level than for men (Exhibit 11).

Exhibit 10: Only very few countries have lower female LFPRs than India

Female Labour Force Participation rates (%). Light blue represents EM's progress and Dark blue represents DM's progress
10. Only very few countries have lower female LFPRs than India. Data available on request.
Source: World Bank, Haver Analytics, Goldman Sachs Global Investment Research
What’s the reason for this? We think a number of factors provide at least some explanation, with the caveat that often poor data quality makes it difficult to be confident in the causes, or the weight to apply to them:
1. Women in India mostly work in piecework that is not picked up by the economic measures of formal employment. They work at home for their families or on self-owned family farms, and the LFPR does not take that into consideration. Analysis has revealed that there has been no significant occupational diversification in women’s employment despite a structural shift in the economy from the primary to the tertiary sector, i.e., 57% of women aged 15-59 in employment were working in agriculture in 2021-22. Overcrowding, volatile and low earnings, large-scale informal employment, and most self-employment being in the form of unpaid work are indications of women’s disadvantaged position in the labour market. A report by the government also acknowledged the need to broaden the horizon for measuring work for women. Of course, this accounts for the low recorded LFPR, not the declines in recent years.
2. Industrialisation, which has increased sharply since the turn of the century, has had two main impacts: an increase in incomes and greater mechanisation. First, the increase in household income might itself be to blame. We discuss below the U-shaped income curve theory with respect to the female LFPR. This theory posits that there is a negative relationship between income and female labour force participation based on the logic that, for the poorest families, women work out of necessity, and it is considered prestigious/high status if the women of the household do not need to work. This is a controversial theory, but it seems to fit in with the fact that, in rural India, where household incomes are considerably lower than urban areas, the female LFPR is slightly higher (Exhibit 12). A study also shows that during the pandemic, the probability of women’s employment increased in households that experienced sharp negative income shocks.
Second, due to greater mechanisation and modernisation, the number of Indians employed in agriculture fell from 81% in 1983 to 58% in 2018, and this may have disproportionately impacted women.

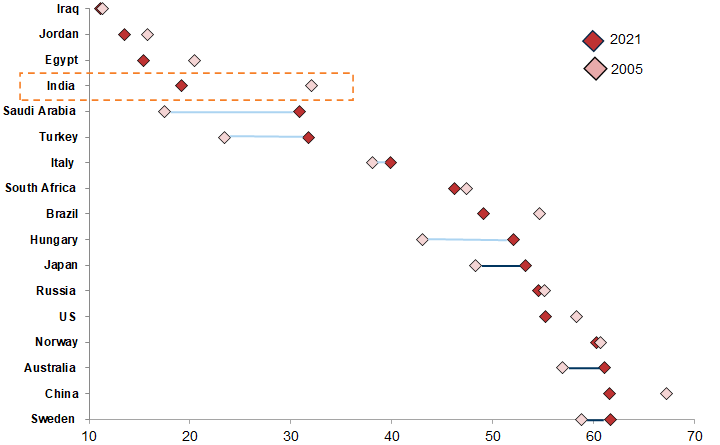
Exhibit 11: The decline in women's LFPR has been greater than that of the male LFPR, and from a lower level than for men

Indian Labour Force Participation rates (%), 15+ years
11. The decline in women's LFPR has been greater than that of the male LFPR, and from a lower level than for men. Data available on request.
Source: World Bank, Haver Analytics, Goldman Sachs Global Investment Research

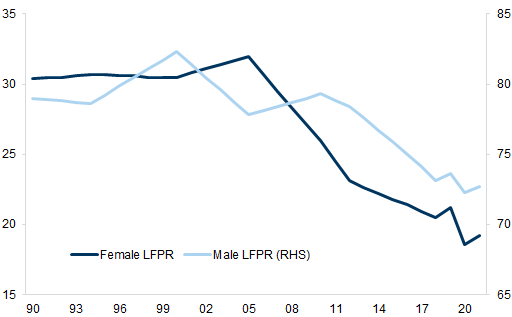
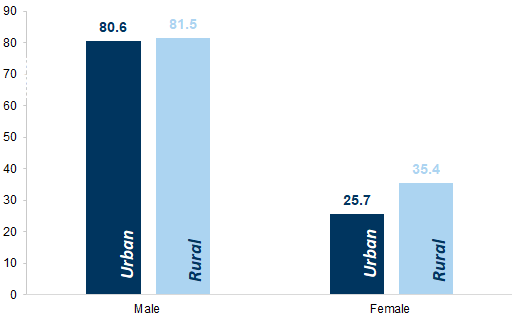
Exhibit 12: In rural India, women's LFPR is slightly higher than the urban counterpart

Labour Force Participation rates (%), 15+ years
12. In rural India, women's LFPR is slightly higher than the urban counterpart. Data available on request.
Source: World Bank, Haver Analytics, Goldman Sachs Global Investment Research
3. Inequalities: More broadly, lower LFPR can be attributed to horizontal inequalities such as in gender pay gap discrimination, low age of marriage, and prevailing social norms that limit the occupational choices for women. According to the National Crime Records Bureau, reported incidents of crime against women have risen sharply, by 87% between 2011 and 2022, and there is evidence that increased crime incidents deter women from working away from their residence, thereby restricting their mobility.
That said, the status of women in India is gradually improving and measures are being taken to support this, but progress is slow. The global gender gap index compiled by the World Economic Forum shows that women in India are reasonably empowered in politics and, while still low, India's rank in educational attainment for women has improved considerably. Certain key organizations have shifted policy to elevate the status of women; for example, the Indian cricket association announced equal pay for men and women players. India also has the highest percentage of female pilots globally at about 12%, compared with just 5-6% in the US and UK.
Why empowering women and increasing women's LFPR is important for India. India is not only the most populous country in the world, but also one of the few countries to have a positive WAP growth and a low dependency ratio (Exhibit 2). In our view, India needs to capitalize on this window of favourable demographics as the working age population ratio is forecast to start to decline from 2035 onward. Our Indian economists highlight that increasing the overall LFPR for men and women back to previous peak levels of 61% could increase potential annual GDP growth by 100bp (from c. 7% to c. 8%).

Gender pay gaps have edged lower across many countries

In addition to more women joining the labour force, the gender pay gap has edged lower across many economies (Exhibit 13). It is now especially low in Colombia, Spain and Norway, but remains high in parts of Asia, such as Korea and Japan. Nevertheless, parts of the world have seen a slight increase in their gender pay gaps, with the largest increase seen in Turkey, followed by Chile and Italy.
That said, data from the International Labour Organization (ILO) on mean monthly pay for men and women show that the gender pay gap remains high overall, across both DM and EM (Exhibit 14). This is only partly due to the composition of work. While men tend to work in higher-paying industries, we find that the gender pay gap remains high even when we control for differences in the composition of work for men and women.

Exhibit 13: The median gender pay gap has come down over the last 15 years

13. The median gender pay gap has come down over the last 15 years. Data available on request.
Source: OECD, Goldman Sachs Global Investment Research

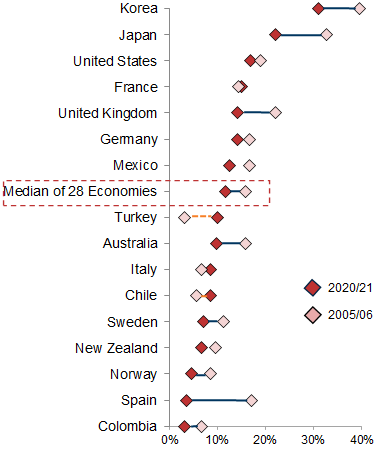
Exhibit 14: EM has a lower gender pay gap than DM

14. EM has a lower gender pay gap than DM. Data available on request.
Exhibit shows the median gender pay gap across regions based on ILO data. We estimate the gender pay gap using ILO for Mean Monthly Earnings. The data for the same industry is also based on Mean Monthly Earnings data, and is the equally weighted average across 5 industries. The latest available data point differs across countries, but generally ranges from 2019-2021.
Source: ILO, Goldman Sachs Global Investment Research
According to ILO data, the median DM woman has a pay gap of ~23%, which compares to ~18% for the median woman in EM. That is, women in DM have a higher pay gap, despite also having a higher labour force participation. The difference may be explained by women in DM also having a higher propensity to work part-time. Indeed, Exhibit 15 shows a positive, albeit relatively small, correlation between the average gender pay gap (when controlling for different industries) and women working part-time. Education and factors such as women in managerial positions may also play a role (more on that below). Nevertheless, when looking at the gender pay gap in Europe, we have found that roughly two-thirds of the gender pay gap cannot be explained by these factors alone (Exhibit 16).
It is also worth noting that the gender pay gap only tells part of the story for gender equality. For example, gender pay gaps are relatively low in the Middle East, but so is overall female labour force participation, as shown above. According to the UN, relatively few women in the Middle East work, as their ability to take on paid work outside the home is often restricted by rigid social norms and cultural expectations. Those who do work tend to be highly educated and in well-paid jobs, which accounts for the lower gender pay gap.

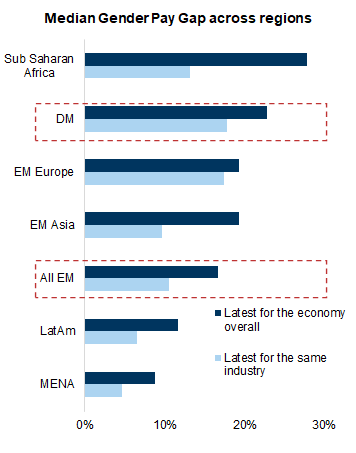
Exhibit 15: The higher propensity for part-time work in DM explains some, but not all, of the variation in gender pay gaps relative to EM

15. The higher propensity for part-time work in DM explains some, but not all, of the variation in gender pay gaps relative to EM. Data available on request.
Source: ILO, World Bank, Goldman Sachs Global Investment Research

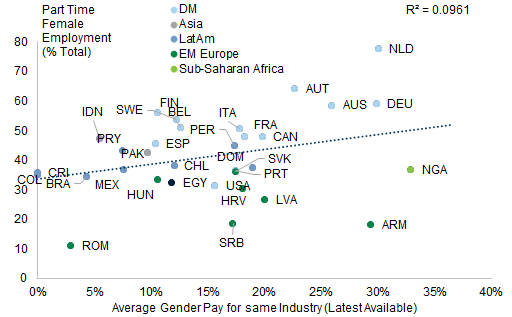
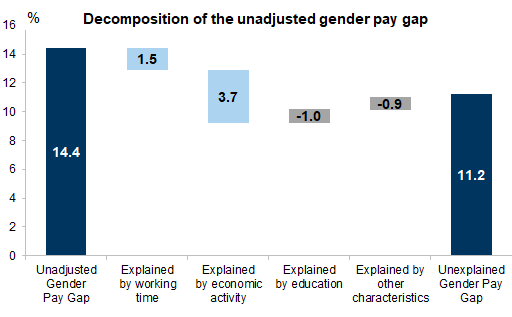
Exhibit 16: The adjusted gender pay gap remains largely unexplained (in Europe)

Difference between male and female hourly earnings as % of male hourly earnings, UK is included in the EU figures, 2021 Data
16. The adjusted gender pay gap remains largely unexplained (in Europe). Data available on request.
Source: Eurostat, Goldman Sachs Global Investment Research

The economic case for equality

If policies continue to increase female employment, as well as reduce women's pay gaps, it is likely that they will also add to countries' economic potential over time. To assess this impact, we draw from the work of our colleagues, who initially estimated the potential economic benefits to US growth from eradicating the large inequalities facing black Americans, and black women in particular.
Starting with the median EM economy, suppose the EM gender gap moves closer to DM, such that the ~22 employment-to-population gap narrows to 10 percentage points (Exhibit 8) without a subsequent increase in unemployment. All else equal, this would increase total labour income by 9%. Assume now that the ~18% earnings gap is halved at the same time (Exhibit 14), through higher wages for women. If coupled with higher employment for women, this would result in an increase to labour income of 3%. Assuming that labour makes up ~55% of GDP, these two factors would increase GDP for the median EM by ~6%. If, instead, the employment and pay gap is completely eradicated, GDP could increase by ~13%.
For the median DM economy, let’s assume we close half of the gender gaps: the 10 percentage point employment gap is lowered to 5 percentage points, and the ~23% gender pay gap is lowered to ~12%. For the median DM economy, this would increase GDP by ~5%, and a full eradication of inequality in the labour market would increase GDP by 10% in total.
Our estimates show that lowering gender inequality by half in the labour market could raise GDP by 5-6%. The GDP impact for EM comes mostly from more women entering employment, whereas the large GDP impact for DM comes from the reduction in the pay gap. As noted above, the lower pay gap for EM women relative to DM women likely reflects the high bar for EM women entering the labour force, so the key challenge for EM governments will be to simultaneously lower the gender pay gap while lowering the bar for women entering the labour force.
More broadly, the impact on GDP may be smaller or larger than shown above. For example, the estimate assumes that the increase in women's earnings reflects an increase in productivity (for example, through continued access to higher education), but if this instead reflected a reduction in sexual discrimination and gender bias in pay, the increase would justifiably lead to a smaller increase in GDP through smaller business profits. Conversely, the growth impact could be higher if higher female education and labour force participation also lead to better health for children and innovation, among other factors.

Drivers of the improvement in female labour force participation

Women's Education

When Sandra Lawson et al. studied gender gaps in Women Hold Up Half the Sky, they focused primarily on education, noting that educating girls and women is key to gender equality. Consistent with this, we are able to attribute a large part of the improvement in gender equality since the early 2000s to the education of girls and women.
Since the early 2000s, the share of both men and women with an upper secondary education in emerging markets has more than doubled, from ~20% to ~50% of the adult population today. For men, the impact from higher education has not impacted their labour force participation, which was already high to begin with, though it has likely improved their productivity and hence had a positive contribution for economic growth. Conversely, for women, higher education has led to a greater inclusion in the labour force.
As seen in Exhibit 18, when controlling for the level of education, (i.e., basic, intermediate or tertiary), the female-to-male labour force participation has been constant since 2005. In other words, a woman with a high school degree had roughly the same likelihood of joining the labour force in 2005 as she does today, but the fact that more women have a high school degree has led more women joining the labour force. This positive correlation between women's level of education and women entering the labour force is likely due to their higher earning potential following a higher education, which increases the opportunity cost of not joining the labour force, unlike for men, who have been expected to work regardless.

Exhibit 17: In emerging markets, women's higher education has increased

17. In emerging markets, women's higher education has increased. Data available on request.
Source: World Bank, Goldman Sachs Global Investment Research

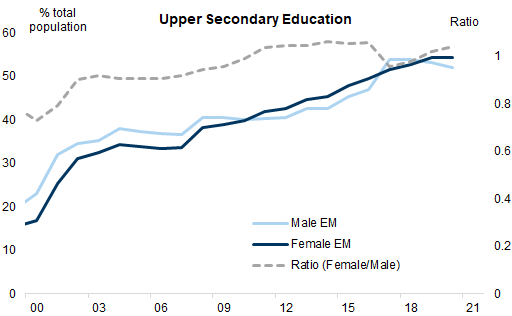
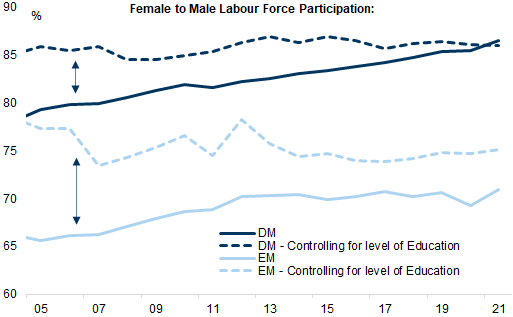
Exhibit 18: Education appears to account for most of the improvement in female labour force participation

18. Education appears to account for most of the improvement in female labour force participation. Data available on request.
Source: World Bank, Goldman Sachs Global Investment Research

Family-friendly policies

Another element of increased female labour force participation is family-friendly government policies, such as parental leave and public expenditure on family benefits.
Exhibit 19 shows a positive correlation between the female-to-male labour force participation rate of prime-age workers across 38 economies, and government benefits for families, with Nordic economies ranking the highest, and LatAm economies ranking among the lowest of the group.
In some instances where female labour force participation is high despite the economy's otherwise low rank on family-friendly policies, the outright labour force participation may only be telling part of the story. The Netherlands, for example, has a relatively high female labour force participation rate, but on government support for families the country ranks among the bottom 10 of the group. Here, it is likely that women make up for the lack of family support in other ways, as ~78% of employed women in the Netherlands work part-time.
Similarly, there are nuances within family-friendly policies that matter for equality and women's labour force participation. For example, in many countries parental leave still only applies to the woman (i.e., there is paid maternity leave but not paid paternity leave). Some countries have expanded this to include fathers: Japan offers one year of paid parental leave exclusively for fathers, entirely separate from any leave granted to mothers. Sweden offers both parents access to 480 days of shared leave. But availability and take-up are two separate things; in no country is parental leave taken on an equivalent basis (in Sweden one-fifth of the time on parental leave is used by fathers, the highest in the western world). Shared leave should in theory encourage shared responsibility for child care and when leave is taken by fathers it does have a statistically significant effect on women’s labour force participation rates.

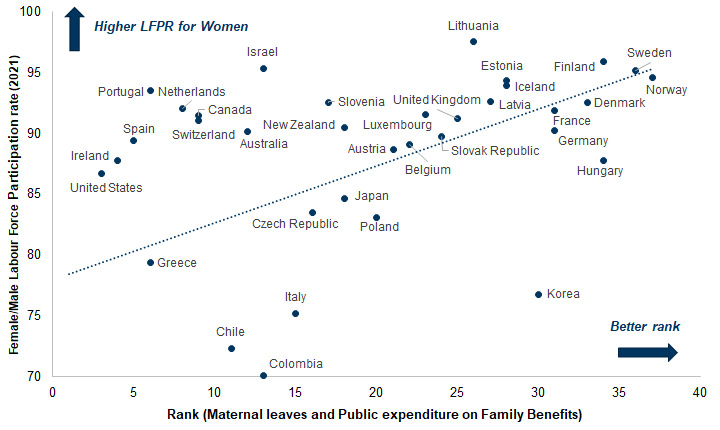
Exhibit 19: There is a positive correlation between female labour force participation and family-friendly policies

OECD Data (15-64 years LFPRs)
19. There is a positive correlation between female labour force participation and family-friendly policies. Data available on request.
Source: Datastream, Goldman Sachs Global Investment Research

Economic development of the country

Lastly, economic development on its own is positively correlated with female labour force participation. As shown in Exhibit 20, the higher a country's GDP per capita, the higher the likelihood of a woman entering the labour force. There are likely a number of reasons for this, such as the improvement in education that tends to be accompanied by rising income levels, but also the reverse causality of higher education and female labour force participation contributing to GDP. Nevertheless, there are also some clear outliers, such as Sub-Saharan African (SSA) economies, where female labour force participation is high despite lower GDP per capita, and the MENA region, where female labour force participation is lower despite otherwise high GDP per capita.
The high levels of female labour force participation in SSA can generally be attributed to agriculture, where women often participate in small-holder agricultural work. In the MENA region, our EM Womenomics research found that a lack of government laws protecting women's rights in and outside the workplace are likely the contributor to lower female labour force participation, though these have started to improve in recent years.
In relation to economic development, it is important to address the notion that higher economic development and, by extension, female labour force participation reduce fertility levels. If true, then it would be a concern given exceptionally low and declining fertility in many countries. Historically, lower fertility rates have coincided with higher per capita income, as well as greater education and female labour force participation. But new research suggests that, for developed economies, this relationship has reversed. Here, there is a positive relationship between countries with higher per capita income and fertility, as well as women's labour force participation and fertility (see the 2022 NBER paper "The Economics of Fertility: A New Era", and GS Japan Economics Analyst "Pulse Check on Womenomics Amid Deteriorating Fertility). Instead, the research argues that four factors facilitate combining a career with a family: family policy, cooperative co-parents, favourable social norms, and flexible labour markets.
For parts of the emerging world where higher economic development and female education have been linked to lower fertility rates, fertility rates have come down from very high levels, and the decline has been linked to other positive outcomes, such as greater investment per child, and a higher educational attainment of children.

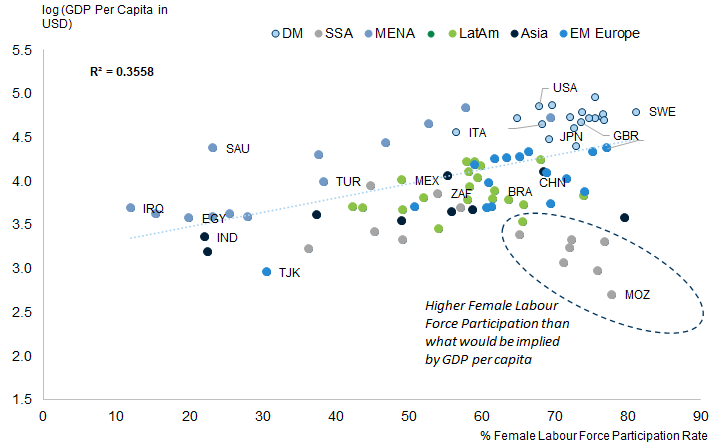
Exhibit 20: There is generally a positive correlation between countries' GDP per capita and female labour force participation

20. There is generally a positive correlation between countries' GDP per capita and female labour force participation. Data available on request.
The trend line and R-squared exclude MENA and SSA as outliers (see text for discussion)
Source: World Bank, Haver Analytics, Goldman Sachs Global Investment Research

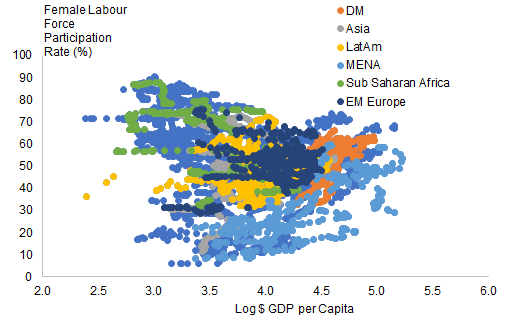
A U-Shaped Relationship between Female Labour Force Participation and Economic Development?

As described above, the high levels of female labour force participation in Sub-Saharan Africa can generally be attributed to agriculture, where women often participate in small-holder agricultural work. For middle-income economies that depend less on agriculture, women's labour force participation tends to be lower, and for high-income countries, which depend more on service-sector-based economies, female labour force participation increases.
This observation has typically been described as the U-shaped relationship between a country's economic development and female labour force participation. Looking across the economies in our sample, we find that Japan exhibited this type of relationship between economic development and female labour force participation in the 1950s and 1960s (Exhibit 21). But, more broadly, the notion of the U-shape is less convincing when viewed through the lens of the ~92 economies in our sample, as seen in Exhibit 22.
Reflecting this, more recent studies suggest that the relationship may not be as strong as initially thought, as the pattern does not hold within regions or specific countries over time. Moreover, lower-income countries today have higher female labour force participation than higher-income countries did when their GDP per capita was at the same level.
The World Bank suggests that "the relationship of female labor force participation to GDP for lower-income countries today is different from was the case decades past. This could be driven by numerous factors, such as changing social norms, demographics, technology and urbanization".

Exhibit 21: Japan initially saw a drop in the female labour force participation before it rose again

21. Japan initially saw a drop in the female labour force participation before it rose again. Data available on request.
Source: World Bank, Haver Analytics, Goldman Sachs Global Investment Research

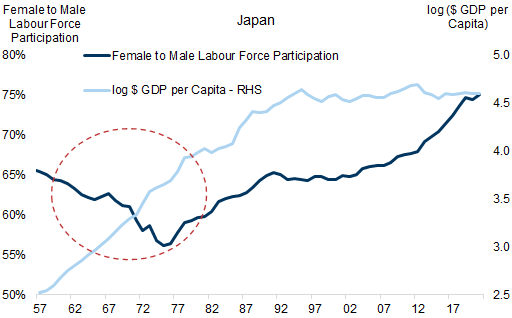
Exhibit 22: Is the relationship between female labour force participation and GDP per capita U-shaped?

22. Is the relationship between female labour force participation and GDP per capita U-shaped? . Data available on request.
Exhibit shows the relationship between the Female Labour Force Participation rate (% Total Women) and Log $ GDP per capita across ~92 countries going back to 1990 where data is available.
Source: World Bank, Haver Analytics, Goldman Sachs Global Investment Research

Women in leadership: Improving (slowly)

Women are still hugely under-represented in leadership positions, although on most metrics and in most regions representation is gradually improving. There are more women in parliament in DM and EM countries (Exhibit 23). And women now make up about a third of company managers in many regions, although the Middle East and Asia lag behind (Exhibit 24).

Exhibit 23: There are more women in parliament in DM and EM countries

Proportion of Seats Held by Women in National Parliament (%)
23. There are more women in parliament in DM and EM countries. Data available on request.
Source: World Bank, Haver Analytics, Goldman Sachs Global Investment Research

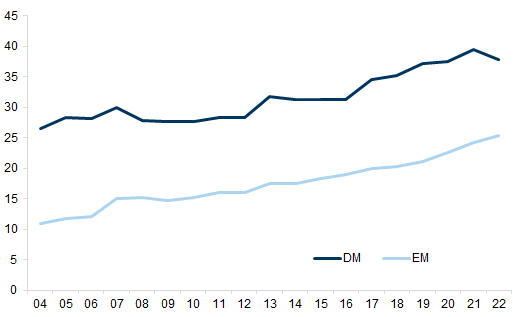
Exhibit 24: Women now make up about a third of company managers in many regions, although the Middle East and Asia lag behind

Share of women in middle and senior management in different regions
24. Women now make up about a third of company managers in many regions, although the Middle East and Asia lag behind. Data available on request.
Source: World Bank, Haver Analytics, Goldman Sachs Global Investment Research
There has been a lot of focus in recent years on the representation of women on company boards (see Europe moving ahead). Almost every country has seen women’s representation on company boards rise, and in most countries in Europe and in the US, the ratio is now above 30%, with a few countries above 40% (Norway and France, both of which have stringent and long-standing quotas). EMs have also seen a sharp increase; in South Africa, representation of women at board level in listed companies leapt from 19% in 2016 to 34%, and in Brazil the ratio has risen from 6% to 19% (Exhibit 25).
But digging a little deeper, we tend to find that the leadership of women is still more marginalised than that of men. Women on the board (WoB) is targeted by companies: sometimes through legal quotas but often just through the importance allocated to this in the media and by ESG-focused investors. The share of women on the board is relatively easy to change as the numbers of people involved are small and, in many cases, the women are frequently in non-executive rather than executive or C-suite roles.

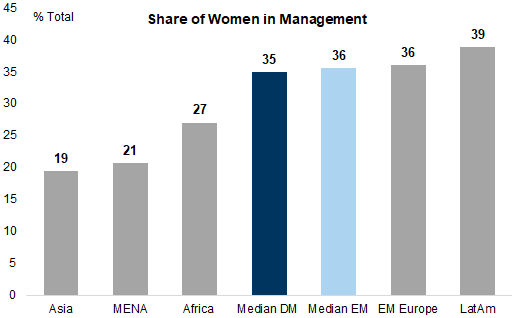
Exhibit 25: Almost every country has seen women’s representation on company boards rise

Female share of seats on boards of largest public companies. Includes executive and non-executive directors. Light blue represents EMs and dark blue DMs.
25. Almost every country has seen women’s representation on company boards rise. Data available on request.
Source: Haver Analytics, Goldman Sachs Global Investment Research
As we go up the power structure of companies, the ratio of women diminishes (Exhibit 26). In EMs the ratios at every level are typically even worse, and at the top levels women are largely absent. That said, while nearly all DM companies report the gender split for employees at different levels, we were only able to obtain this information for c.30% of EM-listed companies, so our incomplete data-set may be skewing the result.

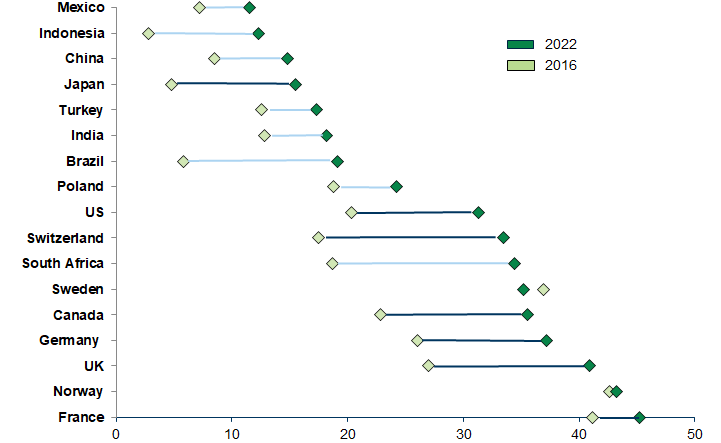
Exhibit 26: As we move up the power structure of companies, the ratio of women diminishes

Average ratio of women at different positions, 2022/23 Data
26. As we move up the power structure of companies, the ratio of women diminishes. Data available on request.
Source: Datastream, FactSet, Goldman Sachs Global Investment Research
While policies on quotas can increase representation, they can distort it too. There is evidence that the focus on WoB in Europe has meant an outsized representation of women at that level, compared with, say, the US or most EMs – but less so at other levels, such as Executive Director or CEO (Exhibit 27). Policies that promote women in the workforce more broadly, improved access to education, increased funding for small businesses/access to finance, and more public policies to help support childcare costs are more likely to provide deeper and broader change.
Over time, the representation of women at all levels of seniority has improved – just 1% of Europe/US CEOs were women in 2008 compared with around 8% now – although progress has been from a low start point. But there is a long way to go even in DMs (Exhibit 28).

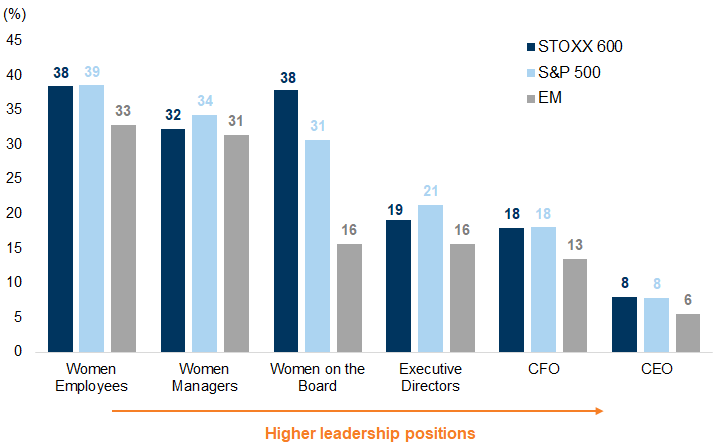
Exhibit 27: Focus on WoB in Europe has meant an outsized representation of women at that level

% of women on board for STOXX 600 and S&P 500
27. Focus on WoB in Europe has meant an outsized representation of women at that level. Data available on request.
Source: Datastream, Goldman Sachs Global Investment Research

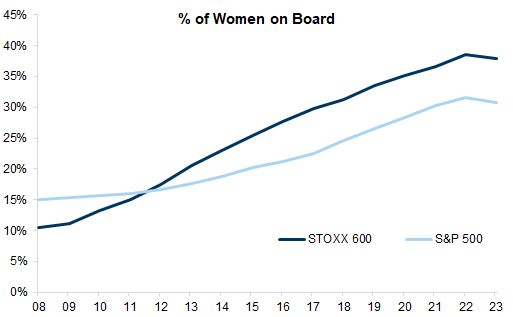
Exhibit 28: Just 1% of Europe/US CEOs were women in 2008 compared with around 8% now

% of women CEOs for STOXX 600 and S&P 500
28. Just 1% of Europe/US CEOs were women in 2008 compared with around 8% now. Data available on request.
Source: Bloomberg, FactSet, Goldman Sachs Global Investment Research

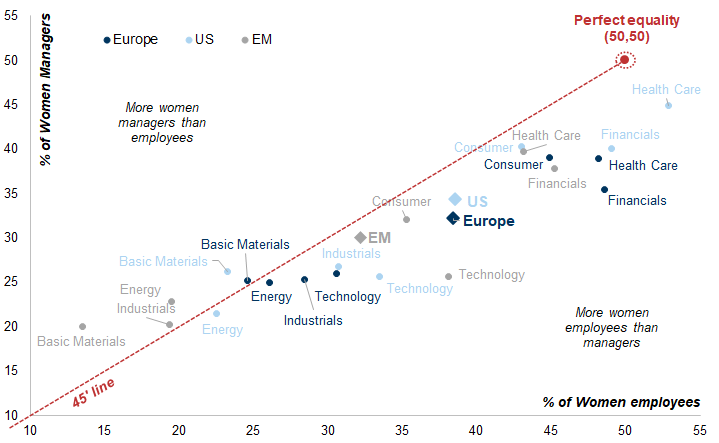
Women under-represented in high-paying industries

We find in every sector that women are under-represented at the management level (Exhibit 29). Even where women make up c.50% of the workforce – in Healthcare, Consumer sectors and Financials – they are under-represented in management.
And, this mobility gap – between representation in the workforce and representation at more senior levels – is often highest for high-paying industries, such as Financials and Technology.
In contrast, some industries have relatively few women employees but no obvious mobility gap. The ratio of women employees is low across all regions in Basic Materials, Energy and Industrials, but the ratio of women managers is higher than for women employees (they are above the line in Exhibit 29). There are fewer women in these industries, but they are more likely to succeed.
No industry sits at 'perfect equality' of 50/50 for both women managers and women employees, although US Healthcare is close.

Exhibit 29: We find in every sector that women are under-represented at the management level

% of women managers vs. % of women employees for STOXX 600, S&P 500 and EM Markets
29. We find in every sector that women are under-represented at the management level. Data available on request.
Consumer is an average of Consumer Staples and Consumer discretionary
Source: Datastream, Goldman Sachs Global Investment Research
In our previous research, we showed that, in Europe, companies with more diversity on the board or in management performed better, and many studies show that greater diversity adds to performance and/or reduces volatility of returns. Also, women in leadership roles act as role models for girls in their progress through education and the workforce, and should over time elevate the perception of women in society.

Women and AI: More impact, but more potential to gain

Women's lack of a leadership role in technology is especially worrisome at a time when developments in Artificial Intelligence (AI) could have a large influence on economies and jobs. There are several ways in which AI could impact gender equality: the extent to which women are part of the development and research on AI, the extent to which women are more or less affected by changes in jobs and, finally, the impact that AI programming might have on perpetuating gender gaps.

Women are under-represented in the development of AI...

According to the Alan Turing Institute, women make up just 20% of AI and data professionals and 18% of users across the largest online global data science platforms.
A Unesco paper argues that too few women participate in AI-related jobs globally. They point to studies finding that only 18% of authors at leading AI conferences are women and more than 80% of AI professors are men. Women accounted for only 14% of authors of AI peer-reviewed articles worldwide. This fits with our findings on the lack of women in leadership positions across the Technology sector.

....and potentially by biases in the data

Lack of women in the development of AI is a challenge for the future trajectory and development of AI systems. The Unesco paper argues that, if systems are not developed by diverse teams, they will be less likely to cater to needs of diverse users.
There is a risk that current gender gaps, or gaps based on race or other characteristics, become more entrenched given that AI systems are fed on the data-set available. For example, assessments for hiring are often biased since they rely on the current set of ‘successful’ employees.
That said, generative AI could prove the solution to some of the problems relating to biases. Our Technology analysts argue that, over time, as the underlying data models are re-trained with improved information, accuracy increases. In areas such as healthcare, generative AI could help improve imbalanced and unrepresentative data-sets that are often overly dependent on men in clinical trials.

Women are more likely to be more affected by a changing jobs market

Our colleagues recently estimated that up to one-fourth of current work tasks could be substituted by AI in the US and Europe. The impact of AI is likely to be higher in developed markets than in emerging markets, given the higher share of service sector jobs in DM economies where tasks can be automated due to AI.
As we showed in our EM Womenics report, women are more likely than men to work in services across both EM and DM, suggesting they are likely to be disproportionately impacted by AI automation. They are also underrepresented in some of the jobs least likely to be impacted by AI (at least initially), such as construction or maintenance.

Exhibit 30: Jobs most likely to be impacted by AI tend to employ more women relative to men in the US...

% of women/men employed (y-axis) and the % of the job which can be done by AI (x-axis)
30. Jobs most likely to be impacted by AI tend to employ more women relative to men in the US.... Data available on request.
Buckets on X-axis represent 0-15%, 15-30%, 30-45% and 45% or higher share of work that can be done by AI
Source: US Bureau of Labor Statistics, Goldman Sachs Global Investment Research

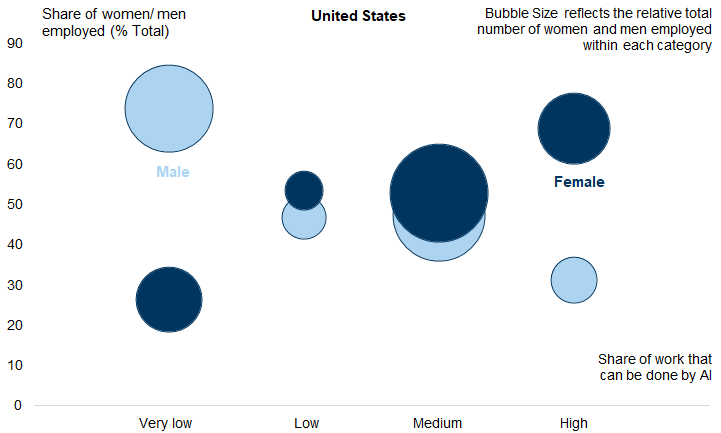
Exhibit 31: ...and in Europe

% of women/men employed (y-axis) and the % of the job that can be done by AI (x-axis)
31. ...and in Europe . Data available on request.
Buckets on X-axis represent 0-15%, 15-30%, 30-45% and 45% or higher share of work that can be done by AI
Source: Eurostat, Goldman Sachs Global Investment Research
Using our economists' estimate for the share of job tasks that could be automated by AI, we bucket them into very low, low, medium and high exposure to AI (i.e., roughly half or more of the work task). Exhibit 30 and Exhibit 31, which show the gender splits of the employment data for the US and Europe across those work tasks, suggest that, although the majority of women in employment are not in the category with high exposure, the majority of people in the high exposure category are women.
While women are more likely to be impacted by AI, it is not obvious what the exact impact will look like. Some AI automation may render certain jobs obsolete, but in other instances it may simply enhance productivity, which in turn should push up wages.
For example, service sector roles that require a high degree of face-to-face interaction or caring professions might be impacted by AI and even made more productive, but are unlikely to be supplanted by it.
Moreover, the loss of some jobs may lead to the creation of others, as has been the case through previous episodes of technological revolutions. It's notable that the rise in women's participation in the labour market in the last 50 years has been concurrent with many waves of new technologies.
Finally, it is worth addressing here that, in relation to the decline in working populations, AI could play a huge role in plugging that gap, just as getting more women into the labour force could. The key is for the two to complement one another, and here the continued education of girls and women will once again be instrumental in ensuring that they benefit from this part of the latest technological revolution.

What can policy-makers, corporates and investors do?

Our aim here is not to be prescriptive, and each economy has its own distinctive set of needs. And, as we have discussed, starting points are very different, as is the cultural backdrop. But, assuming governments have already ensured equal rights between men and women (such as no discrimination, right to divorce, access to credit), we see several areas of focus for policy-makers, corporates and investors:
  • Education is all-important. As we show earlier in the report, female participation hasn't risen when adjusted for the level of education. It is women with a higher level of education who are both more likely to work and more likely to earn more when they are employed (and who typically spend this increased income on their families, enhancing their children's educational attainment, health and welfare, and providing a secondary boost to growth).

  • Family-friendly policies, including maternity and paternity leave, as well as subsidised (and good quality) childcare. All these policies are associated, albeit loosely, with higher female labour force participation.

  • Pay gaps, which are still large and still largely unexplained. The UK requires pay gap disclosures, and we think more transparency is often times helpful. The UK pay gap has fallen more than in most other DMs (albeit from a higher starting point) and research suggests that some of this may be accounted for by the pressure from disclosure. However, we recognise that at least some of the pay gap is down to different choices by men/women in terms of the type of jobs done and/or total hours worked. Again, it is equality of opportunity that matters rather than equality in outcomes.

  • Broadening out the leadership pipeline. There has been a sharp rise in the share of women sitting on company boards, especially in Europe, where this metric has been a particular focus. The change has been dramatic in one generation, and we think it should be applauded. But there has not been a comparable rise in the number of women in other leadership roles: neither further down the business hierarchy at the management level nor further up at the executive director, CFO or CEO level. Focusing too much on one statistic has the advantage of being transparent and easily traceable but it can distort outcomes. We think focusing on broadening the pipeline at all levels is important. The sectors where we think the focus should be greatest are Technology and Financials, as these sectors are lagging both in terms of female representation generally and also at more senior levels. These sectors are also crucial when it comes to financing for women-led businesses and the implications of AI on work patterns for both men and women.

We would like to thank Parthivi Bansal, an intern in the Equity Strategy team, for her contributions to this report.

Investors should consider this report as only a single factor in making their investment decision. For Reg AC certification and other important disclosures, see the Disclosure Appendix, or go to www.gs.com/research/hedge.html.