Global Equity Views
'Fat & Flat' strikes back
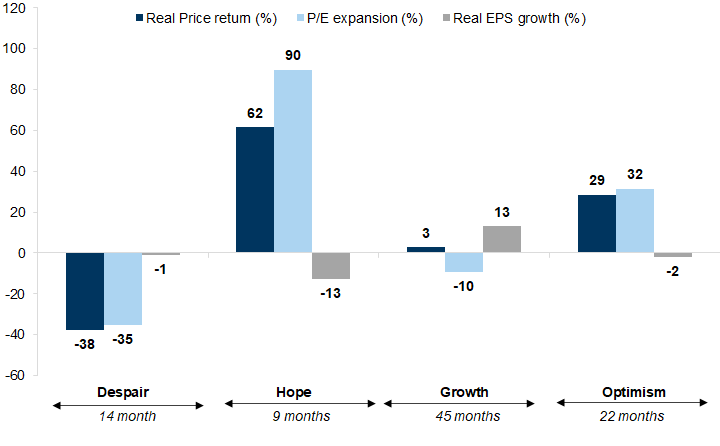
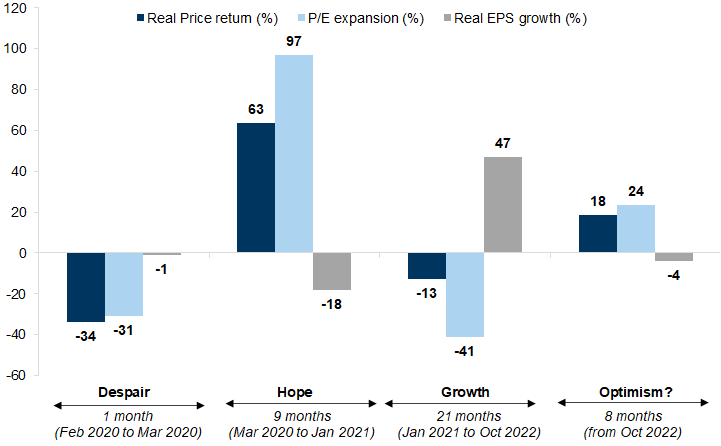
1) One of the questions we hear most frequently from clients is 'where are we in the cycle'? Of course, no two cycles are the same given that their drivers, and the structural factors that influence them, can vary significantly between one cycle and another. That said, we find that most cycles go through four phases, starting with ‘Despair’ (a bear market) and followed by ‘Hope’ – the strongest and shortest phase, where markets and valuations rise in anticipation of a future profit growth recovery. Next, there is usually a ‘Growth’ phase, where profits recover and grow but valuations fall back and returns moderate. The final phase, which we describe as ‘Optimism’, is generally associated with increasing valuations even as interest rates rise (Exhibit 1). It is generally easier to identify these phases well after they have happened rather than in real time, but we do find that, so far, this cycle has followed this classic pattern (Exhibit 2). Although the Despair phase at the start of the pandemic was shorter than normal (only around one month), it was similar in magnitude to the average cycle. The Hope phase was in line with the average in terms of time (9 months) and annualized returns (at over 60%). The growth phase, despite its name, is typically associated with lower returns. This is because, while EPS are rising, it has often already been paid for in the Hope phase. This has been the case in the current cycle, between January 2021 and October 2022 which was also weaker than average because of the speed of interest rate rises. The optimism phase which started in late 2022 has largely been in line with history, driven by higher valuations.
Exhibit 1: The 4 phases of an equity cycle
Annualized data for historical phases (S&P 500)
Source: Datastream, Haver Analytics, Goldman Sachs Global Investment Research
Exhibit 2: The 4 phases of the current cycle
Cumulative data for current phase (S&P 500)
Source: Datastream, Haver Analytics, Goldman Sachs Global Investment Research
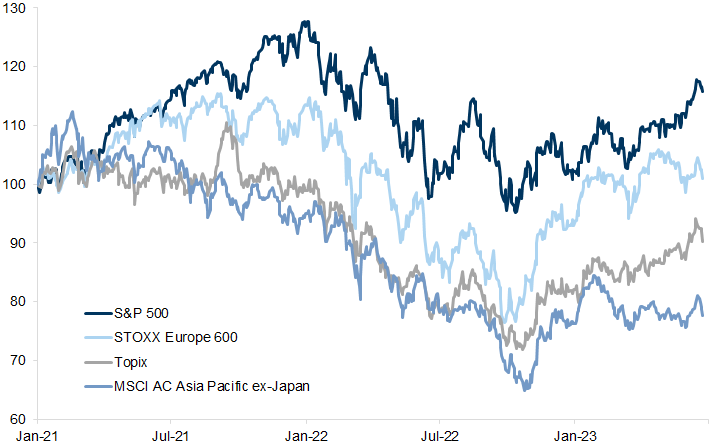
2) While the pattern of returns has been similar to the past, particularly in the Despair and Hope phases, we have argued that the scale of the returns would be relatively 'Fat & Flat', with returns constrained by the ongoing tug of war between rates and growth fears, the higher than average valuations, particularly in the US, and a backdrop of weak earnings growth despite a likely soft landing. The S&P 500, for example, is at more or less the same level as in the summer of last year. Japan and Europe are a little higher, but Asia is a little lower. Overall, the global equity index is broadly unchanged.
Exhibit 3: The Growth phase in the current cycle has been ‘Fat & Flat’ – with relatively low returns in a wide trading range
World equity indices (indexed price performance, USD)
Source: Datastream, Goldman Sachs Global Investment Research
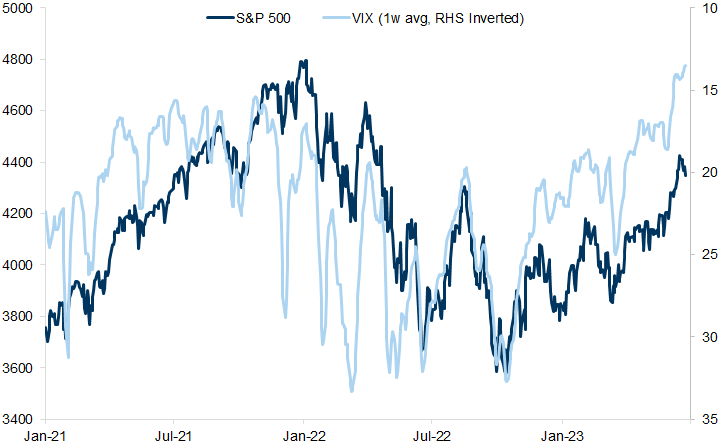
3) In recent weeks, however, the equity markets have enjoyed a rally, which led to optimism that indexes would decisively break out of the range. This shift higher, since June in particular, has come alongside falling volatility triggered by the fading of left-tail risks, and by large equity dispersion: the resolution of the US debt ceiling and slowing of deposit flight from US regional banks have both helped, while lower commodity prices have reduced the risks of inflation becoming more entrenched. The more recent intense focus on AI and its impact has also provided a narrative to fuel renewed enthusiasm for growth. In combination, equity markets were rising despite pedestrian profit growth in most regions and valuations have increased despite higher interest rates, even (and in some cases in particular) in the long-duration technology areas of the markets. These are all characteristics of the typical late-cycle Optimism phase.
Exhibit 4: Equities have enjoyed a rally, which came alongside falling volatility
S&P 500 and VIX (1-week average)
Source: Bloomberg, Goldman Sachs Global Investment Research
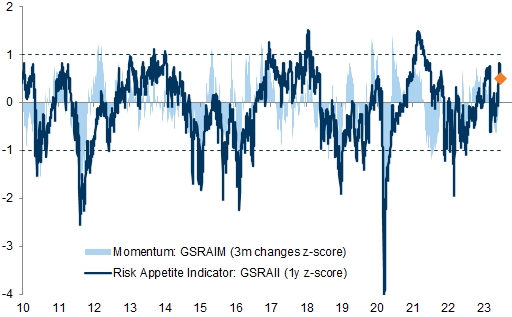
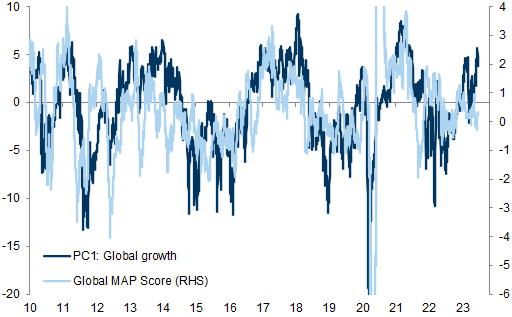
4) Another important driver of equities in recent weeks has been that the market-implied probability of recession has moved towards our economists' more positive view on economic growth. Our GOAL Team flagged that the increase in our Risk Appetite Indicator has been mostly driven by a sharp pro-cyclical repricing across assets, pushing our PC1 'Global Growth factor' to the highest level since early 2021. Markets have moved ahead of macro data, and the current gap between PC1 and macro surprises as captured by the global MAP score is large, suggesting that a soft landing is being priced.
Exhibit 5: The increase in our Risk Appetite Indicator has been mostly driven by a sharp pro-cyclical repricing across assets
Risk Appetite Indicator level and momentum factors
Source: Goldman Sachs Global Investment Research
Exhibit 6: Markets have moved ahead of macro data
PC1: Global growth factor and Global MAP Score
Source: Datastream, Goldman Sachs Global Investment Research
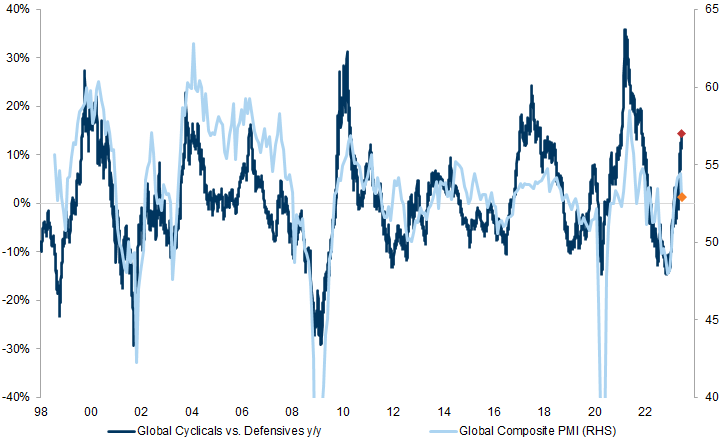
A similar observation can be made looking at global cyclicals versus defensives and plotting this against the global PMI. Despite the most recent softening of survey data, market pricing appears to be consistent with stronger growth moving forward.
Exhibit 7: Market pricing appears to be consistent with stronger growth moving forward
Global Cyclicals vs. Defensives y/y and Global Composite PMI
Source: Datastream, Worldscope, Haver Analytics, Goldman Sachs Global Investment Research
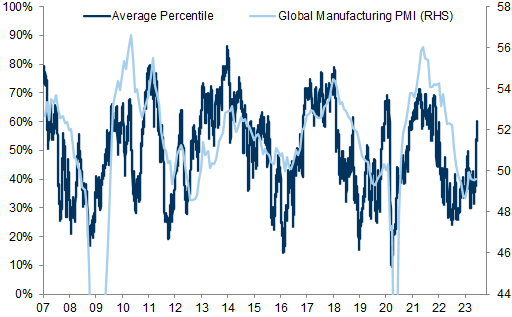
5) Despite these improvements, we think the absolute upside for equity markets is constrained by both high valuations and the prospects for interest rates to remain higher for longer than the market has been pricing. Post the June meeting, ECB commentary has turned more hawkish, with Board Member Schnabel arguing that the optimal risk management strategy was still to err on the hawkish side and Governor Wunsch calling for hikes this past November. Chair Powell emphasized the need for further tightening in his semi-annual testimony to Congress. Last week, the Bank of England and the Norges Bank surprised to the upside with a move of 50 bps. Meanwhile, on the activity front, PMIs continued to see weakening activity which has largely been concentrated in the manufacturing sector but more recently extended to services as well.
Exhibit 8: Sentiment Indicators have sharply increased while Manufacturing PMIs remain weak
Average percentile of sentiment indicators (data since 2007) and Global Manufacturing PMI
Source: Datastream, Haver Analytics, Goldman Sachs Global Investment Research
Exhibit 9: Elevated levels of sentiment do not, in themselves, represent a bearish signal
S&P 500 3m return distribution
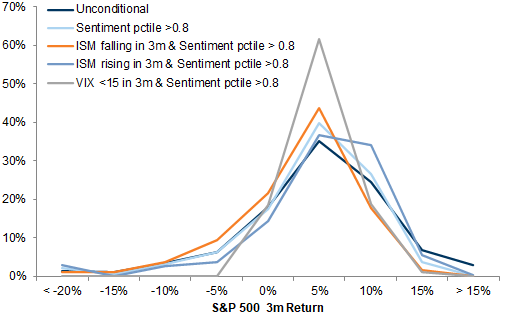
Source: Datastream, Haver Analytics, Goldman Sachs Global Investment Research
Elevated levels of sentiment point to a less favourable asymmetry for equity returns but do not, in themselves, represent a bearish signal – the distribution of subsequent 3-month S&P 500 returns from levels of our sentiment component above the 80th percentile shows that the right tail is more capped relative to the unconditional, but the left tail is not 'fatter'. In terms of valuation, the US equity market in particular is trading at valuations well above the historical averages (Exhibit 10), and is now close to 20x forward consensus earnings (and even higher on our lower earnings assumptions). Other markets look cheaper, although in most cases they too have re-rated in recent weeks. The combination suggests that the Fat & Flat range remains intact.
Exhibit 10: The US equity market is trading at valuations well above the historical averages
12m fwd P/E ranges (MSCI Regions) over a 20-year timeline
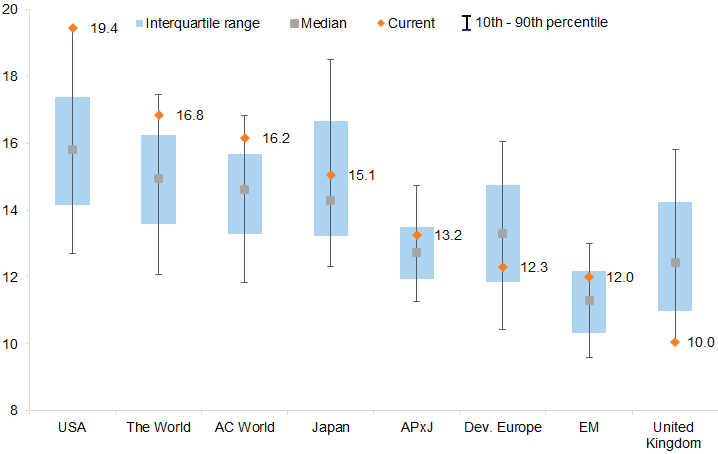
Source: FactSet, Goldman Sachs Global Investment Research
Valuations of equities have also increasingly de-coupled from real interest rates. As Exhibit 11 shows, the S&P 500 P/E has increased sharply in recent weeks despite a rise in real bond yields. This implies that either investors expect rapid rate cuts, or that long-term growth expectations have gone up, or a combination.
Exhibit 11: Valuations of equities have increasingly de-coupled from real interest rates
S&P 500 12m fwd P/E and US 10y Real Yield
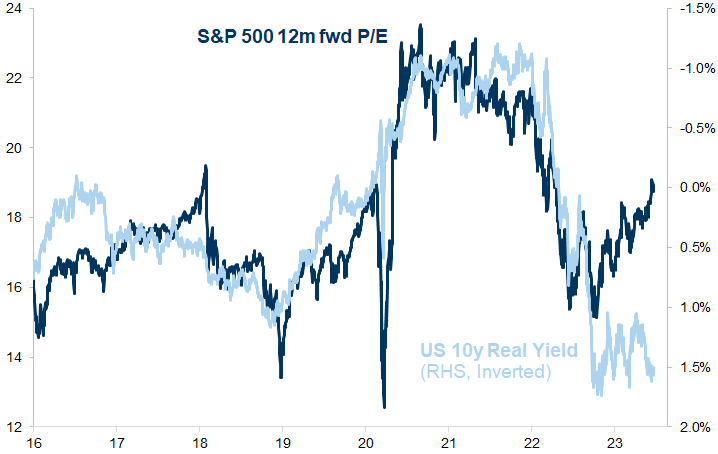
Source: FactSet, Goldman Sachs Global Investment Research
6) In our view, this optimism on interest rate relief is premature; our economists have argued that the market-implied path for inflation remains too optimistic and, by inference, the prospects for interest rate declines. In the US, the gap between our expected path for inflation and the market-implied path continues to rise into next year.
Exhibit 12: The gap between our expected path for inflation and the market-implied path continues to rise into next year
Inflation, GS forecast and market-implied (United States)
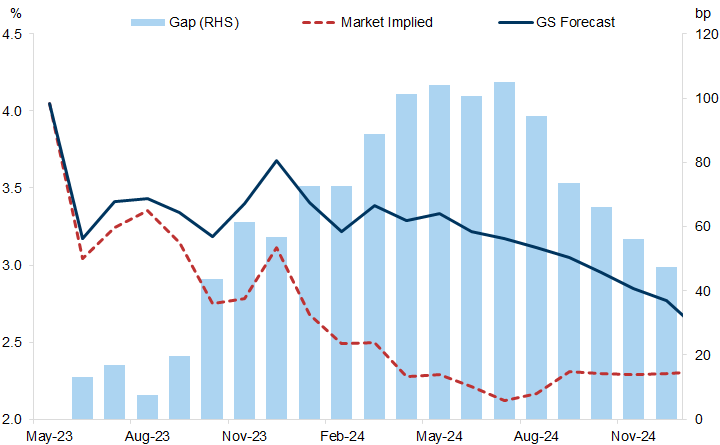
Source: Bloomberg, Goldman Sachs Global Investment Research
7) Even if the market happens to be right in expecting earlier rate cuts than we do, the reasons for these interest rate cuts would matter. Exhibit 13 shows that, in recent cycles, the path of returns on equities once interest rates cuts begin depends on the path for growth, as well as market valuations.
Exhibit 13: The path of returns in equities once interest rates cuts begin depends on the path for growth as well as market valuations
S&P 500 price performance. Indexed to 100 the day of the Fed's first cut in a cutting cycle
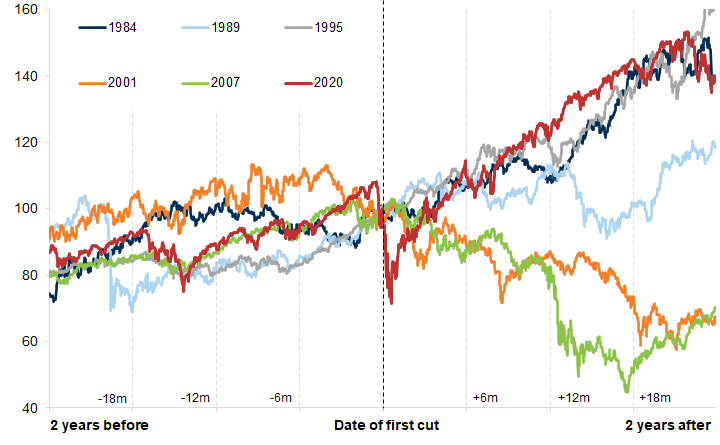
Source: Datastream, Goldman Sachs Global Investment Research
A persistent deterioration in the economic environment, even after rate cuts, had continued to weigh on equity returns during the financial crisis. By contrast, interest rate cuts did not help the equity market in the aftermath of the collapse of the technology bubble at the turn of the century because valuations were so high. At the current time, in the absence of a recession, the urgency for central banks to cut interest rates is likely to be less than the market is pricing.
While we do not expect a recession, the outlook for profit growth remains subdued (Exhibit 14). We expect virtually no profit growth (other than in Japan) this year, and mid-single-digit growth rates (other than in Asia, from a low base) next year.
The combination of high valuations and relatively slow profit growth implies a positive, albeit moderate, return for equities.
Exhibit 14: The outlook for profit growth remains subdued
MSCI AC World EPS growth y/y (GS forecasts in orange)
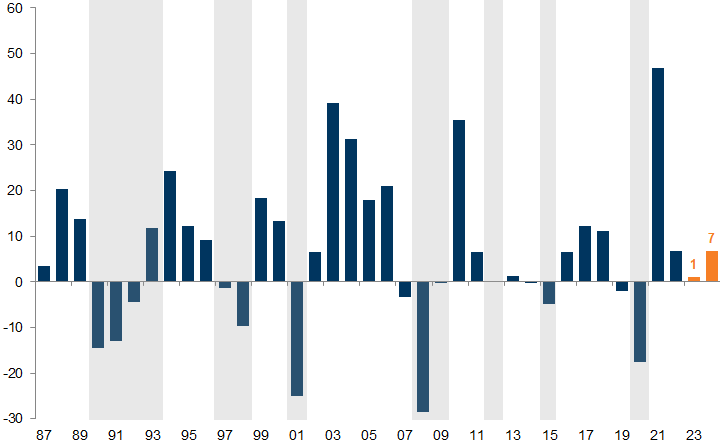
Source: I/B/E/S, MSCI, Goldman Sachs Global Investment Research
8) An additional concern is that the contributions of returns in most equity markets have been narrow. It is not uncommon to have a narrow market late in the cycle, during the Optimism phase, but it remains a concern for active investors (in Europe and US). As shown in Exhibit 15, the 15 biggest companies have driven 86% of the return in the US year to date and 100% in Asia (ex Japan). Europe’s market breadth has been somewhat healthier, with 39% coming from the biggest 15 companies, but the performance of the median company has been very modest.
Exhibit 15: The 15 biggest companies have driven 86% of the return in the US year to date and 100% in Asia (ex Japan)
% Contribution to YTD change in market cap
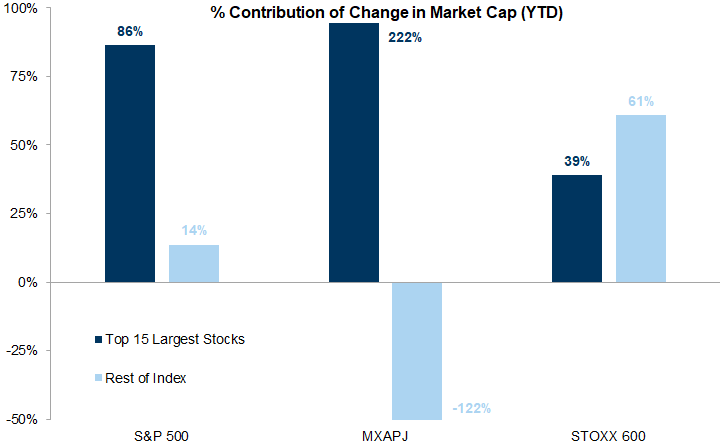
Source: Datastream, Goldman Sachs Global Investment Research
Year to date, the biggest 15 companies in the S&P have gone up 34%, while the median company is up just 1%. On this basis, Japan has had the most impressive returns, with the median company up 11% (Exhibit 16).
Exhibit 16: YTD, the biggest 15 companies in the S&P have gone up 34%, while the median company is up just 1%
YTD price return
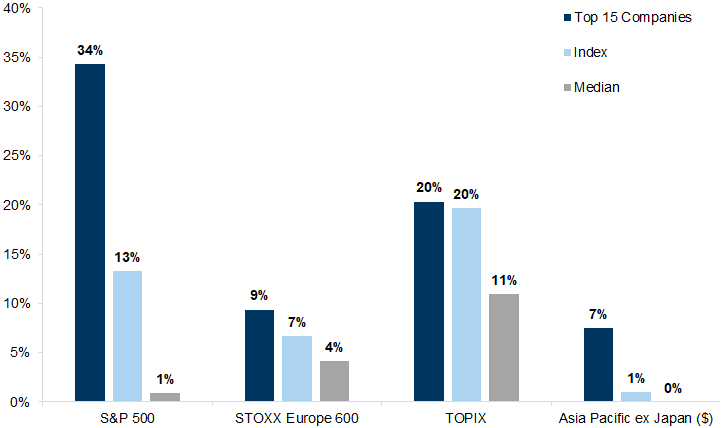
Source: Datastream, Goldman Sachs Global Investment Research
9) A debate has now grown around this narrow leadership of the market: will it be resolved by a catching-up of the rest of the market or through a catching-down of the leading companies? We have found that in Europe, when the market is rallying with narrow leadership, subsequent 12m returns for the aggregate index are positive in 71% of instances (unconditional average following rallies = 62%). Over the past couple of weeks, market breadth has started to improve, suggesting that greater confidence in growth is leading to a widening of optimism about non-tech parts of the market. But the narrow contributions of returns remain very significant – particularly in the US, driven by technology. Also, equity/bond yield correlations have been positive, even for long duration Nasdaq, resulting in lower equity risk premia and equities turning more expensive relative to bonds.
The dominance of the tech rally has come despite the rise in interest rates, suggesting that the drivers of the re-rating are not duration, but rather an increase in longer-term growth expectations, reflecting the perceived benefits accruing to these companies (from AI). This is also reflected in the way that US technology valuations are moving ahead of those in other markets. For example, their valuations have recently pulled away from the valuations of the tech sector in Europe (Exhibit 17).
Exhibit 17: The valuations of US tech have recently pulled away from those of the European tech sector
24m fwd P/E, S&P 500 and MSCI Europe Information Technology
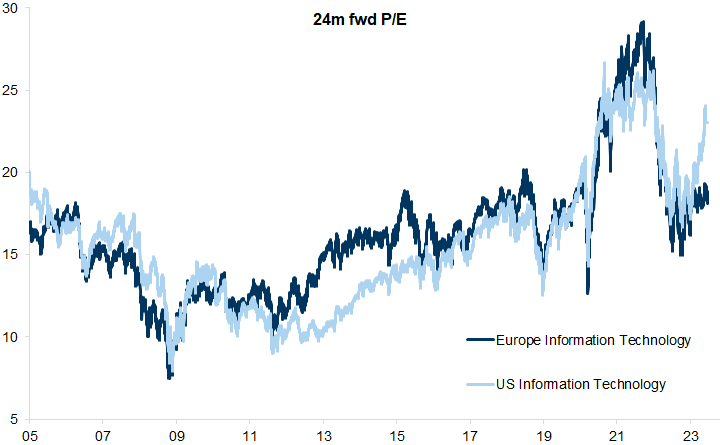
Source: FactSet, Goldman Sachs Global Investment Research
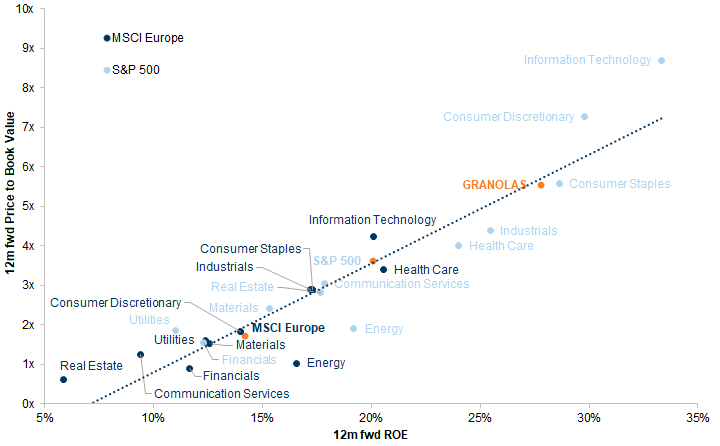
At the same time, comparing sectors across the US and Europe on a Price-to-Book basis with their Return On Equity shows that most sectors are valued in line with expected profitability. The S&P 500 and the STOXX 600 are trading in line with expected returns and so, too, are the 'healthy' GRANOLAS. Technology is maybe an exception, having moved above the curve. By contrast, European Energy remains well below the curve.
Exhibit 18: Most sectors are valued in line with expected profitability
S&P 500 and MSCI Europe GICS level 1 sectors, 12m fwd Price to Book Value and ROE
Source: FactSet, Goldman Sachs Global Investment Research
We continue to like a barbell approach that includes a combination of quality growth, strong balance sheet and high margin businesses, with some deep value where valuation risks are skewed to the upside.
10) Overall, we expect most equity markets to remain in the 'Fat & Flat' range, while making a return close to their cost of capital over the next 12 months, reflecting the absence of recession. Nevertheless, poor earnings growth at the index level and high valuations, particularly in the US, suggest that the upside risks are limited over a 12-month view relative to cash on a risk-adjusted basis. Put-call skew indicates that upside positioning is now crowded and downside protection is attractively priced.
Investors should consider this report as only a single factor in making their investment decision. For Reg AC certification and other important disclosures, see the Disclosure Appendix, or go to www.gs.com/research/hedge.html.