Goldman Sachs Research
US Economics Analyst
The Case for Declining Core Inflation (Hill)
2 July 2023 | 10:43PM EDT | Research | Economics| By Jan Hatzius and others
More
  • Core inflation stopped falling in the first half of the year, and the FOMC now projects the core PCE measure to end the year at nearly double its 2% target. However, we see four reasons to expect renewed declines in inflation this summer and beyond: 1) the 9% pullback in used car auction prices that we believe is only halfway done, 2) negative residual seasonality in the summer for CPI and PCE prices, 3) the sharp deceleration in apartment rent list prices and diminished upward pressure from lease renewals, and 4) significant progress on labor market rebalancing.

  • Used car prices surprised to the upside in the first half of the year due to China’s Covid wave and a lull in global microchip production. But looking ahead, the three strongest predictors of used car prices—new vehicle inventories, new vehicle incentives, and the new-versus-used price differential—all point to significant declines. Used car auction prices have already pulled back 9%, and our model suggests another 9% drop this summer and fall. And importantly, these declines will begin flowing through to consumer prices with the June CPI data in two weeks.

  • The second reason to expect lower inflation this summer is residual seasonality. We find that both the CPI and PCE seasonal factors are spuriously fitting to the sharp in rebound in travel and transportation categories in mid-2020, following the end of the initial Covid lockdowns. We estimate seasonal headwinds of 10-15bp (mom sa) in both of the next two core CPI readings (June and July) and of 5bp in each of the next three core PCE readings (June, July, and August).[1]

  • We also continue to expect a further decline in shelter inflation. The best alternative rent measures have slowed from a +20% annualized pace in mid-2021 to just over +1% annualized in last 8 months. Additionally, Cleveland Fed research and our own analysis using alternative rent data reveal that at least half of the post-pandemic premium on new rental units has unwound—which will reduce upward pressure on lease renewals. These findings validate the spring stepdown in monthly shelter inflation and argue for additional slowing in coming quarters.

  • The final reason to expect lower inflation readings is also the most durable: the significant progress on labor market rebalancing. Our jobs-workers gap has roughly halved, and sequential growth in average hourly earnings has already slowed to the 4% pace we believe is necessary to bring medium-term inflation back into the Fed’s comfort zone. The normalization of commodity prices and inflation expectations—both beneficiaries of the more balanced labor market—also argue for a slower pace of inflation. We find that these four variables can explain all of the 2023 pullback in non-housing services inflation excluding the (lagging and idiosyncratic) healthcare and financial services categories—and they argue for further moderation ahead.

  • We are lowering our December 2023 core PCE inflation forecast by two tenths to 3.5% year-on-year, and we are now assuming a sizable slowdown in June for both core CPI (0.24% vs. 0.44% in May, mom sa) and core PCE (0.21% vs. 0.31%). Such an outcome would validate the Fed's plan of slowing the pace of monetary tightening and would further reduce the odds of back-to-back hikes in July and September, in our view.

The Case for Declining Core Inflation

Disinflation appeared to pause during the spring, with year-on-year core PCE inflation stabilizing in a 4.6-4.7% range after falling ¾pp over the previous year (see blue line in Exhibit 1).

Exhibit 1: Core PCE Inflation Stopped Falling in the First Half of the Year, but Underlying Disinflation Has Continued

1. Core PCE Inflation Stopped Falling in the First Half of the Year, but Underlying Disinflation Has Continued. Data available on request.
Source: Department of Commerce, Goldman Sachs Global Investment Research
In contrast, trimmed measures have continued to make gradual progress, and our Core Inflation Tracker—which we developed in 2019 to extract the underlying trend in core inflation—is now consistent with a 3.4% trend pace (see red line in the same exhibit). In this edition of the Analyst, we make the case for renewed declines in core inflation this summer and beyond, based on four drivers: 1) the 9% pullback in used car auction prices that we expect to continue, 2) negative residual seasonality for both CPI and PCE prices in the summer, 3) the sharp deceleration in apartment rent list prices and diminished upward pressure from lease renewals, and 4) significant progress on labor-market rebalancing.

Renewed Declines in Used Car Prices

Used car prices surprised to the upside in the first half of the year, driven by a pullback in vehicle supply caused by fewer lease expirations and rental car fleet dispositions and by yet another bout of supply chain disruptions—this one related to China’s Covid wave and a lull in global microchip production. Looking ahead however, wholesale auction prices—a strong leading indicator of consumer prices—have already fallen 9% peak-to-trough through mid-June (see Exhibit 2).

Exhibit 2: Used Car Auction Prices Have Already Pulled Back Sharply and Will Begin Weighing on Consumer Prices in June

2. Used Car Auction Prices Have Already Pulled Back Sharply and Will Begin Weighing on Consumer Prices in June. Data available on request.
Source: Department of Labor, Manheim, Goldman Sachs Global Investment Research
We believe this pullback largely reflected a return to pre-pandemic auto production over the last two months, itself made possible by a normalization in microchip availability (see left panel of Exhibit 3).[2]

Exhibit 3: Normalized Microchip Supply Has Allowed Car Production to Rise Above Pre-Pandemic Levels, In Turn Boosting Auto Inventories and Bringing Back Dealer Discounts

3. Normalized Microchip Supply Has Allowed Car Production to Rise Above Pre-Pandemic Levels, In Turn Boosting Auto Inventories and Bringing Back Dealer Discounts. Data available on request.
Source: Federal Reserve, Autodata, Goldman Sachs Global Investment Research
Auto industry fundamentals argue for additional declines in used car auction prices in the second half of the year. Both our auto analysts and automaker production schedules expect the recent rebound in vehicle production to be sustained (at 10-11mn annualized), which would contribute to a further rebuild of dealer inventories and a further normalization in discounts on new cars (see dotted line of right panel).
In Exhibit 4, we model month-over-month used car auction prices based on the above variables as well as the ratio of new car prices to used car prices.[3] We find that new vehicle fundamentals explain most of the variation in used car auction prices, with new vehicle inventories, new vehicle incentives, and the new-used price differential particularly important.[4] All three of these factors argue for further declines in used car prices in the back half of the year. As shown in Exhibit 4, our model estimates an 18% peak-to-trough decline in auction prices this year—or roughly double the declines already realized.[5]

Exhibit 4: Supply Chain Normalization and Still-Elevated Used Car Prices Argue for Further Declines in the Second Half of the Year

4. Supply Chain Normalization and Still-Elevated Used Car Prices Argue for Further Declines in the Second Half of the Year. Data available on request.
Source: Manheim, Department of Labor, Goldman Sachs Global Investment Research
Importantly, none of these auction price declines have flowed through to the CPI or PCE measures because of the lag between wholesale and consumer prices. Reflecting these findings, we are lowering our used car inflation forecast by 4pp to -11% year-on-year in December 2023. This assumes 14% downside from current levels and would lower year-on-year core PCE inflation by 0.1pp and core CPI inflation by 0.2pp, relative to the pace in May.

Residual Seasonality Headwinds

The second reason to expect lower inflation this summer is residual seasonality. We believe both the CPI and PCE seasonal factors are spuriously fitting to the post-lockdown price rebounds of mid-2020, for example in autos, hotel lodging, and airfares. In Exhibit 5, we plot the change in the core CPI seasonal factors for 2023 relative to the initial vintages in 2020—the latter of which were estimated prior to the pandemic and are free from the associated distortions. On this basis, the seasonal hurdle for June has become 19 basis points more restrictive. Put another way, the evolution of the June seasonal factor will depress the upcoming core CPI reading by a whopping 0.19pp (mom sa) unless the actual seasonality of prices has evolved as well.

Exhibit 5: The CPI Seasonal Factors Appear to Be Fitting to the Post-Lockdown Price Rebound of Summer 2020; This Argues for Softer Core CPI Readings in June and July

5. The CPI Seasonal Factors Appear to Be Fitting to the Post-Lockdown Price Rebound of Summer 2020; This Argues for Softer Core CPI Readings in June and July. Data available on request.
Source: Department of Labor, Goldman Sachs Global Investment Research
The same analysis argues for a seasonality headwind of as much as 10 basis points in the July reading (reported August 10). We see these as upper bounds for the magnitude of the bias, because the seasonal may have genuinely evolved in a few categories, such as apparel and used cars. Looking ahead to the fall, this exercise cautions that we may see a upwardly biased core CPI readings, with the seasonal hurdle evolving more restrictive by seven basis points on average for the August to December period.
Many of the affected CPI components are also source data for the PCE indices, including autos, hotel lodging, and apparel. And while the BEA does not publish the monthly seasonal factors for PCE prices, the pattern of revisions since 2019 is also consistent with a negative bias from residual seasonality this summer (see Exhibit 6).

Exhibit 6: We Also Expect Residual Seasonality to Weigh on Core PCE Readings This Summer

6. We Also Expect Residual Seasonality to Weigh on Core PCE Readings This Summer. Data available on request.
Source: Department of Commerce, Goldman Sachs Global Investment Research
Taken together, we assume a seasonal headwind of 0.1-0.15pp for core CPI inflation in both June and July (mom sa) and a seasonal headwind of 0.05pp for core PCE inflation each in June, July, and August.[6] Reflecting this and expected weakness in autos, for the month of June we are penciling in a sizeable slowdown for both core CPI (0.24% vs. 0.44% in May) and core PCE (0.21% vs. 0.31% for May).[7]

A Further Gradual Decline in Shelter Inflation

We also continue to expect a further decline in shelter inflation—on both a sequential and year-on-year basis. As shown in Exhibit 7, the most accurate and timely online rent measures have slowed from an eyepopping +20% annualized pace in mid-2021 and a still elevated +9% annualized pace during 2021-2022 to just +1% over the last 8 months.

Exhibit 7: Rent Growth for New Tenants Has Slowed Sharply

7. Rent Growth for New Tenants Has Slowed Sharply. Data available on request.
Source: CoStar, Zillow, Yardi, Goldman Sachs Global Investment Research
As discussed in more detail here, we believe this overstates the softening we should expect in CPI and PCE shelter inflation, because of continued upward pressure on lease renewals for existing tenants. However, it nonetheless validates the stepdown in monthly shelter inflation over the last three months and argues for additional slowing in coming quarters.
And from the perspective of lease renewals, both the Cleveland Fed’s decomposition of the CPI shelter sample and our own analysis combining official data with the alternative measures suggest that over half of the premium on new rental units that developed during the pandemic has closed.

Exhibit 8: Over Half of the Pandemic Rent Gap Between New and Existing Tenants Has Already Closed, Implying Less Upward Pressure on Lease Renewals

8. Over Half of the Pandemic Rent Gap Between New and Existing Tenants Has Already Closed, Implying Less Upward Pressure on Lease Renewals. Data available on request.
Source: Department of Labor, Federal Reserve, Goldman Sachs Global Investment Research
We expect shelter inflation to slow further to a +5% annualized rate by December 2023 (or +0.41% mom sa), down from the peak monthly annualized rate of over 10% (+0.82%) in late 2022.

The Fruits of Labor Market Rebalancing

The final reason to expect lower inflation readings in the back half the year is also the most durable: the significant progress already achieved on labor market rebalancing. As shown in Exhibit 9, the jobs-workers gap—our preferred summary measure of labor market slack—has already declined from the record peak of 6.1mn last spring (3.7% of the labor force) to 4.0mn, based on the official JOLTS job openings measure.

Exhibit 9: The Labor Market Has Cooled Significantly Over the Last Year but Remains Tighter than Normal

9. The Labor Market Has Cooled Significantly Over the Last Year but Remains Tighter than Normal. Data available on request.
Source: Department of Labor
As we explore here, the JOLTS measure is based on a relatively small sample with a low and likely biased response rate. And as shown by the red line in the same exhibit, the jobs-workers gap has fallen considerably further to 2.5mn workers based on online job postings data, which track vacancies across a much larger and probably more representative sample of firms.
Either way, the above represents significant progress toward the 2mn excess jobs we believe is required for wage growth to stabilize at 3.5%-4%—which would in turn allow core inflation to stabilize at 2-2.5% over the medium term (for more details see here, here, here).
This rebalancing has already helped catalyze a significant decline in wage growth. As shown by the blue line in Exhibit 10, the sequential pace of our GS Wage Tracker has fallen by a full point to 4.5-5%. The more timely average hourly earnings wage series is already running at 4%, which is the high-end of the pace required to bring medium-term inflation back into the Fed’s comfort zone. Leading indicators of wage growth also suggest continued progress, including our wage surveys (see here) and wages advertised in online job postings (see green line of the same Exhibit).

Exhibit 10: Wage Growth Has Peaked and Is Approaching Acceptable Levels from the Standpoint of Price Stability

10. Wage Growth Has Peaked and Is Approaching Acceptable Levels from the Standpoint of Price Stability. Data available on request.
Source: Department of Labor, Indeed, Goldman Sachs Global Investment Research
Post-pandemic labor shortages have been particularly severe among lower-paid, lesser skilled positions, exerting upward pressure on wage growth for the bottom half of the income distribution and on inflation for labor-sensitive services categories. Accordingly, and as shown in Exhibit 11, the 2pp pullback in our Low-Wage Wage Tracker is particularly encouraging for the medium-term inflation outlook.

Exhibit 11: Wage Growth Is Falling More Quickly Among Low-Wage Workers

11. Wage Growth Is Falling More Quickly Among Low-Wage Workers. Data available on request.
Source: Department of Commerce, Goldman Sachs Global Investment Research
The normalization of commodity prices and inflation expectations also argue for a slower pace of inflation, other things equal. In Exhibit 12, we plot consumer surveys of long-term inflation expectations and of a composite of 3-year inflation expectations. These measures rose to potentially worrisome levels in 2022 but subsequently normalized.

Exhibit 12: Near-Term Inflation Expectations Have Normalized and Long-Term Inflation Expectations Remain Anchored

12. Near-Term Inflation Expectations Have Normalized and Long-Term Inflation Expectations Remain Anchored. Data available on request.
Source: University of Michigan, Federal Reserve, Goldman Sachs Global Investment Research
What do these developments imply for the inflation outlook? In Exhibit 13, we explore the forecasting power of falling wage growth, job vacancy rates, inflation expectations, and commodity prices for services inflation. We focus on core services categories excluding housing and also healthcare—which exhibits longer lags and pandemic-related idiosyncrasies. We also exclude financial services, which depends in large part on asset prices and is less directly sensitive to the labor market. As shown in Exhibit 13, we find significant forecasting power, with these variables explaining 60% of the variation in quarter-over-quarter price changes (we do not include lags of inflation itself).

Exhibit 13: Labor Market Rebalancing, Lower Commodity Prices, and Lower Inflation Expectations Explain the Recent Pullback in Inflation in Many Services Categories—and Indicate More to Come

13. Labor Market Rebalancing, Lower Commodity Prices, and Lower Inflation Expectations Explain the Recent Pullback in Inflation in Many Services Categories—and Indicate More to Come. Data available on request.
Source: Department of Commerce, Goldman Sachs Global Investment Research
Furthermore, we find that the favorable evolution of these variables can explain all of the net slowing in services inflation across these categories (see the recent pullback in both the solid red and solid blue lines in 2023). Looking ahead, the continued rebalancing of the labor market and the further slowing in wage growth that we expect[8] argue for some additional moderation in the pace of services inflation across these categories (see dotted line).
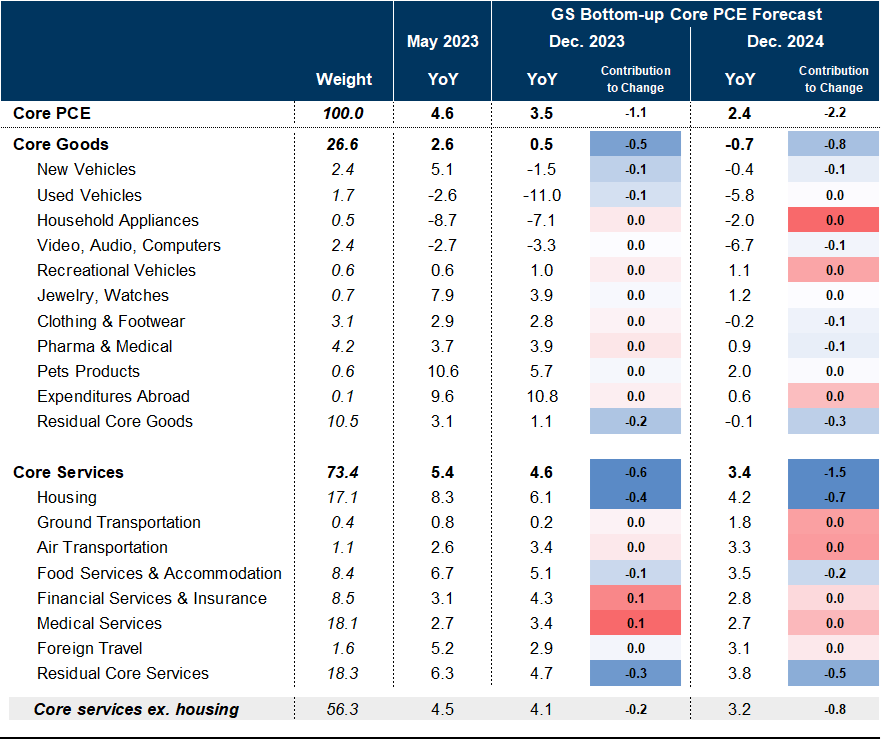
We forecast inflation for the broader “core services ex-housing” segment to fall from 4.5% year-on-year currently to 4.1% in December, a smaller decline than suggested by the previous model because of the relatively firmer outlook in healthcare (for which cost pressures affect prices with a much longer lag) and financial services (due to higher asset prices)— and also because the model has been surprised to the upside on net in recent quarters. Ultimately, while these top-down variables are informative for the inflation outlook, there remains substantial noise and idiosyncrasy in the core inflation statistics. This argues for humility in medium-term forecasting, even when the key drivers are moving in the right direction.

Inflation Outlook and Fed Implications

We are lowering our December 2023 core PCE forecast by two tenths to 3.5% (from 3.7% previously). Our forecast for Q4 as a whole is now two tenths below consensus of 3.8%, despite the pickup we expect in healthcare and financial services. We are leaving our December 2024 forecast unchanged at 2.4% (see Appendix for component-level forecasts). We are also lowering our December 2023 core CPI forecast by three tenths to 3.9% year-on-year, a slightly larger downgrade reflecting the larger weight of used cars in the CPI measure.
From the Fed’s perspective, another 1.1pp decline in core PCE between now and year-end would represent a ~0.3pp downside surprise relative to the projections in the June SEP. We believe such an outcome would further decrease the risk that inflation expectations de-anchor to the upside and would increase the Fed’s conviction that price stability can be reestablished without a recession.
Progress towards disinflation—which we expect to be visible in the June and July CPI and PCE price data—would also validate the Committee’s plan of slowing the pace of monetary tightening and would further reduce the odds of back-to back hikes in July and September, in our view.

Spencer Hill

Appendix

Exhibit 14: Core PCE Forecasts by Component

14. Core PCE Forecasts by Component. Data available on request.
Source: Department of Commerce, Goldman Sachs Global Investment Research

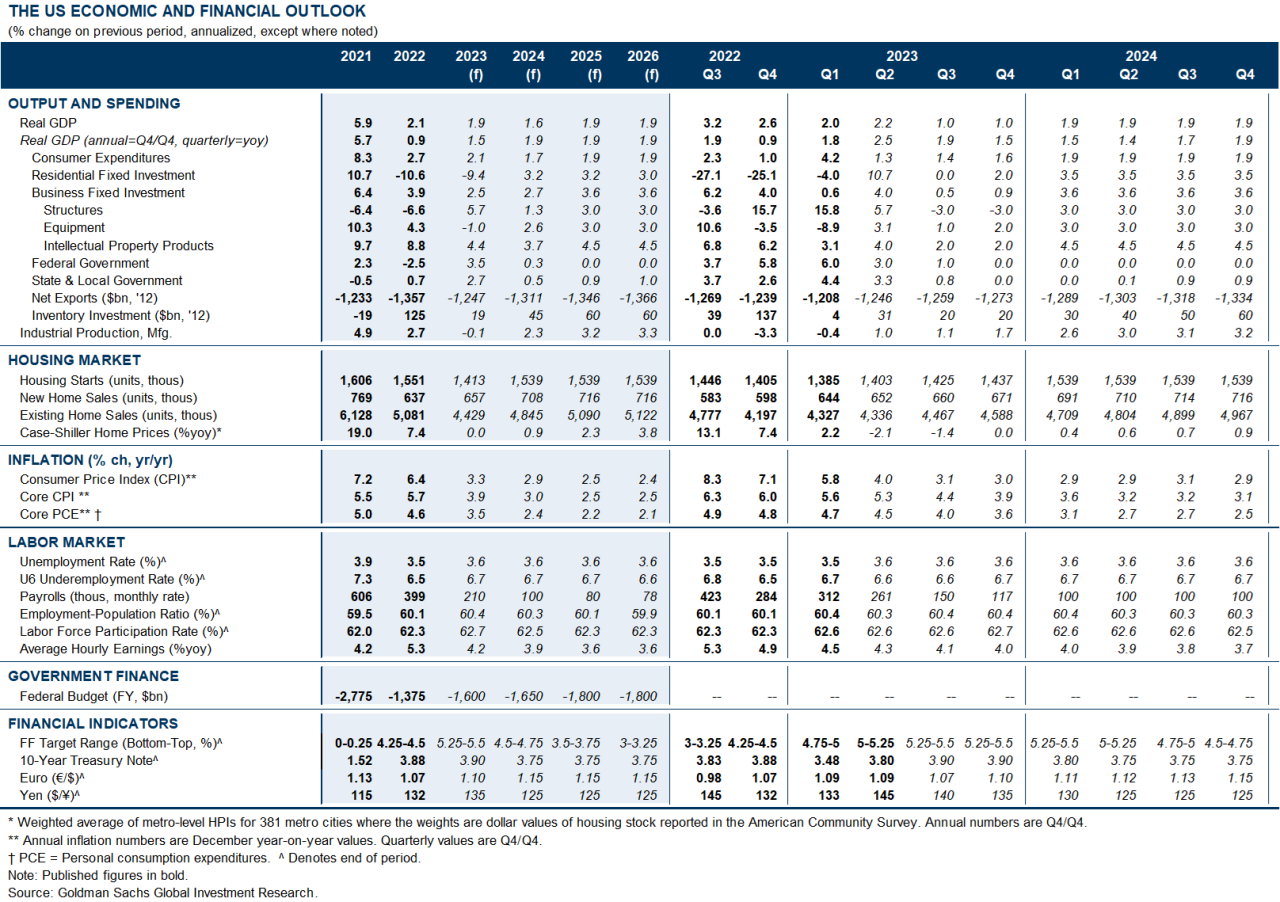
The US Economic and Financial Outlook

Data available on request.
Source: Goldman Sachs Global Investment Research
  1. 1 ^ Uncertainty around the magnitude of the PCE price bias is higher, because the BEA statistics can choose whether or not to use the CPI seasonal factors and because their own seasonal adjustment approach (contemporaneous seasonal adjustment) is relatively more likely to revise away some of the residual seasonality with each subsequent year of data.
  2. 2 ^ The reopening of the Chinese economy also likely contributed.
  3. 3 ^ We model auction prices as opposed to consumer prices, because the former are source data for the latter, and the latter suffer from issues related to changing methodologies and residual seasonality. We exclude lags of auction prices because we are interested forecasting the multi-quarter path based on the information in hand today.
  4. 4 ^ We find a smaller role for new car and used car unit sales (demand).
  5. 5 ^ We also estimate a model that includes the flow of used car supply from expiring leases and rental car company fleet dispositions. This model indicated a more moderate decline in used car auction prices (-12% peak-to-trough in 2023, compared to -18% for our baseline model). However, the coefficient on used car supply is not statistically significant, and we place more weight on the model shown.
  6. 6 ^ Uncertainty around the magnitude of the PCE price bias is higher, because the BEA statisticians can choose whether or not to use the CPI seasonal factors and because their own seasonal adjustment approach (contemporaneous seasonal adjustment) is more likely to revise away some of the residual seasonality with each subsequent year of data.
  7. 7 ^ We will update our estimates in the second week of July to reflect the nowcast information set.
  8. 8 ^ To 4% or slightly below by year-end on a seasonally adjusted sequential basis.

Investors should consider this report as only a single factor in making their investment decision. For Reg AC certification and other important disclosures, see the Disclosure Appendix, or go to www.gs.com/research/hedge.html.