Goldman Sachs Research
US Economics Analyst
The Corporate Debt Maturity Wall: Implications for Capex and Employment (Walker/Mori)
6 August 2023 | 10:46PM EDT | Research | Economics| By Jan Hatzius and others
More
  • The Fed’s tightening cycle has pushed marginal funding costs for businesses sharply higher over the past couple of years, with yields jumping almost 5pp for high yield bonds. If interest rates remain high, companies will need to devote a greater share of their revenue to cover higher interest expense as they refinance their debt at higher rates. We explore the magnitude of this looming increase in interest expense and the potential impact on capital spending and hiring.

  • The path for interest expense depends on future refinancing needs and interest rates. Refinancing needs will remain historically low over the next two years—about 16% of corporate debt will mature over the next two years. The interest rate on refinanced corporate debt will increase substantially because current market rates are roughly 1½pp above the average rate that companies are paying on existing investment grade bonds and 2pp above the average rate on high yield bonds.

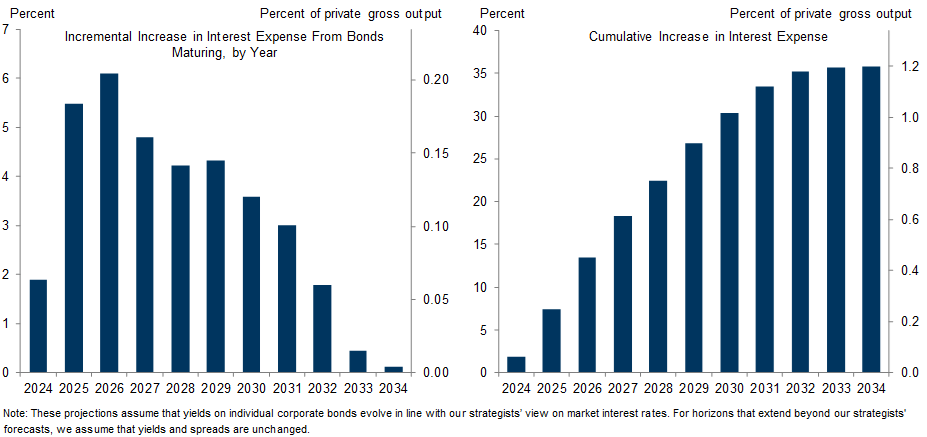
  • We estimate that the average interest rate on the current stock of corporate debt will rise from 4.20% in 2023 to 4.30% in 2024 and 4.50% in 2025, based on our assumptions about the future path of Fed policy and market interest rates. This would imply that private sector interest expense as a share of current private sector gross output will rise from 3.35% in 2023 to 3.40% in 2024 and 3.60% in 2025, an increase of 0.25pp from 2023 to 2025.

  • We find that for each additional dollar of interest expense, firms lower their capital expenditures by 10 cents and labor costs by 20 cents. The increase in interest expense that we estimate would therefore reduce capex growth by 0.10pp in 2024 and 0.25pp in 2025 and labor cost growth by 0.05pp in 2024 and 0.15pp in 2025. Our estimates suggest about half of the reduction in labor costs comes from reduced hiring and half from lower wage growth, implying a 5k drag on monthly payrolls growth in 2024 and a 10k drag in 2025.

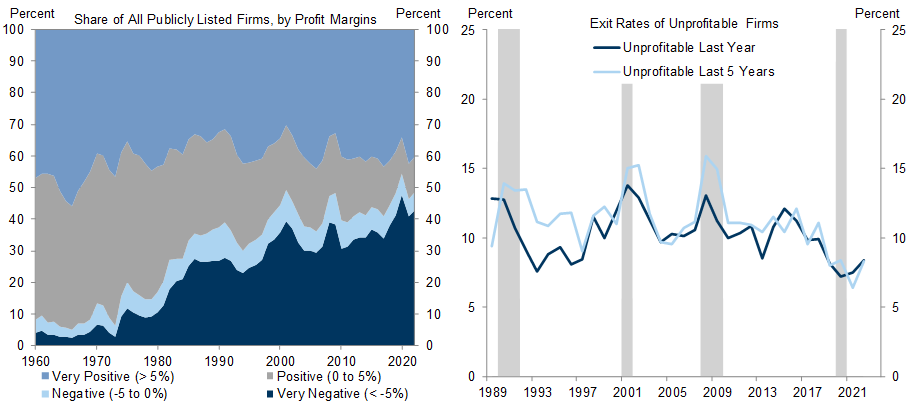
  • We see reasons why the hit from higher interest expense could be either smaller or larger than usual. On one hand, cash balances are historically high, which could help buffer the hit. On the other hand, the number of unprofitable firms has continued to proliferate, as the exit rate of unprofitable firms has declined since the start of the pandemic. In previous research, we have found that unprofitable firms disproportionately cut back on capex and employment when faced with margin pressure.

The Corporate Debt Maturity Wall: Implications for Capex and Employment

The Fed’s tightening cycle has pushed marginal funding costs for businesses sharply higher over the past couple of years, with yields jumping 3½pp for investment grade bonds and 4¾pp for high yield bonds (Exhibit 1). If interest rates remain high, companies will need to devote a greater share of their revenue to cover higher interest expense as they refinance their debt at higher rates. We explore the magnitude of this looming increase in interest expense and the potential impact on capital spending and hiring.

Exhibit 1: Marginal Financing Costs Have Increased Sharply Since the Start of the Fed’s Tightening Cycle

1. Marginal Financing Costs Have Increased Sharply Since the Start of the Fed’s Tightening Cycle. Data available on request.
Source: Bloomberg, Goldman Sachs Global Investment Research
The path for interest expense depends on two factors. First, refinancing needs, which are historically quite low in the near-term. Exhibit 2 shows that the share of corporate bonds maturing within the next two years is at the low end of its 15-year range (16% today vs. 26% in 2007). As we highlighted early last year, the duration of corporate debt has roughly doubled over the last thirty years, slowing the pass-through from funds rate hikes to interest rates paid by firms and to investment spending, and therefore reducing the economy’s near-term sensitivity to the funds rate. This shift towards longer maturities accelerated during the pandemic, with firms refinancing en masse in 2020 and 2021 to take advantage of lower rates.
However, while near-term refinancing needs appear limited, Exhibit 3 shows that the pace of corporate debt maturing picks up sharply from 2024 onward.

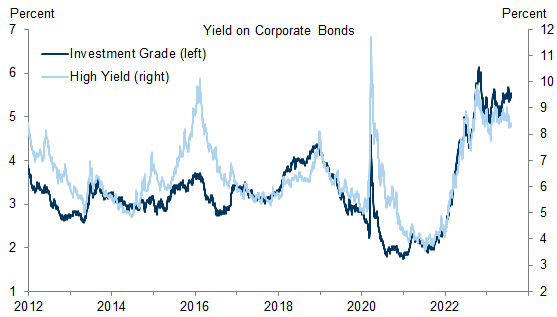
Exhibit 2: Refinancing Needs Have Been Muted So Far Because Companies Issued So Much Debt in 2020 and 2021

2. Refinancing Needs Have Been Muted So Far Because Companies Issued So Much Debt in 2020 and 2021. Data available on request.
Source: Bloomberg, Goldman Sachs Global Investment Research

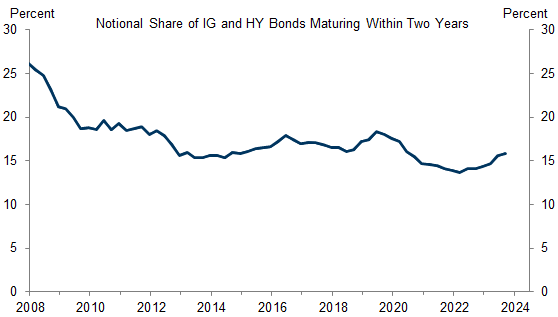
Exhibit 3: $230bn ($525bn Annualized) of Corporate Debt Matures in the Remainder of 2023, $790bn in 2024, and $1,070bn in 2025

3. $230bn ($525bn Annualized) of Corporate Debt Matures in the Remainder of 2023, $790bn in 2024, and $1,070bn in 2025. Data available on request.
Source: Bloomberg, Goldman Sachs Global Investment Research
The second factor is the difference between coupons on new and existing bonds, which is currently substantial. Exhibit 4 shows that current yields are roughly 2pp above coupon rates for the median high yield bond (left), and 1½pp above for the median investment grade bond (right). It is important to note that the increase in the coupon rate would not translate into a proportional increase in interest expense if firms hedge their interest rate exposure. But firms rarely hedge the entirety of their rate exposure, and in many cases, they hedge none of their exposure.

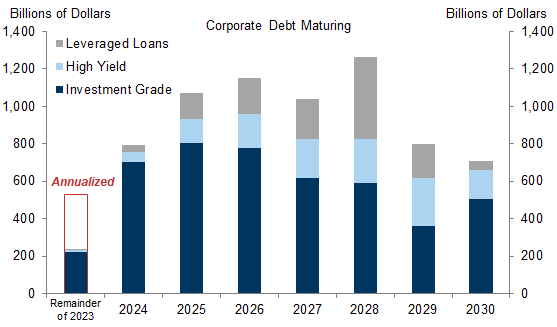
Exhibit 4: The Vast Majority of Outstanding Corporate Debt Was Financed at Rates Well Below Current Market Rates

4. The Vast Majority of Outstanding Corporate Debt Was Financed at Rates Well Below Current Market Rates. Data available on request.
Source: Bloomberg, Goldman Sachs Global Investment Research
Taking those two factors together, we estimate that interest expense is likely to rise only modestly in 2024, but more quickly thereafter as refinancing needs increase. Our strategists expect the long-end of the Treasury yield curve to remain elevated and credit spreads to narrow only modestly over the medium-term. In a scenario where yields on individual corporate bonds evolve in line with our strategists’ view on market interest rates and remain unchanged beyond their forecast horizons, we estimate that refinancing maturing debt would raise the average interest rate on the current stock of corporate debt from 4.20% in 2023 to 4.30% in 2024 and 4.50% in 2025. This would translate to an increase in interest expense for corporates of 2% in 2024 and 5½% in 2025 (or 0.05% and 0.20% of current private sector gross output if economywide interest expense grows at the same rate), as shown in the left panel of Exhibit 5.

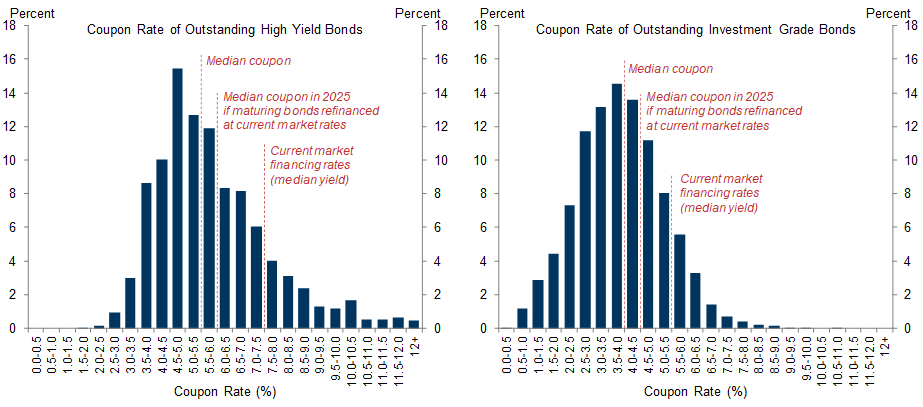
Exhibit 5: We Estimate That Refinancing Maturing Debt Will Boost Interest Expense by 2% in 2024 and 5½% in 2025

5. We Estimate That Refinancing Maturing Debt Will Boost Interest Expense by 2% in 2024 and 5½% in 2025. Data available on request.
Source: Goldman Sachs Global Investment Research

The Spillovers From Higher Interest Expense to Capex and Employment

Using firm-level data on public companies since 1965, we estimate the impact of higher interest expense from refinancing on capital spending and employment. We find that for each additional dollar of interest expense, firms lower their capital expenditures by 10 cents and labor costs by 20 cents, about half of which comes from reduced employment and half of which comes through lower wages.

Exhibit 6: Higher Interest Expense Weighs on Employment and Capex Growth

6. Higher Interest Expense Weighs on Employment and Capex Growth. Data available on request.
Source: Compustat, Goldman Sachs Global Investment Research
Combining the interest expense scenario outlined in Exhibit 5 with the sensitivities in Exhibit 6 suggests that higher interest expense could reduce capex growth by 0.10pp in 2024 and 0.25pp in 2025 and labor cost growth by 0.05pp in 2024 and 0.15pp in 2025 (Exhibit 7). The reduction in labor costs from lower employment growth translates to a roughly 5k drag on monthly payrolls growth in 2024 and a 10k drag in 2025. The combined drag on GDP growth from these channels is likely relatively modest. We estimate they total a less than a 0.05pp drag on annual GDP growth in 2024 and a 0.10pp drag in 2025 (assuming a 0.7 MPC for the reduction in labor costs).
In principle, these impacts are already accounted for in our financial conditions framework. However, the limited refinancing needs since the start of the Fed’s tightening cycle suggest that the impact of higher interest rates on growth is more delayed than the average historical impact that our FCI impulse model projects.

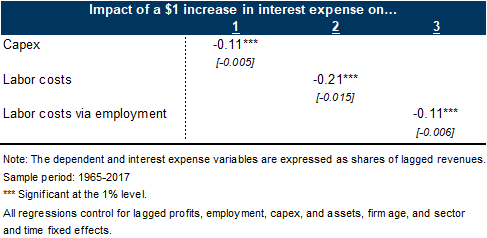
Exhibit 7: We Estimate That Higher Interest Expense Could Reduce Capex Growth by 0.10pp in 2024 and 0.25pp in 2025 and Labor Cost Growth by 0.05pp in 2024 and 0.15pp in 2025

7. We Estimate That Higher Interest Expense Could Reduce Capex Growth by 0.10pp in 2024 and 0.25pp in 2025 and Labor Cost Growth by 0.05pp in 2024 and 0.15pp in 2025. Data available on request.
Source: Goldman Sachs Global Investment Research
We see reasons why the hit to activity from higher interest expense could be either smaller or larger than usual. On one hand, cash balances are historically high (Exhibit 8), and firms could use that cash to either reduce their debt load instead of refinancing or to smooth their capital expenditures and labor costs.[1]

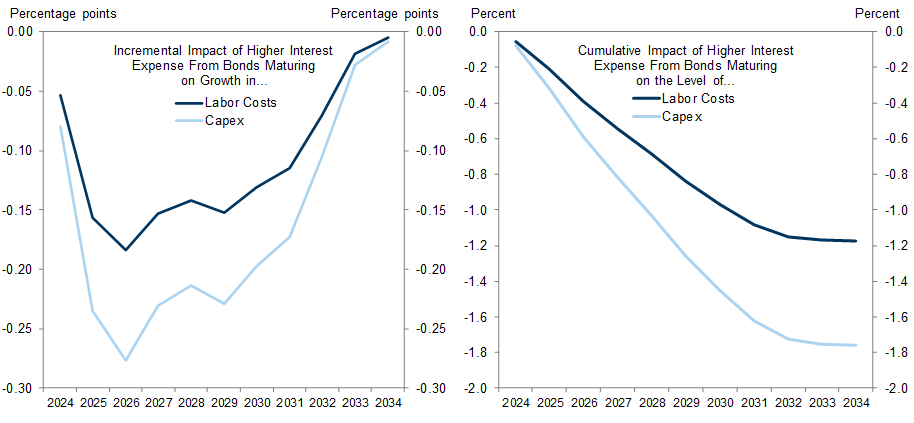
Exhibit 8: Firms Still Have an Elevated Level of Cash On Hand in Aggregate, Which Could Help Buffer a Hit from Higher Interest Expense

8. Firms Still Have an Elevated Level of Cash On Hand in Aggregate, Which Could Help Buffer a Hit from Higher Interest Expense. Data available on request.
Source: Federal Reserve Board, Goldman Sachs Global Investment Research
On the other hand, the number of unprofitable firms has continued to proliferate. In previous research, we found that unprofitable firms disproportionately cut back on employment and capex when faced with margin pressure. The left panel of Exhibit 9 shows that almost 50% of all publicly-listed companies were unprofitable in 2022. Unlike in typical recessions, the right panel of Exhibit 9 shows that the exit rate of unprofitable firms has declined since the start of the pandemic—likely in part due to the generous fiscal support that is no longer being provided—mirroring the economywide decline in bankruptcies.

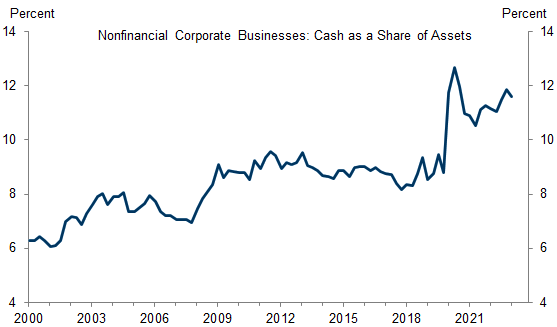
Exhibit 9: The Number of Unprofitable Firms Has Continued to Proliferate as Exit Rates for Unprofitable Firms Have Declined Since the Start of the Pandemic

9. The Number of Unprofitable Firms Has Continued to Proliferate as Exit Rates for Unprofitable Firms Have Declined Since the Start of the Pandemic. Data available on request.
Source: Compustat, Goldman Sachs Global Investment Research

Ronnie Walker

Sienna Mori

We thank Elsie Peng for her extensive contributions to this report.

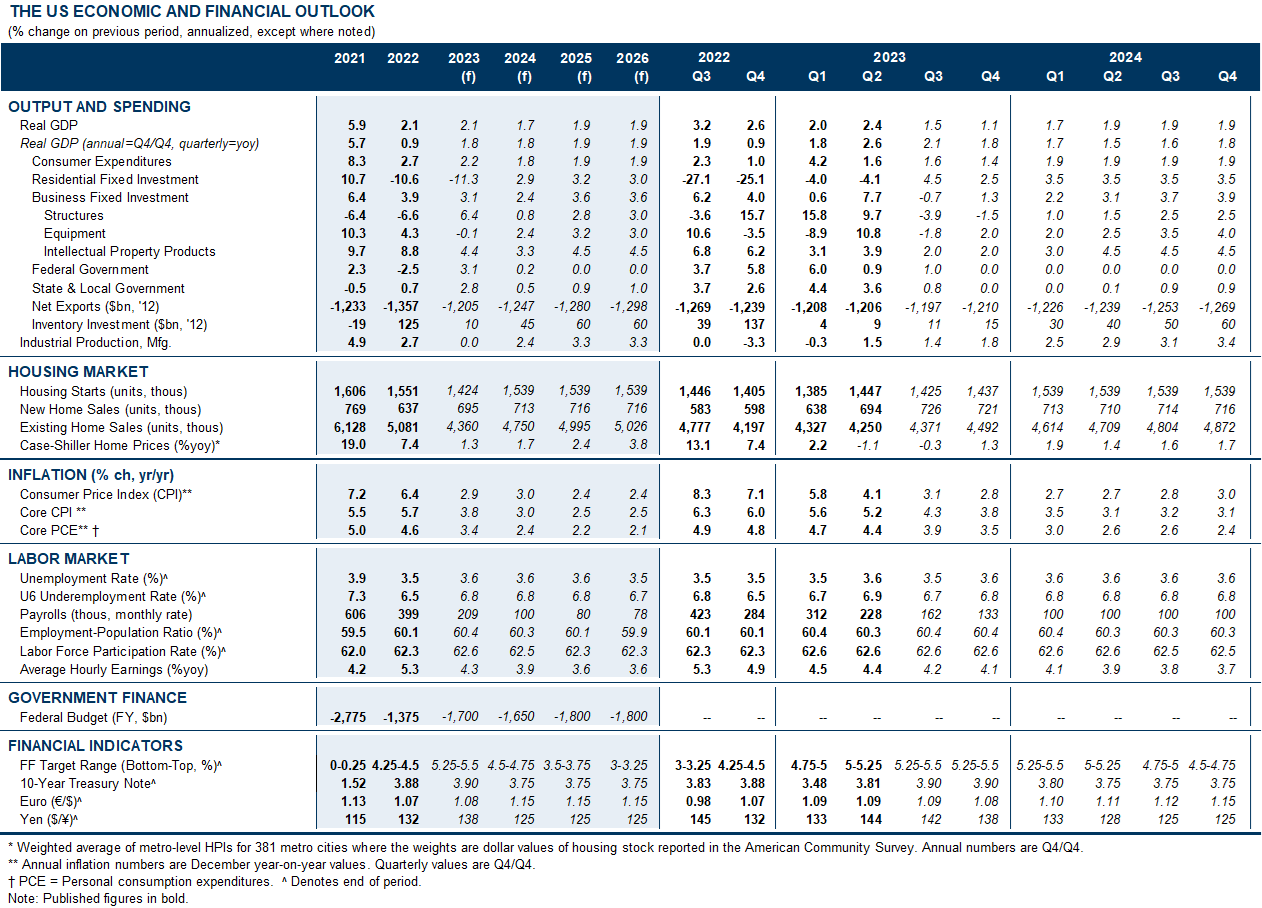
The US Economic and Financial Outlook

Data available on request.
Source: Goldman Sachs Global Investment Research
  1. 1 ^ Our equity strategists have flagged that larger firms tend to have less cash on hand, with cash as a share of assets having roughly returned to pre-pandemic levels for the S&P 500, suggesting that smaller firms have particularly large buffers.

Investors should consider this report as only a single factor in making their investment decision. For Reg AC certification and other important disclosures, see the Disclosure Appendix, or go to www.gs.com/research/hedge.html.