Global Equity Views
Fat & Flat fights back
1. Since the start of 2022 equity markets have gone through several phases dominated by the shifts in inflation and growth expectations. Nonetheless, while growth has held up much better than many investors feared at the start of the year, the relentless rise in interest rates, at a time of stagnant profit growth, has resulted in a broadly Fat & Flat market environment. Equities in overall terms have made little progression at the broad index level but within a wide trading range (Exhibit 1). We have maintained a neutral in equities in our asset allocation while being overweight cash.
Exhibit 1: The rise in interest rates during a period of stagnant profit growth has resulted in a broadly Fat & Flat market environment
USD price performance (indexed to 100 on Jan 2022)
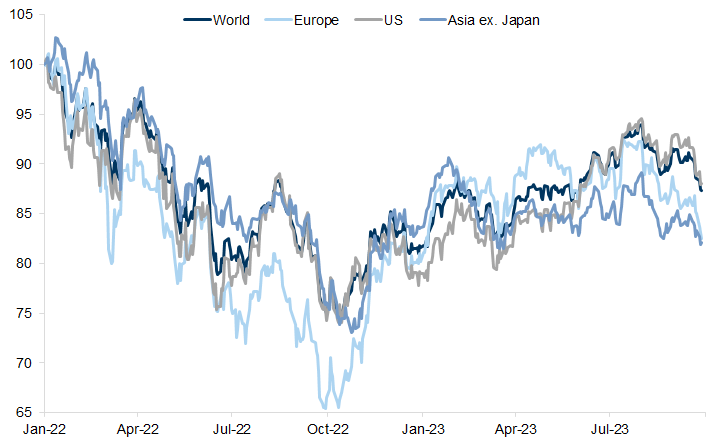
Source: Datastream, Worldscope, Goldman Sachs Global Investment Research
2. Focusing on the equity market during the whole period of rising interest rates, however, masks some important differences in the phases. For much of the first half of 2022 both growth and inflation were deteriorating together (growth was weakening and inflation and rates rising); equity markets fell and long duration equities under performed. Over much of this year fears about recession have gradually faded, at least in the US, and rising confidence that inflation has peaked has supported a reasonable rally from the spring until late summer. Nevertheless, as Exhibit 2 shows, most equity markets remain well below their levels of the start of 2022 in nominal terms and around 20% lower in real terms. Even the large US technology stocks that have enjoyed spectacular returns in 2023 remain below their levels at the start of 2022. The exception has been Japan, supported by low valuations and confidence that the generation of economic stagnation and deflation is finally ending while a revitalised focus on improving shareholder returns is gaining traction. Since the start of this year the US equity market has outperformed (following a brief period of underperformance in 2022) but this has been a function of a very small number of technology companies.
Exhibit 2: Most equity markets remain well below their levels of the start of 2022 in nominal terms and around 20% lower in real terms
Price return since 2022 (local currency, $ for Asia Pacific ex Japan). Largest 15 companies by market cap size
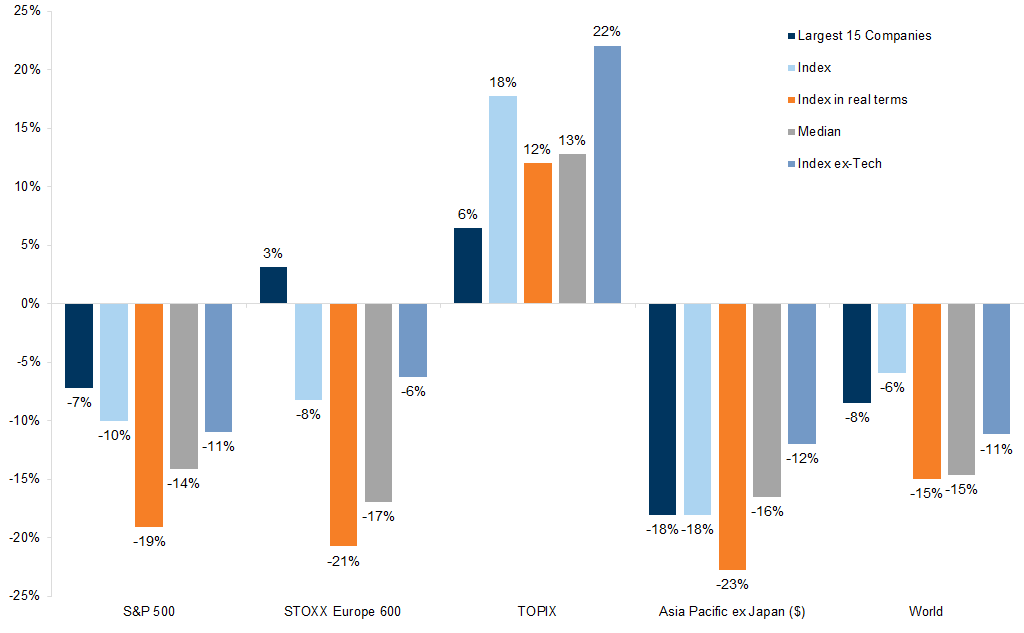
Source: Datastream, Haver Analytics, STOXX, Goldman Sachs Global Investment Research
3. Nevertheless, given the speed of the rise in interest rates from their record trough, the performance of equity markets has been better than in most economic downturns. There are some good reasons for this. First, in the absence of recession, corporate earnings rarely fall (even if, as this year, they are not growing very much) and without profits falling equity markets tend to rise. Second, and related to this, higher inflation has boosted nominal GDP and revenues. Flushed by unusually high savings post pandemic, consumers have been willing to pay higher prices for many goods and services. Corporate margins have held up well and earnings (while largely flat) have held up better than many investors feared at the start of this year. Third, equity risk premia were particularly high for the decade or more after the financial crisis and therefore had room to normalise as the deflationary risks of the post financial crisis era faded while providing some cushion against higher interest rates.
4. Our economists have argued that recessions would be avoided and have remained much more positive than the consensus of economists, particularly for the US. However, since the summer of this year, looking at the performance of cyclical versus defensive companies (Exhibit 3) would imply that markets have increasingly been pricing a soft landing as a central scenario. Earnings momentum has turned softer again, the rise in oil prices is another headwind as would be any temporary shutdown in the US government. Unless there are significant upgrades to earnings expectations, broad index level progression in equities looks likely to stay fairly muted particularly while bond yields continue to rise.
Exhibit 3: The performance of cyclical versus defensive companies would imply that markets have increasingly been pricing a soft landing as a central scenario
MSCI Indices relative price return (USD)
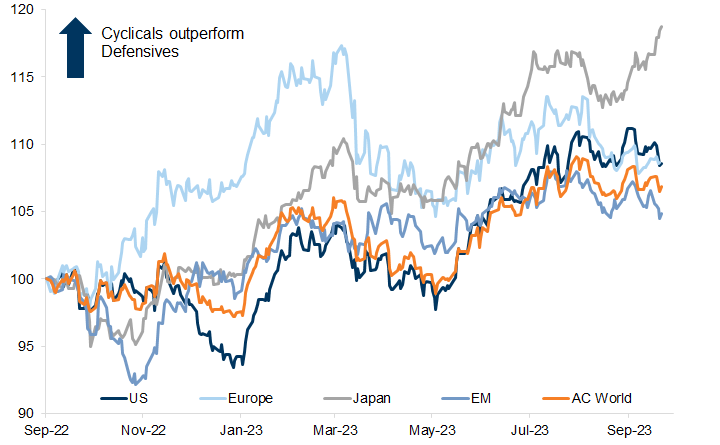
Source: Datastream, Worldscope, Goldman Sachs Global Investment Research
Most recently, the correlation between equity prices and bond yields has turned negative again (Exhibit 4). While higher bond yields (from a very low base) were previously associated with better growth and stronger equity returns, the more recent sharp rises in yields are becoming a headwind for equities as better growth expectations had already been priced in.
Exhibit 4: Equity/bond yields correlation has turned sharply negative once again
3-month correlation of weekly equity returns with changes in yields
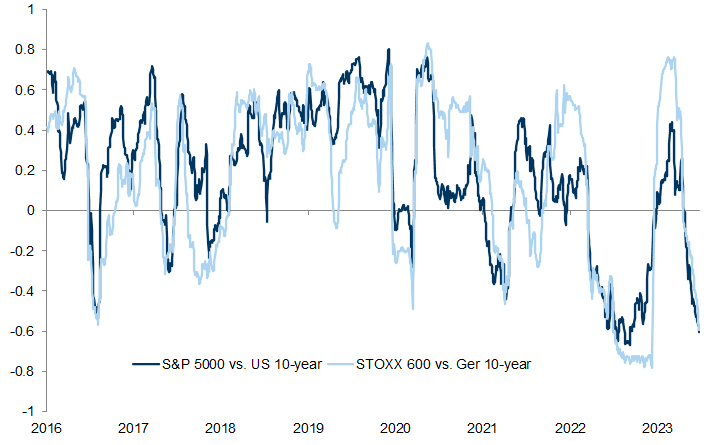
Source: Haver Analytics, Bloomberg, Goldman Sachs Global Investment Research
5. This headwind from rising yields should not be a surprise given that equity risk premia have fallen sharply back to pre pandemic levels, providing much less buffer for equities as rates rise (Exhibit 5). Some argue that this makes sense; if the post-pandemic tail-risk of deflation has now eroded, then equity risk premia should fall as term premia rises. However, while nominal and real bond yields are back to pre financial crisis levels, at least in the US, the PE remains much higher, and earnings growth much lower.
Exhibit 5: Equity risk premia have fallen across regions
Global market implied ERP (%)
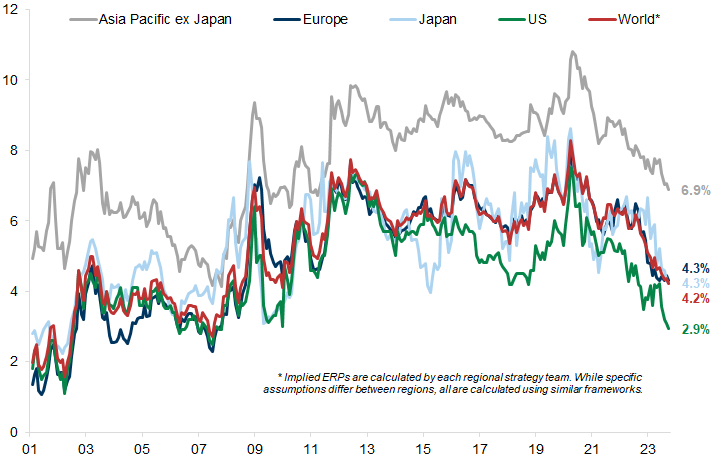
Source: Goldman Sachs Global Investment Research
6. In the absence of much better growth in corporate profits, the significant increase in both nominal and real interest rates create a much higher bar for equities to beat. As Exhibit 6 shows, the rise in US PE ratios this year has, unusually, occurred despite a rapid rise in TIPS yields (the light blue line inverted). At 2.25% a risk free and inflation protected return makes equities look stretched unless there is significant growth.
Exhibit 6: The S&P 500 P/E has moved up despite the increase in yields
S&P 500 12m fwd P/E and US 10y Real Yield (RHS, Inverted)
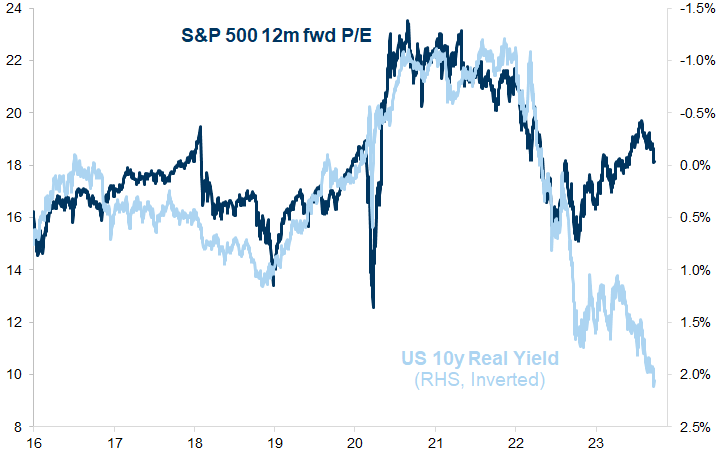
Source: Bloomberg, FactSet, Goldman Sachs Global Investment Research
7. It is the desire to capture growth that has been so supportive of large cap tech stocks this year. They benefit from having high and stable margins and strong balance sheets, making them relatively defensive in the face of higher cost of capital (unlike unprofitable tech which has de-rated as the discount rate has increased) (Exhibit 7).
Exhibit 7: The higher cost of capital has aggressively undermined unprofitable tech's business models and valuations
Unprofitable vs. Profitable Tech. Indexed relative performance
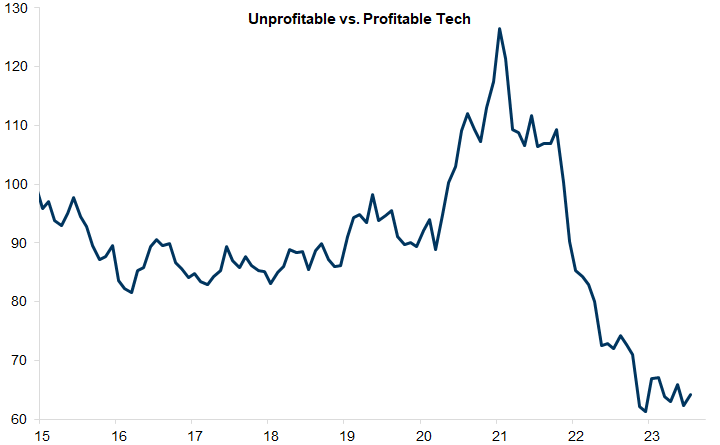
Source: Goldman Sachs Global Investment Research
The strength of the tech sector also reflects excitement about the potential growth boost many of the large cap tech companies in the US could see from AI. The focus on AI has been a critical narrative for equity markets this year as reflected in a surge in mentions of AI in company statements (Exhibit 8).
Exhibit 8: The focus on AI has been a critical narrative for equity markets this year
Mentions of 'AI' during 2Q-23 earnings calls. Average mention per earnings call
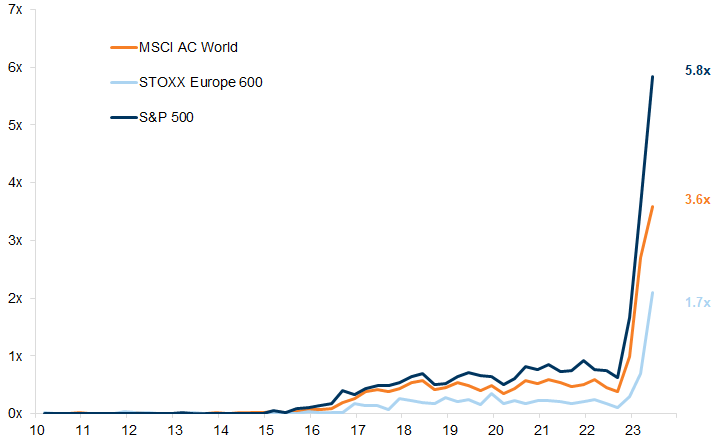
Source: GS Dataworks, Goldman Sachs Global Investment Research
8. So far, most of the re-rating in the technology sector, however, has occurred in the US where a hand full of companies are particularly well-placed to reap the rewards of their AI investments. This has resulted in a very concentrated market return so far this year (Exhibit 9) where much of the re-rating has occurred in a few leading US companies.
Exhibit 9: European Technology is the only Technology sector across regions to not have benefited from multiple-expansion this year
Year-to-date price return disaggregation
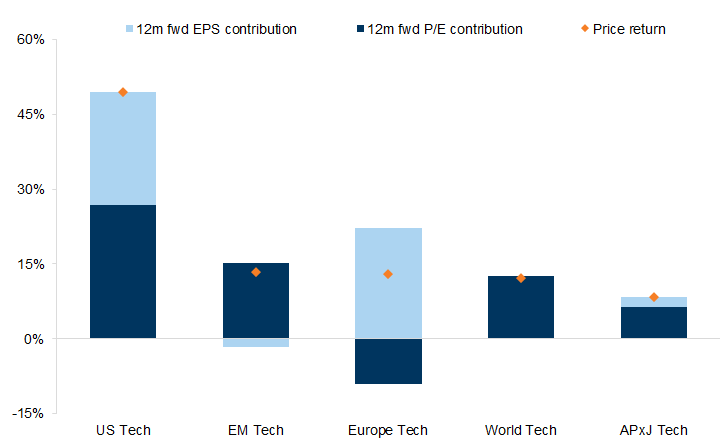
Source: Datastream, Worldscope, Goldman Sachs Global Investment Research
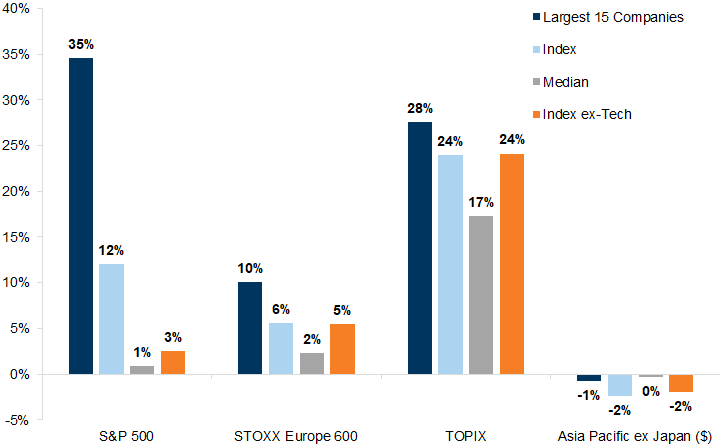
The biggest 15 companies in the US are up over a third this year (and the top 5 by market cap up 39%), but the market ex technology has achieved just 3% and the median stock is up 1% YTD (Exhibit 10). The returns are slightly better in Europe and Japan, and even worse in Asia. All, of course, are particularly disappointing when measured in real terms.
Exhibit 10: Year-to-date, the biggest 15 companies in the S&P are up 35% while the median company is stagnant
YTD price return (local currency, $ for Asia Pacific ex Japan). Largest 15 companies by market cap size
Source: Datastream, STOXX, Goldman Sachs Global Investment Research
9. From a regional perspective our views are relatively neutral. We have the strongest return forecasts in Asia and Japan where our strategists prefer China and Korea as well as Japan. Despite the strong returns to the latter so far this year, our Japan strategy team forecast the Topix will reach 2650 in 12 months, backed by healthy profit growth. In the US the index target remains at 4700 over 12 months, slightly below the returns forecast in Europe where earnings growth has matched that of the SPX but is supported by more attractive valuations. A peak in US interest rates and dollar might also contribute to better returns outside of the US. Our main conclusion, however, is that global investors should be more diversified regionally over coming months and focus more on themes and factors than on geographies.
10. While a soft landing in most economies remains our central view, and EPS growth is likely to rise in 2024, the lagged impact of the rise in the cost of capital is likely to keep strong balance sheet and high and stable margin companies at a premium. We continue to recommend baskets of these across the regions (GSSTMARG vs GSSTHLAB in Europe, GSTHSBAL in the US, and GSSZHMGN vs GSSZLMGN in Asia). A continued focus on quality is also likely to support continued outperformance of technology where we remain overweight in each region. While the leading technology stocks have already enjoyed spectacular returns this year, they remain relatively defensive in the face of higher cost of capital, and we do not think AI is in a bubble.
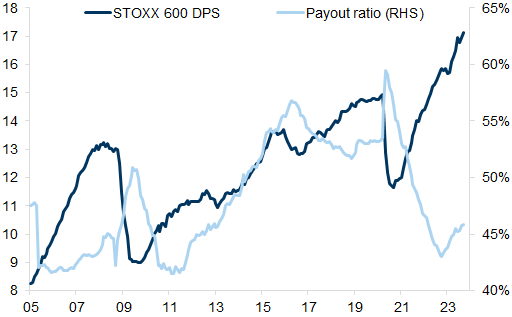
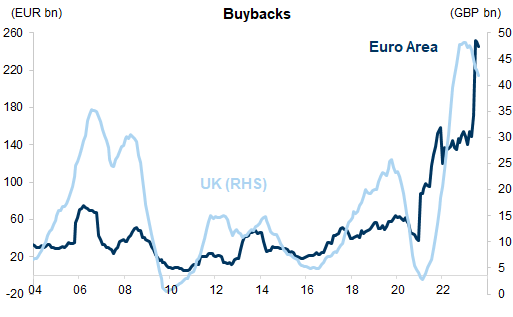
In general, we also like owning a combination of deep value companies or dividend payers. In an environment of flatter index returns the power of compounding growth through dividends (or reinvested cash flows) should become more important. In markets like Europe, dividends are also growing strongly (Exhibit 11), and share buy backs are rising sharply (Exhibit 12). This supports some of the value areas such as energy, resources and banks where very low valuations suggest reasonable risk- adjusted returns.
Exhibit 11: There is also space for higher dividends
12m fwd DPS and payout ratio (%)
Source: Datastream, Goldman Sachs Global Investment Research
Exhibit 12: European companies with access to cash are increasingly buying back their own shares in order to improve valuations
Rolling annual summation in local currency for UK and Euro Area buybacks
Source: Haver Analytics, Goldman Sachs Global Investment Research
Investors should consider this report as only a single factor in making their investment decision. For Reg AC certification and other important disclosures, see the Disclosure Appendix, or go to www.gs.com/research/hedge.html.