Goldman Sachs Research
GOAL Post
Private Markets Investigator: 10 Questions for Multi-Asset Investors
16 October 2023 | 4:57AM BST | Research | Portfolio Strategy| By Cecilia Mariotti and others
More
  1. Is there a performance gap between public and private markets? Yes. But while private markets, especially private equity, have outperformed public markets only marginally post GFC, the performance gap has widened significantly post-Covid and tends to be larger in periods of elevated inflation.

  2. What about a valuation gap? The valuation gap is currently particularly large in Europe. Generally, valuation levels in private equity deals follow the same trajectory as the public stock markets, but disconnects can arise, as has been the case recently.

  3. What could a revival of the IPO market mean for private equity? Private markets activity has been resilient through the shutdown of the IPO market, but historically the two have been closely correlated. A re-opening of capital markets should therefore contribute to a friendlier backdrop for private investments, especially buyouts and growth.

  4. Where is money flowing in private markets? The post-Covid era has seen an unprecedented accumulation of capital across private strategies that have surpassed $13trn AuM. While private equity continues to account for the largest share of AuM, venture capital and private debt posted record growth rates.

  5. With growing focus on carry, how attractive is private credit? We think private credit can navigate a 'higher for longer' rates environment well given that the direct relationship between lenders and borrowers can provide higher flexibility. Private credit also benefits from a floating rates structure (in most cases) and can help reduce duration in a portfolio context.

  6. How is private real estate faring considering the stress in public markets? Private real estate has weathered the public market stress relatively well. While listed real estate has de-rated sharply and trades at attractive valuations, private real estate might still offer opportunities for broader diversification and reliable income streams in multi-asset portfolios, but investors need to accept higher leverage than in public.

  7. Who are the biggest investors in private markets? Portfolio composition varies materially across investor types, but family offices tend to run the largest allocation to private assets, followed by some large, long-term focused institutional investors such as sovereign wealth funds, endowments and pension funds.

  8. Which companies are private investors buying? The sector composition of the private equity universe has historically been fairly balanced and boasts more cash-generative, real economy companies. That said, over the past few years, Tech companies have become one of the preferred targets, not only in the US but also in Europe.

  9. Is AI driving another strong Tech wave in private equity activity? Yes. The number of global private equity deals in AI has kept up with H1 last year (which was the second-best year after the record 2021) and the total value of AI-related deals has fallen by much less than the aggregate across sectors.

  10. Is there a case for an increase in cross-border transactions given the US vs. RoW valuation gap? Yes. Private markets investments generally show a strong domestic bias, especially for investors based in developed markets. That said, a rebound in M&A activity could support more cross-border transactions as non-US assets trade at historical discounts to the US.

Private Markets Investigator: 10 Questions for Multi-Asset Investors

(1) Is there a performance gap between public and private markets?

Private markets, especially private equity (PE), have outperformed public markets post GFC (after fees), though by relatively small margins (Exhibit 1): we find that over a 10-year horizon US PE has outperformed the S&P 500 by only 3% annualized (5% over 20 years). The limited outperformance of PE in the post-GFC decade has been mostly due to public equities being particularly strong rather than PE being weak: rising valuations in public markets have contributed to narrowing the historical performance gap relative to private. The performance gap between private and public markets has widened significantly post-Covid, but there are signs of that narrowing again.

Exhibit 1: Private markets, especially PE, have outperformed public markets since 2020

Annualized performance. Last data point is 2023Q2. Dashed bars indicate private assets.
1. Private markets, especially PE, have outperformed public markets since 2020. Data available on request.
Last 2 quarters of available data might be subject to revisions
Source: Preqin, Bloomberg, Goldman Sachs Global Investment Research
The shift to a higher inflation regime has contributed to the outperformance of private equity relative to public. Data since the 1980s show that private equity outperforms public in most macro scenarios, but the gap grows larger in high inflation environments (Exhibit 2). A higher level of inflation is associated with an increase in interest rates as Central Bank policy turns more restrictive, which generally leads to valuation de-rating in public markets. However, PE managers are not forced to mark down their assets, especially if margins for their portfolio companies remain resilient, for example against a strong growth backdrop. Plus, private companies often benefit from higher refinancing and operational flexibility. From high levels of inflation, the performance gap is even larger as inflation falls, and this is the backdrop we continue to expect over the coming months.

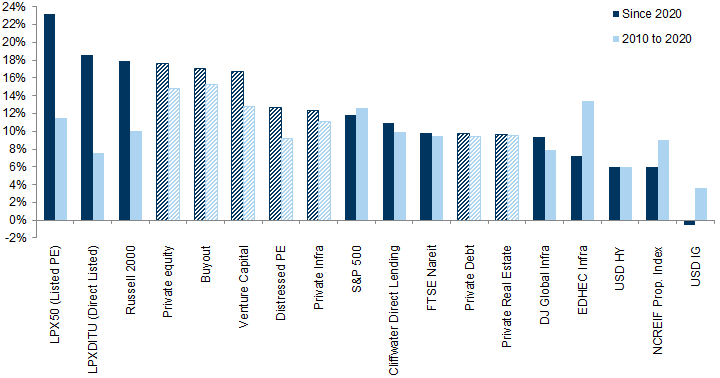
Exhibit 2: The private vs. public equity performance gap tends to be larger when inflation is high

Average nominal yoy total returns since 1985
2. The private vs. public equity performance gap tends to be larger when inflation is high. Data available on request.
Source: Cambridge Associates, Preqin, Datastream, Goldman Sachs Global Investment Research
That said, it is difficult to correctly benchmark private investments to public ones as risks for the former can be significantly underestimated owing to lower reporting frequency. Moreover, manager selection, survivorship bias and market timing can be more important in private markets, which means that aggregate figures are likely to hide large performance dispersion. At the same time, there is evidence of the outperformance of private markets being rooted in their business models and the more direct influence asset managers can have on their portfolio companies/assets.
For similar reasons, a performance comparison between private markets and listed proxies is also imperfect. Tracking annual private equity performance more closely shows that it has generally posted positive annual returns through cycles, with 2022 the first year to report negative returns since the GFC. Comparing private equity performance with listed private equity (as captured by the LPX50 index) and global listed equities shows that the performance gap can be large for both (Exhibit 3). Listed private equity tends to be more correlated to MSCI World than to private equity. One key feature of private equity is that it tends to outperform relative to public equities in downturns – this was the case during the GFC and the 2018 drawdown. Besides the fact that PE performance does not need to be marked to market, the resilience of PEs in periods of crisis can also be partly explained by private equity funds potentially being able to maintain better credit access.
Broadening out to the different asset classes, going into this year the gap between private and public markets was particularly large in real estate and infrastructure – as of 2023Q1, private real estate and infrastructure had outperformed their listed counterparts by more than 20% according to data from Preqin (Exhibit 4). While this was likely mostly driven by private managers not marking to market their portfolio assets and the gap has already narrowed significantly in 2023Q2, it is also the case that listed REITs and infrastructure are naturally exposed to equity market swings which, compared with private, tend to reduce their relation to the price of the underlying assets.
At the current discounted valuations and with peak rates likely in sight, both real estate and infrastructure have become more attractive in the public space. However, private markets could still provide investors access to high-quality and diversified assets that would not be available otherwise, also considering that non-listed investment funds are among the largest property owners. In particular, private markets could offer more direct exposure to structural trends we like, such as demographic, sustainability and technological developments.

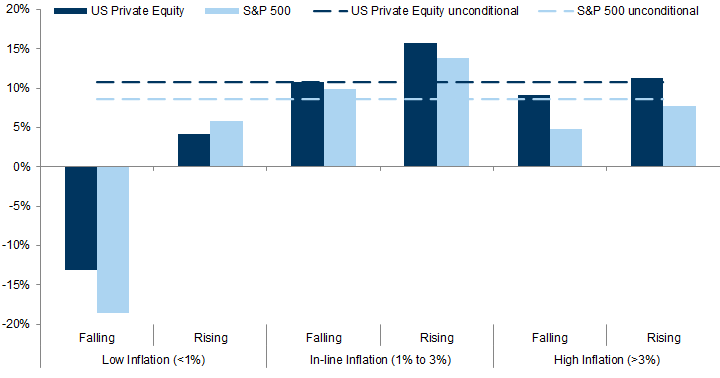
Exhibit 3: After the GFC, 2022 was the first year to record negative global private equity returns

Annual total returns
3. After the GFC, 2022 was the first year to record negative global private equity returns. Data available on request.
Source: Preqin, Goldman Sachs Global Investment Research

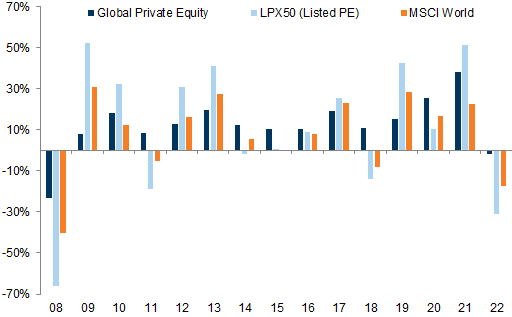
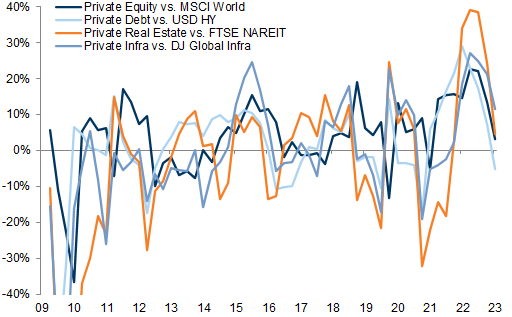
Exhibit 4: The private/public performance gap had grown particularly large in Real Estate and Infrastructure into the start of the year

Data as of 2023Q2
4. The private/public performance gap had grown particularly large in Real Estate and Infrastructure into the start of the year. Data available on request.
Source: Preqin, Bloomberg, Goldman Sachs Global Investment Research

(2) What about a valuation gap?

Generally, valuation levels in private equity deals broadly follow the same trajectory as the public stock markets. For example, similarly to public equity, buyout valuations have been on a rising trend in the post-GFC era, boosted by easy monetary policy, an abundance of capital and rising asset prices.
That said, meaningful disconnects between public and private can arise. This is mostly due to private markets lagging sharp sentiment shifts in public markets, as well as to investors being willing to pay a liquidity premium for public assets. On average, public equity valuations have exceeded private markets in the US over the past 20 years, but there have been some notable exceptions: the run-up to the GFC, the rebound from the GFC and 2021 (Exhibit 5). Gaps tend to widen in downturns as private equity valuations generally experience sharp multiples contractions, but recover quickly over the following 3 or 4 quarters. After the AI boost to S&P 500 valuations, public markets seem to have turned more expensive again than private based on a 12-month forward EV/EBITDA basis.
Private deal multiples are very similar in Europe and the US. Median multiples for European buyouts have been much higher than for the STOXX 600 (Exhibit 6), making the large valuation gap between US and European equities a public-market-specific feature. The private/public valuation gap in Europe has never been as high as in the post-Covid period – this can be explained by the higher exposure to tech in the private space in Europe, a trend that has extended recently (see Question 8 for more details). Private markets valuations are resetting below the surface – private equity deals in 2023Q3 have had much lower multiples so far in the US and the same is true for Europe through the first quarter of the year and this could eventually result in a healthier average valuation.

Exhibit 5: With the rebound in valuations, public markets trade at higher multiples vs. private in the US

Data as 2023Q3. Median EV/EBITDA
5. With the rebound in valuations, public markets trade at higher multiples vs. private in the US. Data available on request.
Private Equity deals include buyout, add-on and growth capital. Last data point for private multiples reflect 5 deals closed in 2023Q3
Source: Preqin, FactSet, Goldman Sachs Global Investment Research

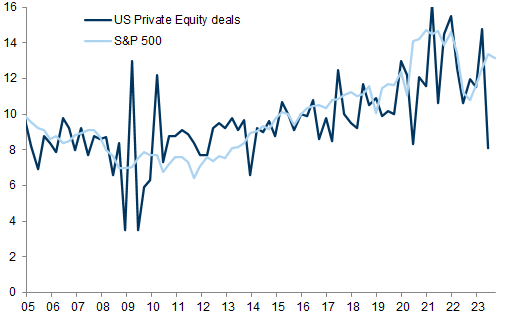
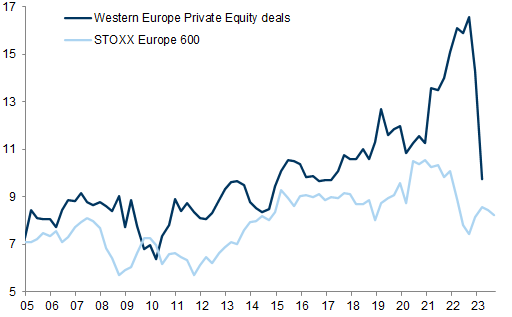
Exhibit 6: The private/public valuation gap is structurally larger in Europe

Data as 2023Q2 for private, Q3 for public. Median EV/EBITDA (4-quarter average)
6. The private/public valuation gap is structurally larger in Europe. Data available on request.
Private Equity deals include buyout, add-on and growth capital. Last data point for private multiples reflect 3 deals closed in 2023Q2
Source: Preqin, FactSet, Goldman Sachs Global Investment Research

(3) What could a revival of the IPO market mean for private equity?

For most of the past 20 years, total capital raised through private equity deals has been closely correlated to IPO activity, but has outpaced it both in the US and in Europe. That said, the gap has never been as wide as it was in 2022: while IPO activity collapsed to record lows in the US, private equity activity held up better (Exhibit 7). Europe reveals a similar, albeit somewhat less extreme, picture (Exhibit 8).
The number of private equity deals has risen steadily since the GFC, likely supported by cheap financing (which made it easier to take leverage) and reached record highs in 2021, a record year also for deal size. The trajectory of deal size has been less stable through time – for example, in the couple of years preceding the GFC there were fewer, but larger deals.

Exhibit 7: In 2022, IPO activity collapsed in the US, while buyout deals held up better

2023 YTD (as of Sep-23)
7. In 2022, IPO activity collapsed in the US, while buyout deals held up better. Data available on request.
Source: Preqin, Bloomberg, Goldman Sachs Global Investment Research

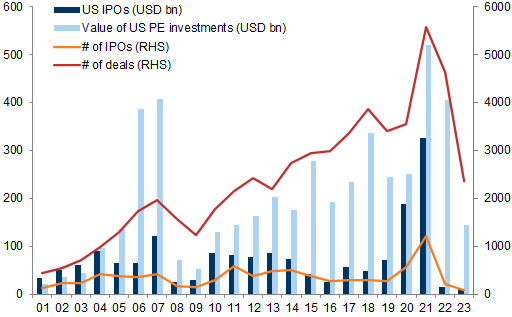
Exhibit 8: The gap was large also in Europe

2023 YTD (as of Sep-23)
8. The gap was large also in Europe. Data available on request.
Source: Preqin , Bloomberg, Goldman Sachs Global Investment Research
The number of private equity deals in 2023H1 was still above the post-GFC average, but deal volumes have been on a falling trajectory last year and more sharply YTD. The deceleration in buyouts and growth deals in the US was especially sharp last year, with investment volumes down more than 1/3 from the 2021 peak and value of deals halving (Exhibit 9). The weakness in growth deals is not surprising: a depressed IPO market made the preferred exit opportunity for these funds less viable, and rising rates weighed on valuations. A more challenging macroeconomic backdrop and the upward trend in global interest rates has coincided with a significant change in the most popular deal types, with a baton pass from buyout deals to add-ons (Exhibit 10). The former tend to be larger and often require taking a significant amount of leverage, while the latter involve purchasing a smaller company to be integrated into the existing business of the portfolio company.
While last year's environment has been challenging for broad private equity activity, it has been somewhat more supportive for take-private deals, which, contrary to the trend seen across the other investment alternatives, were still growing in 2022. An increase in public to private deals is typical of periods of weak IPO activity, as was the case during the GFC and in 2016. Despite representing a very small portion of total deal volumes, public to private deals are typically quite large and have grown larger – the share of reported deals above $1bn increased last year, suggesting the private equity space has added bigger, more mature companies to its menu.
We think the combination of recent signs of normalization in the IPO backdrop, a stronger environment for M&A (especially in Europe), a valuation re-set and a stabilization in interest rates could contribute to a friendlier backdrop for private investments going forward and should gradually support deal activity next year.

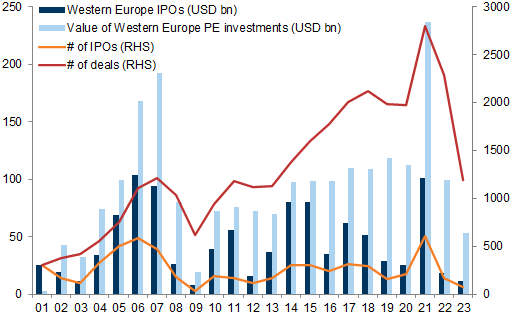
Exhibit 9: There has been a sharp deceleration in private equity activity

%yoy change in deal value across the US and Developed Europe. Last data point is 2023YTD
9. There has been a sharp deceleration in private equity activity. Data available on request.
Source: Preqin, Goldman Sachs Global Investment Research

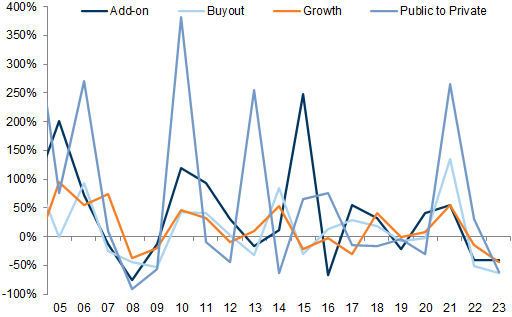
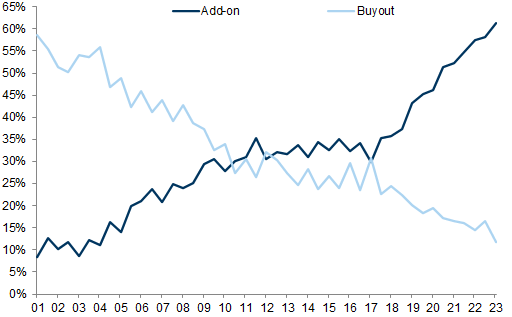
Exhibit 10: Add-ons have become the most popular investment option and higher rates have likely exacerbated the trend

Share of total deal volume
10. Add-ons have become the most popular investment option and higher rates have likely exacerbated the trend. Data available on request.
Source: Preqin, Goldman Sachs Global Investment Research

(4) Where is money flowing in private markets?

The post-Covid era has seen an unprecedented accumulation of capital in private markets - they have a record of around $4trn in dry powder (Exhibit 11) and more than $13trn in AuM. As a result, even though the accumulation of dry powder is slowing on a yoy basis and as a % of AuM, in absolute terms the amount of capital to be deployed is at historical highs across both assets and regions. In particular, Europe first and Asia more recently have seen a significant increase in dry powder (Exhibit 12).
While private equity strategies continue to represent the largest share of AuM (ca. 60%), venture capital has seen the largest increase in dry powder both over the past 5 years and in 2022. Since 2020, private debt has posted the second-largest growth rate in terms of dry powder.

Exhibit 11: The private market complex ended 2022 with a record of around $4trn in dry powder

Dry powder by asset class, USD trn
11. The private market complex ended 2022 with a record of around $4trn in dry powder. Data available on request.
Excludes funds of funds and secondaries
Source: Preqin, Goldman Sachs Global Investment Research

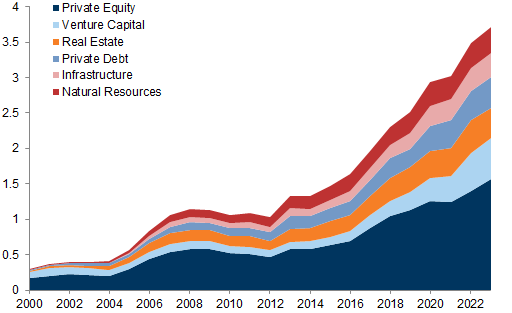
Exhibit 12: Europe first and Asia more recently have seen a significant increase in dry powder

Dry powder (by private capital location), USD bn
12. Europe first and Asia more recently have seen a significant increase in dry powder. Data available on request.
Excludes funds of fund and secondaries
Source: Preqin, Goldman Sachs Global Investment Research
As the build-up of dry powder has peaked, fundraising has slowed down: flows into private market funds in aggregate are down around 45% YTD from the 2021 highs to some $1.4trn (Exhibit 13). Infrastructure and private equity secondaries were virtually the only pockets of the market to show an increase in fundraising last year. Still, in absolute terms 2022 was the second-best year since the 2000.
Given that 2021 levels were exceptionally high and that the large public-private performance gap meant that allocation to private markets increased relative to public market, some degree of normalization in fundraising was to be expected. Nevertheless, the recent slowdown is in contrast to the trend of the post-GFC era, which has seen fundraising growing steadily on a yoy basis. Fundraising momentum, which tends to be correlated to macro momentum, has also slowed down, but the average percentage of funds reaching fundraising targets at final close is still elevated (Exhibit 14). This suggests funds take longer to reach their target close, although they still manage to do so.
While the fundraising landscape is likely to continue to be challenged near term, especially in private equity, our asset manager analysts think structurally the 'private market super cycle' has room to continue. Among other factors, fundraising still represents a very small portion of publicly traded assets and surveys indicate that investors' appetite is set to broaden out in the space.

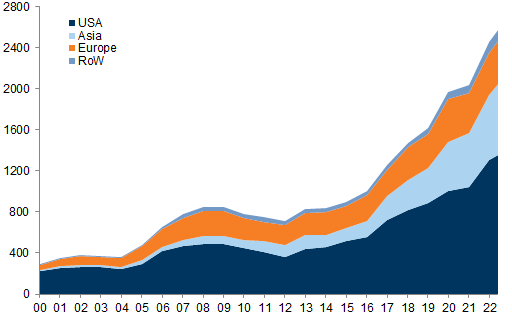
Exhibit 13: YTD flows into private market funds are down more than 40% vs. the 2021 highs

Fundraising per year, USD bn
13. YTD flows into private market funds are down more than 40% vs. the 2021 highs. Data available on request.
Source: Preqin, Goldman Sachs Global Investment Research

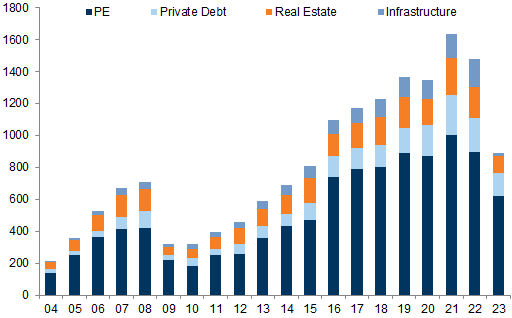
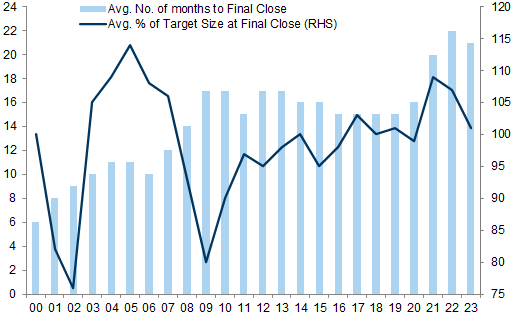
Exhibit 14: It takes longer for private equity funds to reach fundraising targets, but they still manage to do so

14. It takes longer for private equity funds to reach fundraising targets, but they still manage to do so. Data available on request.
Source: Preqin, Goldman Sachs Global Investment Research

(5) With growing focus on carry, how attractive is private credit?

Private debt AuM has increased more than 12% annualized since Covid (Exhibit 15), but remains relatively small in the private landscape, with potential to grow further as investors' increasing appetite for carry more broadly can act as a tailwind. Private credit financing tends to be more popular in crisis periods when access to other sources of financing becomes more difficult. As a testament to that, since the second half of 2021, an increasing share of LBOs deals has been funded by private credit rather than syndicated loans.

Exhibit 15: Private debt AuM has picked up post Covid

Private Debt AuM ($tn)
15. Private debt AuM has picked up post Covid. Data available on request.
Source: Preqin, Goldman Sachs Global Investment Research
The robust appetite for private debt financing could come as a surprise given the rise in rates – the private debt market has seen significant yield compression vs. public counterparts. However, historical performance does suggest that private debt generally outperforms vs. public credit in a rising rate environment (Exhibit 16). We think this is largely a function of the higher flexibility of private debt given that the relationship between lenders and borrowers tends to be much more direct than for syndicate loans. This typically results in financing structures that are simpler, easier to adjust and carry lower duration overall – a large portion of private loans have floating rates, and they are generally re-negotiated on a short-term basis. Moreover, in periods of tightening credit conditions, private vehicles might in practice be the only viable financing option.
That said, the floating structure might also contribute to higher pressure on private debt issuers if rates remain higher for longer, especially considering illiquidity risks and lack of transparency. This could result in an increase in defaults, especially if the macro picture deteriorates. However, as our credit team has highlighted, a default cycle doesn't necessarily have to be worse than in the public credit space as tighter due diligence and the frequent presence of more severe covenants in contracts can help mitigate balance sheet stress. Also, private credit broadly might be less risky than it used to be – the share of US distressed and special situation debt (i.e., the riskiest credit pocket) in private credit ended 2022 below the average since the GFC and data suggest it has decreased further since then (Exhibit 17). Finally, private credit might prove more resilient than private equity in a downturn given private credit managers could still count on their seniority in the capital structure.

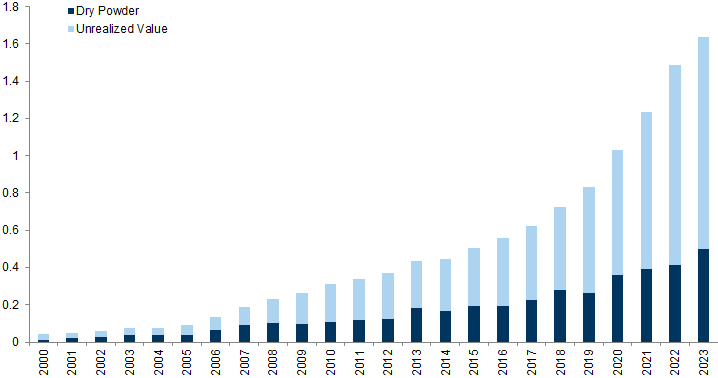
Exhibit 16: Private credit can outperform in a rising rate environment

Average annual returns. Data since 2000 (at quarterly frequency)
16. Private credit can outperform in a rising rate environment. Data available on request.
Source: Preqin, Bloomberg, Goldman Sachs Global Investment Research

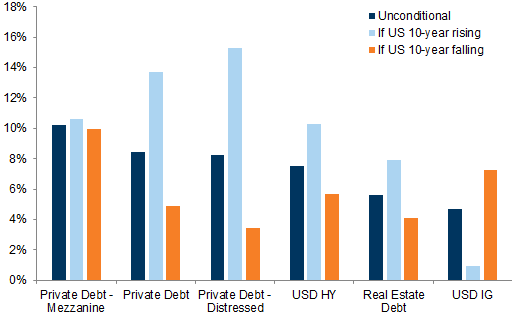
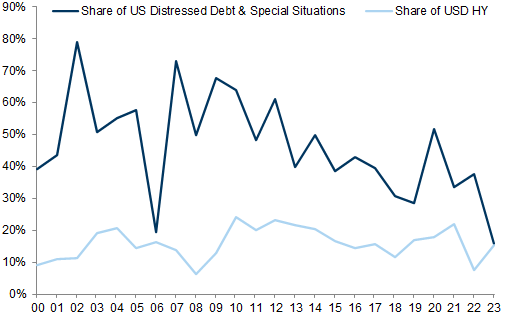
Exhibit 17: The share of US distressed and special situation debt in private is well below the average since the GFC

Share of total private debt and of USD HY + USD IG, respectively
17. The share of US distressed and special situation debt in private is well below the average since the GFC. Data available on request.
Source: Preqin, Goldman Sachs Global Investment Research

(6) How is private real estate faring considering the stress in public markets?

Private real estate is another area that has expanded robustly over the past 5 years with an annualized AuM growth of about 11%. The asset class has also weathered the pressure on the public side well, posting 13% returns last year and flat returns YTD.
While listed real estate has materially de-rated and looks cheap especially against a potential stabilization in rates, as we have discussed in previous research, private real estate might still offer opportunities for diversification and reliable income streams in multi-asset portfolios. However, this likely comes alongside more complexity as investors need to gain an understanding of both micro and macro drivers. The growth/inflation mix, regional exposures and property-specific features tend to be particularly important considerations in real estate investment selection. The private space typically offers more breadth, especially when it comes to the property types it gives access to, but investors need to accept higher leverage.
At a regional level, private real estate is largely concentrated in the US, similarly to public REITs (Exhibit 18): 65% of private real estate deal value since 2000 has been realized in the US, with EMs including China representing a very small share of the market. The share increases to 70% when looking at the number of closed deals. However, investors can find a larger opportunity set in both the UK and Europe when turning to the private space.

Exhibit 18: Both private and listed real estate are heavily concentrated in the US

Data since 2000
18. Both private and listed real estate are heavily concentrated in the US. Data available on request.
Source: Preqin, Worldscope, Datastream, Goldman Sachs Global Investment Research
While the regional split of private real estate investors has been relatively stable through time, portfolios have undergone changes when it comes to the types of properties and their sizes. In particular, the share of deals involving smaller properties has increased since the GFC, suggesting the opportunity set for smaller investments has increased, which could in turn make the asset class more accessible and contribute to an expansion of the investor base. Consistent with that, the median deal size has also been on a downward trend since the GFC (Exhibit 19).
The Covid crisis represented a pivotal moment for allocation to different property types. Deals in residential and industrial real estate have picked up since then, while appetite for office space – which used to be the largest sub-asset class – and retail space has unsurprisingly cooled down (Exhibit 20). According to our real estate team, the outlook for offices continues to be challenging and that could represent a source of stress for the broader asset class, similarly to public markets. That said, pockets of the market such as residential real estate tend to be less cyclical, benefit from more resilient cashflow and less price volatility as the macroeconomic backdrop stabilizes. One interesting trend has been the increased focus on 'niche' properties, which comprise a wide range of assets such as self-storage, senior houses and student accommodation. Selective opportunities in the space look especially attractive to gain exposure to structural demographic trends, for example against the prospect of an aging population.

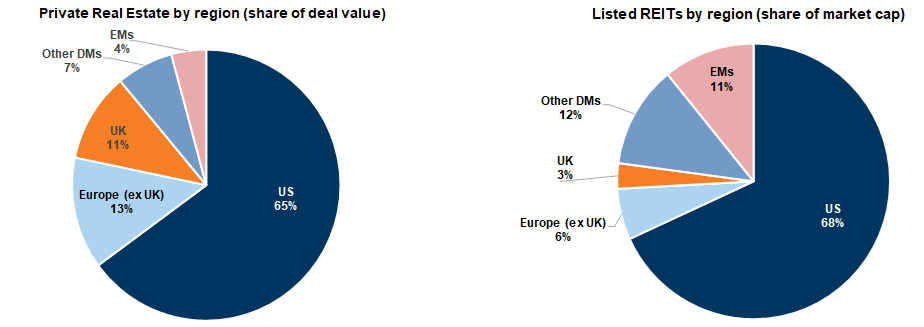
Exhibit 19: The share of deals on smaller properties has increased post-GFC

Number of deals
19. The share of deals on smaller properties has increased post-GFC. Data available on request.
Source: Preqin, Goldman Sachs Global Investment Research

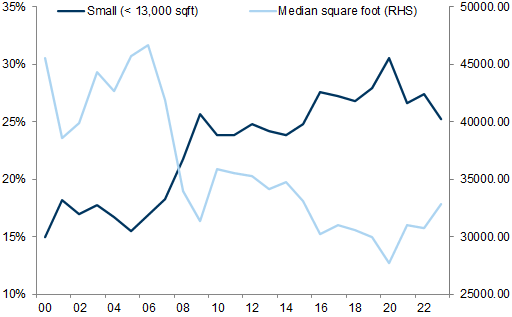
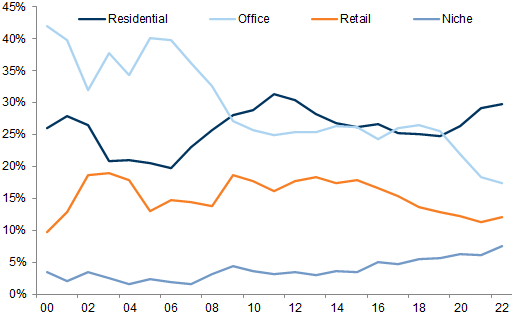
Exhibit 20: Deals in residential real estate have picked up relative to offices since Covid-19

Distribution of deals by type
20. Deals in residential real estate have picked up relative to offices since Covid-19. Data available on request.
Source: Preqin , Goldman Sachs Global Investment Research

(7) Who are the biggest investors in private markets?

Portfolio composition and the share allocated to private assets vary materially across investor types. Among other factors, this is due to risks, regulation and liquidity considerations, which are particularly relevant for investments in private markets, even more so than for traditional asset classes. An analysis of investors active in the private space shows that, outside of dedicated alternative investment funds, family office portfolios have on average the largest allocation to private markets (Exhibit 21). Institutional investors with long investment horizons, such as sovereign wealth funds, endowments and pension funds follow and tend to have the most balanced allocation across private and public markets.

Exhibit 21: Family offices portfolios are the most skewed to private assets, followed by endownments and sovereign wealth funds

Portfolio composition of investors in alternatives (as of 2023 H1)
21. Family offices portfolios are the most skewed to private assets, followed by endownments and sovereign wealth funds. Data available on request.
AuM coverage ca. 34$ tn
Source: Preqin, Goldman Sachs Global Investment Research
Looking across the sub-asset classes in the alternative space, real estate investments represent a large share of private markets allocation for a number of investors. However, we note that the real estate breakdown also includes listed real estate. Once that is taken into account, investments in private assets specifically are mostly concentrated in private equity (Exhibit 22). Private credit represents a small share of the allocation to private capital – with the exception of dedicated alternative fund managers, private credit weights are <5% across investors. Hedge funds have become increasingly popular diversifiers, gaining more weight within the allocation to alternatives.

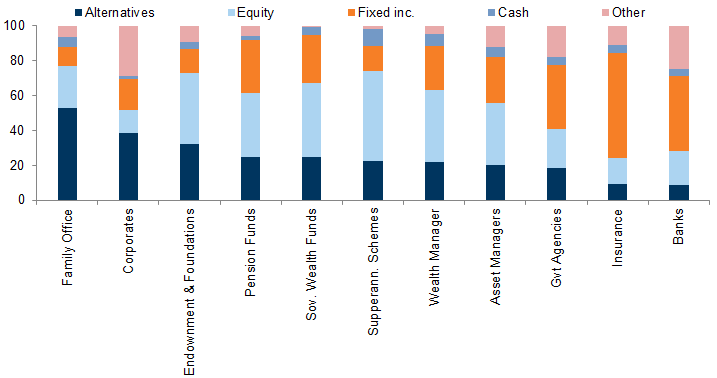
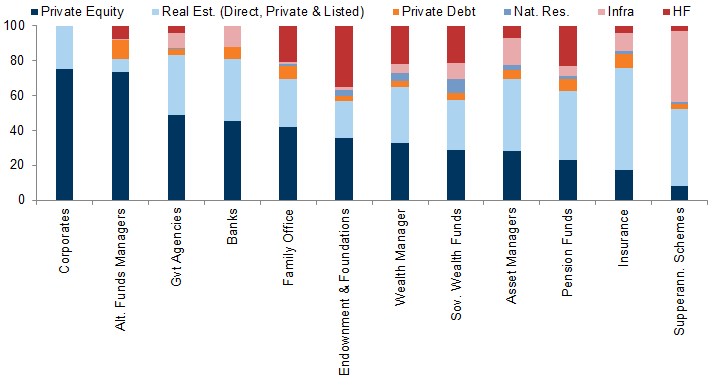
Exhibit 22: Real estate investements represent a large share of the allocation to alternatives

Composition of the allocation to alternatives (as of 2023 H1)
22. Real estate investements represent a large share of the allocation to alternatives. Data available on request.
AuM coverage ca. 12$tn
Source: Preqin, Goldman Sachs Global Investment Research

(8) Which companies are private equity funds buying?

Tech has increasingly become the favorite target in the US (Exhibit 23), while the European market has generally been more skewed to industrials and healthcare (Exhibit 24). The focus on tech and healthcare is not surprising as these sectors typically offer the best growth opportunities, a high degree of innovation, as well as some defensive properties. Overall, the sector composition of the private equity universe has been relatively stable over the past 20 years on both sides of the Atlantic, at least prior to 2020 when tech started taking a larger share, especially in the US. Since the start of the year, there has also been a pick-up in materials in Europe.

Exhibit 23: The sector composition of US PE has been relatively stable over time

Sector distribution in US PE (based on total deal value). Aggregated data to match GSCI Level I sectors. YTD for 2023
23. The sector composition of US PE has been relatively stable over time. Data available on request.
Source: Preqin, Goldman Sachs Global Investment Research

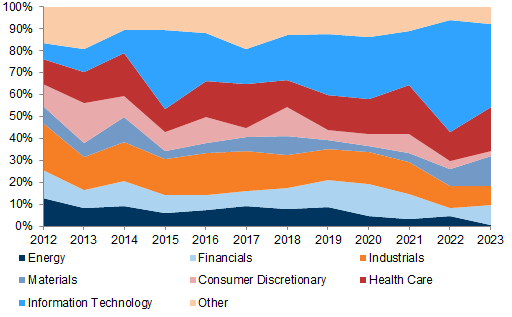
Exhibit 24: The European PE market is more skewed to industrials and healthcare

Sector distribution in Europe (ex UK) PE (based on total deal value). Aggregated data to match GSCI Level I sectors. YTD for 2023
24. The European PE market is more skewed to industrials and healthcare. Data available on request.
Source: Preqin, Goldman Sachs Global Investment Research
Aggregating the private equity industry split to match public markets, we find that US private equity has become even more skewed to the predominant sectors on the public side. This is not the case in Europe, where energy and financials remain the most predominant on the public side, but not in private (Exhibit 23). Overall, compared with their public counterparts, private equity looks more balanced in terms of sector composition both in Europe and the US, but US private deals have not been immune to the concentration trend we have seen in public. As a result, the diversification benefits from a pure sector exposure may be less attractive than in the past.
That said, the largest difference between private and public markets can be seen at the industry/sub-sector level (Exhibit 26). For example, the data suggest that software rather than hardware represents the more likely target in the private space – this composition can also help explain the higher resilience of private markets as software is typically much less volatile than hardware. This indicates more diversification potential below the surface from private equity for asset allocators.

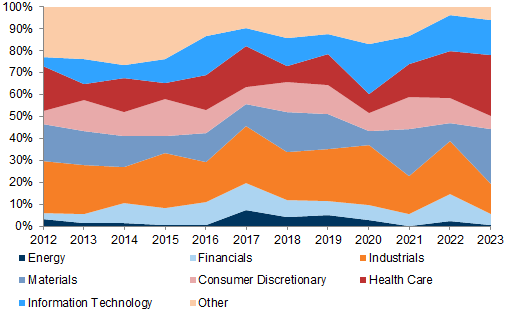
Exhibit 25: Compared with listed equities, US private equity is more skewed to Tech, Europe to Healthcare

Sector distribution in the public market benchmark vs. Private Equity. 5-year average. Aggregated data to match GSCI Level I sectors
25. Compared with listed equities, US private equity is more skewed to Tech, Europe to Healthcare . Data available on request.
Source: Preqin, Datastream, Goldman Sachs Global Investment Research

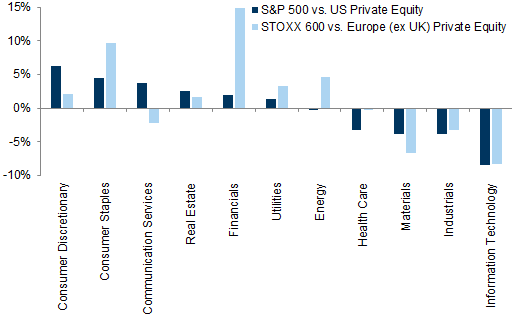
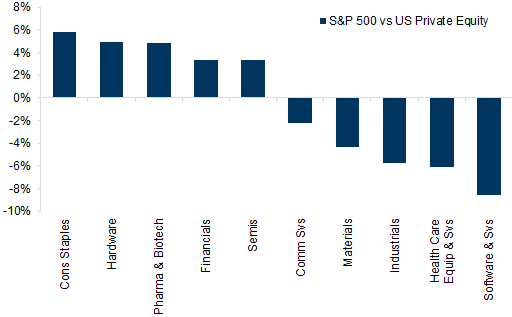
Exhibit 26: Us private equity Tech sector is much more skewed to software, the S&P 500 to hardware

Sector distribution in the public market benchmark vs. Private Equity (average since 2010). Aggregated data to match selected GSCI Level II sectors
26. Us private equity Tech sector is much more skewed to software, the S&amp;P 500 to hardware. Data available on request.
Sectors selected based on the largest difference in public vs. private
Source: Preqin, Datastream, Goldman Sachs Global Investment Research

(9) Is AI driving another strong Tech wave in private equity activity?

The number of global private equity deals in the artificial intelligence (AI) space has kept up with the first half of last year, which was the second-best year after the record numbers from 2021. Most importantly, the total value of AI-related deals has fallen by much less than the aggregate across sectors, resulting in investment in AI being close to record highs in terms of share of total deal value (Exhibit 27). The pick-up in AI deals has been strong also in venture capital (VC) – in AuM terms, AI deals now represent about 30% of the total deals in the space (Exhibit 28).

Exhibit 27: Private equity deals in AI are close to record highs in terms of share of total deal value

Global Private equity deals in AI
27. Private equity deals in AI are close to record highs in terms of share of total deal value. Data available on request.
Source: Preqin, Goldman Sachs Global Investment Research

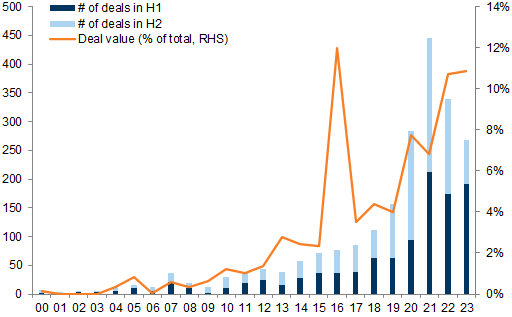
Exhibit 28: Record share of AI deals in the VC space

Global VC deals in AI
28. Record share of AI deals in the VC space. Data available on request.
Source: Preqin , Goldman Sachs Global Investment Research
Tech-driven rallies have proven to be very favorable for VCs in the past: VCs materially outperformed the S&P 500 and private equity both in the run-up to the tech bubble and in the rebound from the Covid-19 bear market (Exhibit 29). While the risk that AI will develop into a bubble should not be completely dismissed, our global strategists' analysis of historical comparisons to tech revolutions suggests we are not in a bubble (yet). We think investors' focus in the AI space is likely to remain elevated, attracting more capital and continuing to support the (already) elevated valuations.

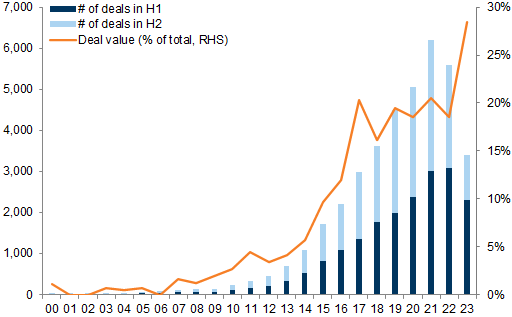
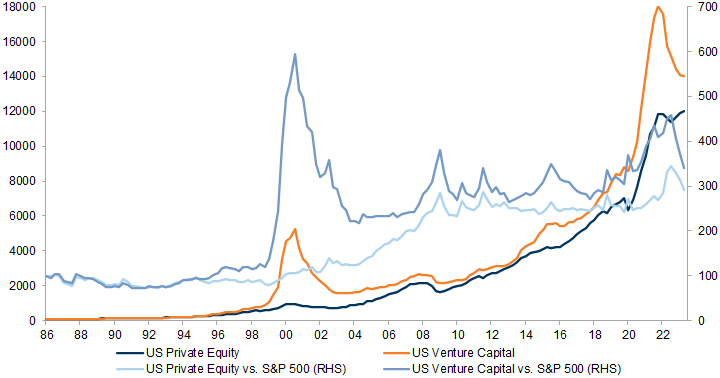
Exhibit 29: VC could materially outperform the S&P 500 in AI-driven market, as happened during the Tech Bubble

29. VC could materially outperform the S&amp;P 500 in AI-driven market, as happened during the Tech Bubble. Data available on request.
Source: Cambridge Associates, Preqin, Datastream, Goldman Sachs Global Investment Research

(10) Is there a case for an increase in cross-border transactions given the US vs. RoW valuation gap?

Private markets investments generally show a strong domestic bias, especially for investors based in developed markets. In general, private investors across equity, VCs and debt tend to favor domestic targets whenever the market is deep enough. By contrast, investors in EMs tend to have more appetite for international opportunities. In most cases, this behavior has been remarkably consistent through time, with China being the main exception as investments turned even more domestic in the post-Covid era. This is not surprising as fund managers are likely to benefit from both information advantages and easier access to investments in the regions where they are based.
More than 80% of US investors' deals target US companies, and both Europe and China are not too far off those figures in their respective domestic markets (Exhibit 30). Of course, there are limitations to this analysis given it is based on the number of deals rather than on deal size: while this allows us to capture the broadest set of data, it might hide some size bias on domestic relative to international transactions. The data we have available for deal size support the results from the analysis on the deal number, although they suggest the domestic bias could be somewhat less extreme. Also, VC markets are likely to be more international than shown here, as often times capital is pooled from investors across different regions.

Exhibit 30: Private investors in developed markets tend to target domestic companies

Cross-country deals, completed and announced (data since 2000). Different colors correspond to the location of the target company
30. Private investors in developed markets tend to target domestic companies. Data available on request.
Source: Preqin, Goldman Sachs Global Investment Research
While some of our aggregates do not isolate cross-border transactions – for example, between different European countries – we find that on average more than 60% of private equity and private debt deals involve the same European/developed country. Interestingly, for private equity investments this share has been decreasing in Europe since 2019, suggesting that European investors have favored more cross-border transactions within the region (Exhibit 31). Across DMs, UK investors are the most active in international transactions and post Covid-19 they have increased their investment share in both Europe and the US, but YTD there have been signs of a more domestic turn. On average, across regions, at least 10% of private investments involve US targets, with China the main exception.
An easing in macro uncertainty and financial conditions next year could support a re-start in M&A activity. Non-US companies appear more attractive as targets given they trade at historical discounts vs. the US (Exhibit 32). We would therefore expect to see higher cross-border flows with cash-heavy private US investors looking to acquire cheaper assets abroad. Our equity analysts have screened for potential targets in Europe.

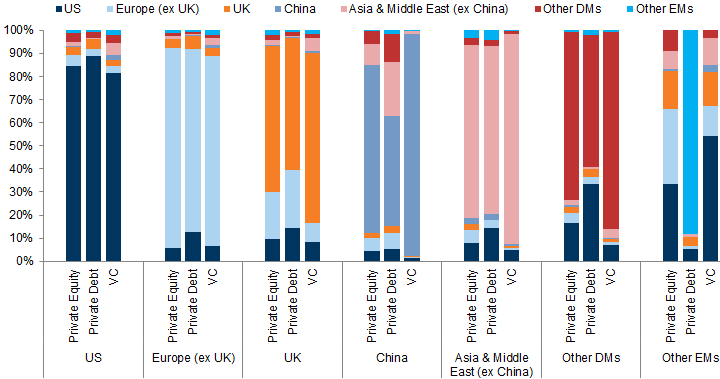
Exhibit 31: European countries' cross-border flows have increased

Share of cross-border private equity deals within Europe and other Developed Markets
31. European countries' cross-border flows have increased. Data available on request.
Source: Preqin, Goldman Sachs Global Investment Research

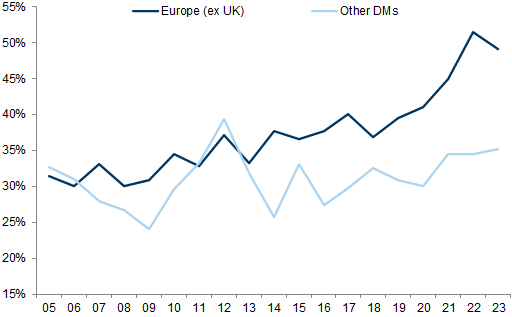
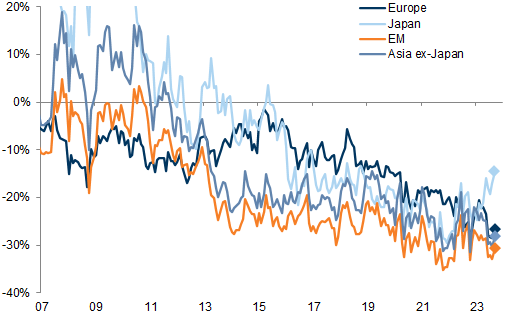
Exhibit 32: Non US markets trade at historical discounts vs. the US

12m fwd P/E discount relative to the US
32. Non US markets trade at historical discounts vs. the US. Data available on request.
Source: FactSet, Goldman Sachs Global Investment Research

Investors should consider this report as only a single factor in making their investment decision. For Reg AC certification and other important disclosures, see the Disclosure Appendix, or go to www.gs.com/research/hedge.html.