Goldman Sachs Research
European Economics Analyst
UK—Can Higher Structural Unemployment Explain Pay Pressures? (Moberly)
22 October 2023 | 11:07PM BST | Research | Economics| By Sven Jari Stehn and others
More
  • Elevated wage growth has been an important factor in pushing Bank Rate higher. The BoE has noted that wage growth has exceeded the predictions of standard models, and Deputy Governor Broadbent has suggested that higher structural unemployment could explain this disparity. In this Analyst, we assess whether the structural unemployment rate has risen, how to explain elevated wage growth, and the outlook for pay pressures.

  • We begin by using statistical models to estimate the structural unemployment rate. Models based on unemployment and inflation expectations struggle to explain high wage inflation and so point to a steep rise in structural unemployment since the pandemic. However, models driven by consumers’ perceptions of past inflation rather than their expectations fit the recent data better and suggest that structural unemployment has risen very little since 2019.

  • We then assess the bottom-up drivers of labour market mismatch. Several factors point to rising mismatch and hence structural unemployment during the pandemic, notably changing migration patterns and certain industries being disproportionately affected by early retirements. That said, quantitative measures of mismatch have fallen back from post-pandemic peaks and now stand close to 2019 levels.

  • In our view, the balance of evidence suggests that structural unemployment is likely only modestly higher than pre-pandemic levels. However, our models imply that the labour market was already tight before the pandemic. As such, even if the structural rate has not risen by much, we still find that it lies well above the current unemployment rate, indicating that the labour market remains tight in levels terms. Indeed, our models imply a structural rate that is notably higher than the BoE’s estimates.

  • Our models suggest that elevated labour market tightness has contributed to high wage growth, although the pass through of price inflation has been a more important driver. That said, our previous research suggests that the pass through from price inflation to wages may have been faster because the labour market is tight, an interaction effect that our models would not capture, potentially pointing to a more important role for slack.

  • We expect wage pressures to ease in the near-term given falling headline inflation and continued monetary policy drag pushing unemployment slightly higher. We expect that will allow the BoE to hold rates at 5.25%. However, we do see a possibility that wage growth normalisation could slow in 2024 as the labour market remains tighter than historical averages, pointing to risks that the BoE could need to hike further at that juncture.

UK—Can Higher Structural Unemployment Explain Pay Pressures?

Wage growth has accelerated in 2023 (Exhibit 1), which has been a key factor behind the BoE taking rates higher. Governor Bailey has noted that standard models struggle to explain why wage growth has been so elevated. Deputy Governor Broadbent has suggested that higher structural unemployment could explain this disparity. In this Analyst, we assess whether the structural unemployment rate has increased and whether this explains elevated wage growth. We then discuss the outlook for pay pressures.

Exhibit 1: Pay Growth Has Accelerated in 2023…

1. Pay Growth Has Accelerated in 2023…. Data available on request.
Source: Goldman Sachs Global Investment Research, Haver Analytics

A Statistical Approach

We begin by using a statistical approach to estimate the structural unemployment rate. We construct a simple model which relates wage growth to productivity, inflation expectations, and unemployment, similar to models previously presented by the BoE. The model does not explain rising wage growth in 2023 without variations in structural unemployment, because inflation expectations have fallen and unemployment has risen (Exhibit 2, left). However, a model based on consumers’ perceptions of past inflation, which remain high, matches recent wage dynamics much better (Exhibit 2, right). That is consistent with wage growth being driven importantly by inflation catch-up effects rather than expectations of future inflation.

Exhibit 2: …Which Is Better Explained by Lagged Inflation Than Inflation Expectations

2. …Which Is Better Explained by Lagged Inflation Than Inflation Expectations. Data available on request.
Source: Goldman Sachs Global Investment Research
We then adapt the model to allow the structural unemployment rate to vary over time to help explain observed wage growth. Our methodology is detailed in the Appendix. Because the model based on inflation expectations struggles to explain recent wage growth without a much higher structural unemployment rate, the model finds that the structural unemployment rate is steeply increasing (Exhibit 3, left). Even with such a large increase it still cannot explain why wages have risen so quickly (Exhibit 3, right).

Exhibit 3: Models Based on Expectations Imply a Sizeable Increase in Structural Unemployment…

3. Models Based on Expectations Imply a Sizeable Increase in Structural Unemployment…. Data available on request.
Source: Goldman Sachs Global Investment Research, Haver Analytics
However, the model based on consumers’ perceptions of past inflation fit the recent data well even absent higher structural unemployment. As such, the model suggests that the structural unemployment rate has risen very little since 2019 (Exhibit 4).

Exhibit 4: …But Models Based on Inflation Perceptions Point to a Far Smaller Increase…

4. …But Models Based on Inflation Perceptions Point to a Far Smaller Increase…. Data available on request.
Source: Goldman Sachs Global Investment Research, Haver Analytics
We find that this holds even after controlling for broader slack measures such as the vacancy rate (Exhibit 5). The vacancy rate has an important role in explaining wage inflation dynamics in the model with inflation expectations (shown in the Appendix). It accounts for a smaller fraction of recent wage growth dynamics in the model with inflation perceptions, as the model already fits the data reasonably well.

Exhibit 5: …Even After Controlling for Broader Slack Measures

5. …Even After Controlling for Broader Slack Measures. Data available on request.
Source: Goldman Sachs Global Investment Research, Haver Analytics

The Drivers of Mismatch

We now turn to the bottom-up drivers of structural unemployment to examine whether these point to a rise in the structural rate. We focus on sources of mismatch between labour supply and labour demand (for example, by sector or by skill level). If the degree of mismatch has risen, then the labour market could be tighter than the unemployment rate alone suggests.
We begin by looking at changes in the composition of employment. The Labour Force Survey indicates that the dispersion of employment growth across industries have risen sharply over the course of the pandemic (Exhibit 6), potentially increasing the degree of mismatch between labour supply and demand. However, this is not supported by workforce jobs data, which is more reliable at the industry level. As such, the evidence does not necessarily point to large sectoral shifts.

Exhibit 6: Conflicting Evidence on Sectoral Shifts Since the Pandemic

6. Conflicting Evidence on Sectoral Shifts Since the Pandemic. Data available on request.
Source: Goldman Sachs Global Investment Research, ONS
We then turn to changes in the composition of labour supply. Participation rates declined during the pandemic, most notably in the 50-64 age group, in part driven by a drop in the retirement age. If the fall in labour supply disproportionately affected certain sectors, that could generate mismatch. There is some support for this notion in the data; survey data indicate that the professional, scientific, and technical occupations and public administration were disproportionately affected by early retirements (Exhibit 7). However, the sectoral data suffers from small sample sizes and so should be treated with caution.

Exhibit 7: Early Retirements Hit Certain Sectors Disproportionately

7. Early Retirements Hit Certain Sectors Disproportionately. Data available on request.
Source: Goldman Sachs Global Investment Research, ONS
Changes in the composition of labour supply could also stem from changing migration patterns. Our previous analysis indicates that new migration rules post-Brexit have affected labour supply in certain sectors, most notably in hospitality, agriculture, and support services. This could potentially have increased mismatch.
Further effects of migration on structural unemployment could arise if migrants face barriers to finding work. That appears to be the case for recent humanitarian migrants from Ukraine. Many migrants are currently unemployed (Exhibit 8, left), and nearly 40% report barriers to taking up work (Exhibit 8, right), most commonly because of language skills, limits to geographical mobility, or qualifications not being recognized. That could have contributed to higher structural unemployment, although the effect is likely to be fairly small.

Exhibit 8: Humanitarian Migrants May Face Barriers to Finding Work

8. Humanitarian Migrants May Face Barriers to Finding Work. Data available on request.
Source: Goldman Sachs Global Investment Research, ONS

Quantitative Measures of Mismatch

We now assess whether quantitative measures of mismatch support the notion that greater mismatch could have led to higher structural unemployment since the pandemic. We begin by examining the UK’s Beveridge Curve (Exhibit 9, left). An outward shift in the curve is indicative of greater labour market mismatch and a higher structural unemployment rate. The curve appears to have shifted outwards very sharply after the pandemic but has since started to revert. That indicates that mismatch initially increased but has since fallen back towards pre-pandemic levels.
Indeed, if greater mismatch were driving an increase in structural unemployment, one would expect to see more long-term unemployment. However, the share of long-term unemployment in total unemployment is currently low relative to historical averages (Exhibit 9, right).

Exhibit 9: The Beveridge Curve Is Now Shifting Inwards…

9. The Beveridge Curve Is Now Shifting Inwards…. Data available on request.
Source: Goldman Sachs Global Investment Research, Haver Analytics
We then construct an index of the mismatch between vacancies and unemployment at the industry level (Exhibit 10, left). This index captures the fraction of unemployment driven by mismatch of vacancies and unemployment between industries. The index suggests that although mismatch between industries increased significantly during the pandemic, it has since fallen back and now stands below historical averages. Equally, the cross-sector dispersion in the jobs-workers gap is somewhat lower than the historical average (Exhibit 10, right).

Exhibit 10: …And Mismatch Between Industries Now Looks Similar to Pre-Pandemic Levels…

10. …And Mismatch Between Industries Now Looks Similar to Pre-Pandemic Levels…. Data available on request.
Source: Goldman Sachs Global Investment Research
Indeed, although certain industries show signs of labour shortages, the industry-level composition of vacancies and unemployment is now similar to the pre-pandemic composition (Exhibit 11).

Exhibit 11: …With Elevated Vacancies in Healthcare, Hospitality, and Professional Occupations

11. …With Elevated Vacancies in Healthcare, Hospitality, and Professional Occupations. Data available on request.
Source: Goldman Sachs Global Investment Research

Has Structural Unemployment Risen?

Overall, we think that the balance of evidence points to, at most, a modest rise in the structural unemployment rate since 2019. Models based on consumers' perceptions of past price increases match recent wage dynamics reasonably well even absent an increase in the structural rate. Although changes in the composition of labour supply could indicate greater mismatch, the recent inwards shift in the Beveridge curve implies that mismatch has declined since post-pandemic peaks.
That said, our analysis does indicate that the labour market was already tight before the pandemic. Even absent a large change in the structural rate, we still find that unemployment is well below the structural level, suggesting that the labour market remains tight in levels terms, especially when broader measures of slack (such as the vacancy rate) are considered. Indeed, our preferred model specifications imply a structural rate slightly above 5%. That indicates meaningful upside risks to the BoE’s estimates that the medium-term equilibrium rate of unemployment is slightly above 4%.
That conclusion is supported by data on recruitment difficulties, which remain elevated relative to historical levels (Exhibit 12). Evidence from the BoE Agents Survey suggests that recruitment difficulties have reduced notably in lower skilled occupations over the last year but have proved more persistent in areas such as IT, engineering, and finance.

Exhibit 12: Recruitment Difficulties Remain Elevated

12. Recruitment Difficulties Remain Elevated. Data available on request.
Source: Goldman Sachs Global Investment Research, Haver Analytics, Bank of England

Explaining Pay Pressures

Our models imply that inflation “catch-up” effects following high price inflation have been the predominant driver of pay pressures. The tight labour market has also been a driver but accounts for less of the rise in pay growth. There has also been a minor contribution from compositional effects.
A caveat to this finding is that our model assumes that labour market tightness and price inflation have linear effects on wage inflation. However, recent studies suggest that the response of inflation to labour market tightness could be larger when the labour market is tight. Equally, our Global Economics team's research suggests that the pass through from prices to wages is higher in a tight labour market. Indeed, there is qualitative evidence that labour market tightness has led to changes in wage setting behaviour in the UK since the pandemic; the BoE Agents’ survey indicates that 2021 and 2022 saw unusual mid-year top ups to pay to compensate workers for higher inflation and retain staff, especially in industries experiencing strong labour demand. These arguments may imply a more important role for labour market tightness in explaining pay pressures.
Moreover, our previous research suggests that the flexibility of the labour market may have decreased with the change in migration regime after Brexit. That could have led to changes in the pass through from price to wage inflation.
Finally, there are other variables that our models do not consider which may help to explain pay pressures. The post-pandemic period has seen higher job-to-job flows, especially in high skilled sectors (Exhibit 13). Recent studies find that these flows are empirically important drivers of pay growth, and indeed the CIPD recently found that employers are increasingly having to make counter offers to retain staff who have job offers elsewhere.

Exhibit 13: High Job-To-Job Flows, Especially in High Skilled Sectors

13. High Job-To-Job Flows, Especially in High Skilled Sectors. Data available on request.
Source: Goldman Sachs Global Investment Research, Haver Analytics

The Outlook for Wage Growth

Several factors indicate that wage inflation is likely to fall back in the near-term. First, headline inflation is falling. The BoE’s Inflation Attitudes Survey indicates that consumers have started to notice price rises slowing, and we expect this to feed through to lower wage growth (albeit with a lag). Second, our estimates indicate that there is more monetary drag in the pipeline, which points to further modest increases in the unemployment rate ahead. Third, indicators of mismatch are falling back, potentially reversing any upwards momentum in structural unemployment rates. Fourth, job-to-job flows have started to decline and their composition has shifted, with fewer resignations and more redundancies. Fifth, the BoE Agents Survey indicates that businesses are finding it easier to retain staff and are making fewer cost-of-living payments to employees.
As such, we expect pay growth to ease in the coming months. That view is consistent with leading indicators such as the PAYE median pay growth numbers. We expect that wage growth normalisation will allow the BoE to keep rates on hold at 5.25%.
There are, however, risks that progress on wage growth normalisation could slow in early 2024, given that the labour market remains tight relative to historical levels. Indeed, our previous research indicates that although labour market tightness will ease in the near-term, it may level off above historical averages. Moreover, the Decision Maker Panel and data from XpertHR indicate that firms anticipate pay growth of roughly 5% over the next twelve months, well above levels consistent with the inflation target given recent productivity growth trends.
As such, there remain risks that progress on disinflation could stall, which would put pressure on the BoE to take rates higher. We expect that the pay rounds in January and April will be particularly important as a test of how fast wage growth is reverting to target-consistent levels.
James Moberly

Appendix

Model Description

We construct a measure of wage growth by taking three-month year-on-year growth in private sector regular pay and combining with a BoE measure of underlying pay growth during the pandemic period. We strip out compositional effects, trend labour productivity, and trend inflation. We allow for a break in trend productivity growth in 2008.
In some specifications, we suppose that wage inflation is driven by household one year ahead inflation expectations from the Inflation Attitudes Survey, the unemployment gap, and an AR(1) residual. In other specifications, we use households’ perceptions of the current inflation rate instead of their expectations. We assume that inflation expectations (or perceptions) and the unemployment gap follow an AR(1) process, while the structural unemployment rate has a unit root.
Combining these equations creates a state-space model, which we estimate using Bayesian methods. We use quarterly data from 2001Q1 until 2023Q2. We assume that the structural unemployment rate starts at a level implied by HP filtering unemployment rate data using a slow-moving trend.
The priors are set to be relatively loose, with two exceptions. First, we impose a tight and low prior on the autocorrelation of the residual in the wage Phillips curve. This captures an assumption that it is unlikely that there are persistent deviations in wage growth from the levels implied by the model. If the model allowed for persistent unexplained deviations from the model-implied level of wage growth, then that would interfere with identification of the structural unemployment rate.
Second, in the baseline model, we impose a tight prior on the standard deviation of the change in the structural unemployment rate. This in effect assumes that changes in structural unemployment are gradual and prevents the model fitting the data by assuming implausibly sudden changes in structural unemployment.

Model With Vacancies And Inflation Expectations

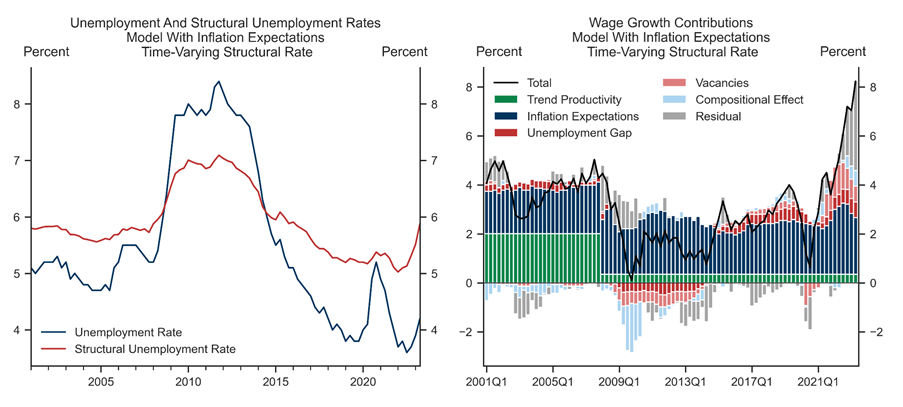
We now explore a model with inflation expectations that controls for the vacancy rate. In this model, the vacancy rate has an important role in explaining wage inflation pressures, although the model still struggles to capture the recent rise in wage growth as vacancies have been declining since 2022 while wage growth has been accelerating. The model consequently still points to a considerable rise in the structural rate of unemployment (Exhibit 14).

Exhibit 14: Broader Slack Helps Model Fit in Inflation Expectations Model

14. Broader Slack Helps Model Fit in Inflation Expectations Model. Data available on request.
Source: Goldman Sachs Global Investment Research, Haver Analytics

Model With Looser Prior on Variability Of Structural Rate

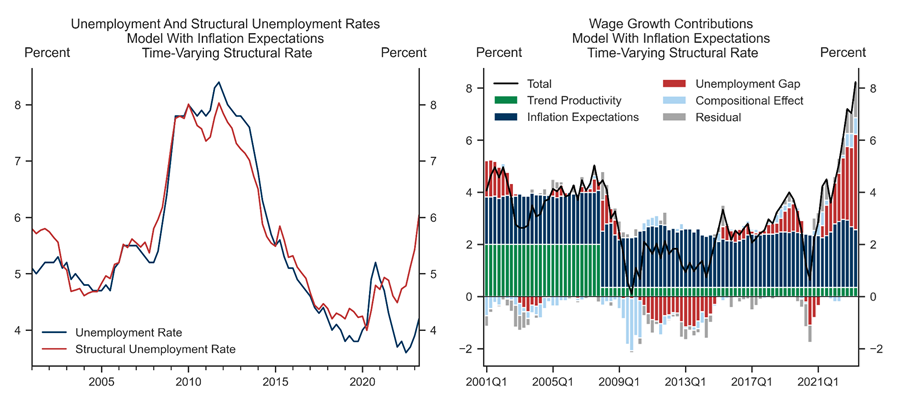
We now show results from a model with a looser prior on the variability of structural unemployment. For the model based on inflation expectations, this makes a considerable difference (Exhibit 15). The model estimates a larger Philips curve slope, which allows rising slack to account for a much larger share of recent inflationary pressures. To explain why wage inflation did not fall by more in the post-crisis period with unemployment so high, the model implies that the rise in unemployment in 2008-09 was predominantly structural. In our view, these large movements in the structural rate are less plausible and reflect the fact that the model struggles to fit the data well with more reasonable movements in structural unemployment.

Exhibit 15: Looser Prior Results in Large Movements in Structural Rate in Inflation Expectations Model…

15. Looser Prior Results in Large Movements in Structural Rate in Inflation Expectations Model…. Data available on request.
Source: Goldman Sachs Global Investment Research, Haver Analytics
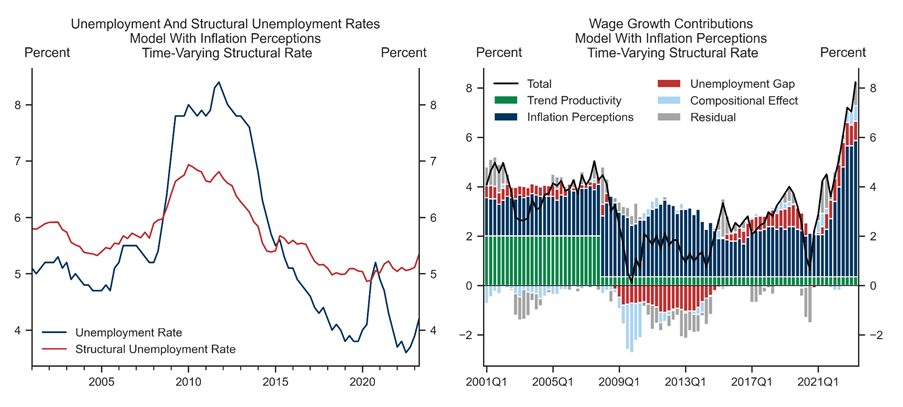
For the model based on inflation perceptions, allowing a looser prior on movements in the structural rate of unemployment makes relatively little difference to the results (Exhibit 16). This reflects the fact that the model already fits the data reasonably well with more plausible movements in the structural unemployment rate.

Exhibit 16: …But Makes Little Difference in Inflation Perceptions Model

16. …But Makes Little Difference in Inflation Perceptions Model. Data available on request.
Source: Goldman Sachs Global Investment Research, Haver Analytics

Investors should consider this report as only a single factor in making their investment decision. For Reg AC certification and other important disclosures, see the Disclosure Appendix, or go to www.gs.com/research/hedge.html.