Goldman Sachs Research
Oil Analyst
US Shale: The Marginal Supplier Matures
22 October 2023 | 7:20AM EDT | Research | Commodities| By Daan Struyven and others
More
  • Given the focus on how the market may adjust to any conflict-related decline in Middle Eastern output and on the largest US upstream acquisition in 25 years, we answer questions on the world’s marginal producer, namely the US.

  • The US has driven all the growth in global oil supply over the past decade and the past year, and the Permian basin has driven all growth in US crude supply since early 2020. The US remains the key short-term marginal oil producer, where flexible short-cycle private producers sit high on the global cost curve.

  • Crude output growth in the Permian has slowed from 1mb/d in 2019 to 0.5mb/d year-over-year in September given the drop in the rig count, and the stabilizing well productivity trend. Permian output, however, is still edging up because of rises in the number of drilled wells per rig and well length. The lack of well productivity growth (which reflects an offset between deteriorating rock quality and improving technology) suggest that Permian output growth will slow further.

  • US oil producers remain capital disciplined. US public firms are sticking to their moderate and price insensitive growth targets, and capex has moved up only moderately from low levels. Consolidation and high interest rates only have a muted effect on aggregate production as investment is largely self-financed, and only small private firms report significant credit effects.

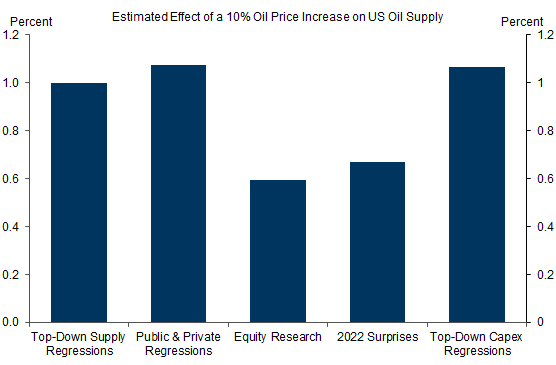
  • We find that the elasticity of US supply has fallen over time, and is much smaller for public producers than for privates. We estimate that a 10% oil price increase boosts US liquids supply by around 1% or 200kb/d. Consolidation is likely to further depress the supply elasticity as inelastic public producers gain market share, and efficiency gains push the US lower on the cost curve.

  • We see two takeways. First, the trends in the Permian and ongoing capital discipline support our forecasts that US liquids supply growth slows in 2024 to 0.6mb/d (vs.1.4mb/d in 2023), and that Brent reaches $100/bbl in June. Second, our estimates imply that the US supply response to higher prices—caused by any geopolitical supply shock—would offset only about 20-25% of the initial shock, which underscores OPEC’s key role in balancing the market. While core OPEC countries currently have nearly 4mb/d of spare capacity, physical or political barriers to deploying spare capacity are the key upside risk to oil prices.

The US Remains the World's Marginal Oil Supplier; Well Productivity in the Permian Basin--the Key US Growth Engine--Is No Longer Increasing

The US Remains the World's Marginal Oil Supplier; Well Productivity in the Permian Basin--the Key US Growth Engine--Is No Longer Increasing. Data available on request.
2023 estimates of Permian productivity are preliminary.
Source: IEA, ICE, Enverus, Goldman Sachs Global Investment Research

US Shale: The Marginal Supplier Matures

Given the focus on how the oil market may adjust to any conflict-related decline in Middle Eastern output and on the ExxonMobil-Pioneer deal (the largest US upstream acquisition in 25 years), we answer key questions on the world’s marginal and largest producer, namely the US. We analyze:
  1. US supply trends and whether the US remains the key marginal producer

  2. Fundamentals in the Permian play (the key growth engine)

  3. The impact of capital discipline, consolidation, and high rates on US supply

  4. The elasticity of US supply and geopolitical shocks

US Supply Trends

1. How much is the US driving global oil supply growth?
The US has driven all the growth in global oil supply, both over the past decade and over the past year.[1]
Specifically, the IEA estimates that liquids supply is now 7mb/d higher than in 2014 for the US, but slightly down for the rest of the world (Exhibit 1). Similarly, liquids supply over the past 12 months has risen by 1mb/d for the US, but is down nearly 1mb/d for the rest of world given OPEC+ cuts (Exhibit 1).

Exhibit 1: The US Drives Growth in Global Oil Supply

1. The US Drives Growth in Global Oil Supply. Data available on request.
Source: IEA, Goldman Sachs Global Investment Research
US supply has also grown faster than expected. US liquids supply is on track to exceed IEA expectations for the 13th consecutive year, except for 2016 and 2020. That said, the 2022 and 2023 forecast errors will likely be smaller than before the pandemic, and US total liquids supply has been roughly flat since June.

Exhibit 2: US Supply Has Exceeded Expectations (Except in 2016 and 2020)

2. US Supply Has Exceeded Expectations (Except in 2016 and 2020). Data available on request.
IEA forecasts are as of July in the year prior for 2011-2016, and as of June in the year prior from 2017.
Source: IEA, Goldman Sachs Global Investment Research
2. Where is growth in US liquids supply coming from?
While crude oil has driven ¾ of liquids supply growth in 2018-2019 and over the past 12 months, Natural Gas Liquids (NGLs) have driven all US supply growth since early 2020.
Looking across basins, the Permian has driven about 60% of crude growth in 2018-2019 and over the past year, and more than fully accounts for all the growth in US crude supply since the start of 2020. However, as Permian YoY growth has slowed substantially in recent months, much of the recent US growth comes from basins with a weaker underlying trend, such as the Bakken (Exhibit 4).

Exhibit 3: The Permian Basin More Than Fully Accounts For all the Growth in US Crude Supply Since 2020

3. The Permian Basin More Than Fully Accounts For all the Growth in US Crude Supply Since 2020. Data available on request.
Source: EIA, Haver Analytics, Goldman Sachs Global Investment Research

Exhibit 4: Permian Production Has Slowed Recently

4. Permian Production Has Slowed Recently. Data available on request.
Source: EIA, Haver Analytics, Goldman Sachs Global Investment Research
3. Is the US still the global short-term marginal supplier?
Yes, the US remains the most important short-term marginal oil producer.
We define short-term marginal suppliers as firms, which take oil prices as given, and adjust supply to prices within a few quarters until no longer making a profit. The key differences with OPEC—the other key short-term balancer—are that the swing producer group 1) sets prices (timespreads) as a dominant producer (which anticipates non-OPEC supply), and 2) can adjust supply within a few weeks given spare capacity.
Regressions of year-over-year (YoY) supply growth on lagged YoY oil price growth confirm that supply is more short-term elastic in the US than elsewhere (Exhibit 5).

Exhibit 5: Oil Supply Is More Price Elastic in the US

5. Oil Supply Is More Price Elastic in the US. Data available on request.
Core OPEC sums Saudi Arabia, the UAE, and Kuwait. We show the 10 largest producers excluding the Fragile Give (i.e. Iran, Iraq, Libya, Nigeria and Venezuela) where disruptions drive supply fluctuations. The sample is 2016Q1-2023Q3.
Source: IEA, ICE, Goldman Sachs Global Investment Research
This higher US elasticity reflects two factors. First, short-cycle shale technology and technical expertise imply that US suppliers can respond quickly to prices.[2] Second, the high position of many US shale projects on the global cost curve, private firms’ focus on returns, and high US oil-to-gas ratios imply that US (private) suppliers often want to respond.[3]
The US is not the only producer adjusting supply in the short term to prices given non-US short-cycle fields, OPEC as the swing producer, and the ability to boost long-cycle output somewhat by increasing the services intensity or delaying maintenance.
We next review fundamentals in the Permian; the key US growth engine.

Permian Slowing Fundamentals

4. Why is Permian crude production growth slowing?
Permian crude annualized production growth has slowed to 0.5mb/d year-over-year (on a 3MMA basis) in September, down from 0.9mb/d in 2019 (Exhibit 6, left panel), and the EIA predicts a further Q4 slowdown. The slowdown reflects two factors.
First, the Permian weekly rig count has dropped by 15% since April 2023, following price declines in 2022H2-2023Q1, and by 30% from the 2018-2019 average (Exhibit 6, right panel). Second, trend Permian well-level productivity is no longer increasing (Exhibit 7).

Exhibit 6: Slowing Permian Crude Production; Falling Permian Rig Count

6. Slowing Permian Crude Production; Falling Permian Rig Count. Data available on request.
Source: EIA, Genscape, Haver Analytics, Baker Hughes, Goldman Sachs Global Investment Research

Exhibit 7: The Underlying Permian Well Productivity Trend Has Stopped Rising

7. The Underlying Permian Well Productivity Trend Has Stopped Rising. Data available on request.
2023 estimates are preliminary.
Source: Enverus, Goldman Sachs Global Investment Research
We define underlying well productivity as oil production in the first six months of operation, adjusted by the length of the well’s lateral leg, as a proxy for the underlying “rock quality”. This adjusted productivity measure is similar for 2022 as for 2019, but is nearly 10% lower for 2023 relative to 2019. Looking through the noise, this productivity proxy seems to be roughly stable, reflecting an offset between deteriorating rock quality and improving technology.
5. Why is Permian crude output not declining if rigs are falling?
Because the new well output per rig is still trending higher.
Permian new well oil production per rig has increased fivefold over the past 10 years to 1.1kb/d. As a result, the boost to monthly output from new wells—the number of drilled rigs times new well output per rig—still more than offsets the growing hit to output from declining legacy wells (Exhibit 8).

Exhibit 8: An Increasingly Negative Contribution to Permian Crude Growth From Legacy Wells

8. An Increasingly Negative Contribution to Permian Crude Growth From Legacy Wells. Data available on request.
We estimate the contribution from new wells as the change in Permian crude production minus the EIA Drilling Productivity Report estimate of the contribution from legacy wells.
Source: EIA, Haver Analytics, Goldman Sachs Global Investment Research
In turn, Permian new well output per rig is still trending higher because of:
  1. A rise in the number of drilled wells per rig given progress in multi-well pad technology

  2. A structural rise in the average lateral well length to 10,000 feet[4] (Exhibit 9)

  3. A boost to output per rig through a composition effect arising from the larger drop in less productive private rigs (“high grading”). The output per rig in 2022 was nearly 2.5 times greater for public rigs than for private rigs since public firms account for over 60% of production, but under 40% of rigs (Exhibit 10).

Exhibit 9: A Structural Rise in Permian Lateral Well Length

9. A Structural Rise in Permian Lateral Well Length. Data available on request.
Source: Enverus, Goldman Sachs Global Investment Research

Exhibit 10: The Drop in Rigs Over the Past Year Has Been Concentrated Among Private Producers

10. The Drop in Rigs Over the Past Year Has Been Concentrated Among Private Producers. Data available on request.
Source: Enverus, S&P, Goldman Sachs Global Investment Research

Capital Discipline, Consolidation, and Higher Rates

6. Are US producers still capital disciplined?
Yes, three pieces of evidence show that the US upstream sector remains capital disciplined.
First, US public independent firms are sticking to the moderate single digit growth targets they announced in 2020-2021. As Exhibit 11 shows, we expect crude production growth by the independent US E&Ps under GS coverage to slow from around 235kb/d (or 7%) in 2023 to 135kb/d (4%) in 2024, and just around 90kb/d (2.5%) in 2025. That companies continue to guide to slower growth despite the 2022H1 and the summer 2023 upswing in prices is the essence of capital discipline, and the main driver of the reduction in supply elasticity. These lower growth targets reflect investors’ scarring 2014-2020 experience when excessive growth depressed returns, and growing concerns about inventory quality.

Exhibit 11: A Slowdown in Crude Production Growth by Public E&Ps Covered to Just 90kb/d (2.5%) in 2025

11. A Slowdown in Crude Production Growth by Public E&Ps Covered to Just 90kb/d (2.5%) in 2025. Data available on request.
Source: Company data, Goldman Sachs Global Investment Research
Second, reinvestment rates—capex as a share of operating cash flow—of public producers remain in a 40-60% range, well below the historical average (Exhibit 12, left panel). The 2022-2023 pickup in capex reflects that the 2020-2021 levels were likely unsustainably low, and the boost to nominal capex measures from rapid cost inflation (Exhibit 12, right panel).
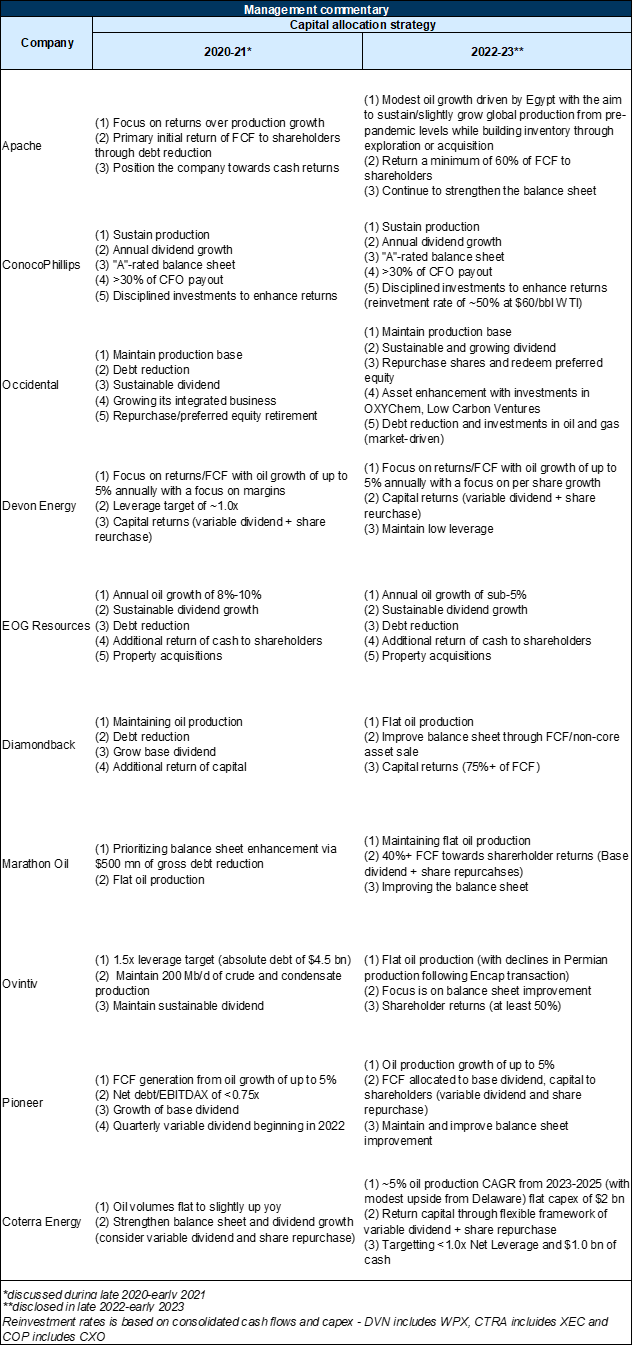
Third, broader capital allocation strategies of public E&Ps remain focused on limiting leverage and returning cash to shareholders (see Appendix Exhibit 18). To illustrate further, equity (rather than debt) is now typically used to fund acquisitions (as for ExxonMobil-Pioneer).

Exhibit 12: Reinvestment Rates and Capex Levels Remain Low

12. Reinvestment Rates and Capex Levels Remain Low. Data available on request.
Source: Haver Analytics, Company data, Goldman Sachs Global Investment Research
7. What are the implications of consolidation for US supply growth?
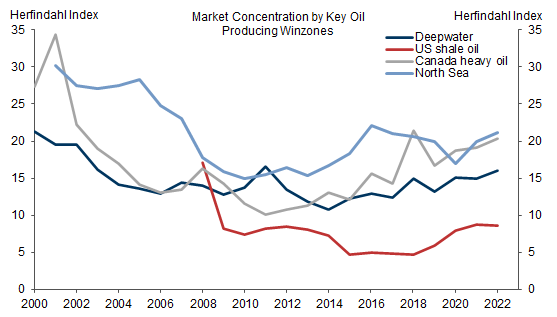
The Exxon-Pioneer deal is accelerating a consolidation phase in US shale, which started in 2020, but which was already well underway across other regions (Exhibit 13). Our equity analysts expect US shale to consolidate further given the potential for cost restructuring.

Exhibit 13: US Shale Has Joined the Global Consolidation Trend

13. US Shale Has Joined the Global Consolidation Trend. Data available on request.
Source: Goldman Sachs Global Investment Research
Consolidation will likely not have a large effect on trend US production growth. The fact that combined production is guided moderately higher than where Pioneer and Exxon were individually guiding their growth suggests that industry consolidation may increase trend growth slightly.
Consolidation will likely further decrease the price elasticity of US supply through two channels. First, market share losses for private producers (who tend to be more price elastic, see Exhibit 16) at the expense of inelastic public producers lower the price elasticity. In fact, the share of private firms in US Lower 48 crude supply has dropped from 60% in 2011 to 37% today. Second, potential efficiency gains and cost savings[5] would push several US projects to the lower end of the cost curve, where firms are less price-elastic.
8. How do high interest rates and tighter credit conditions affect US supply?
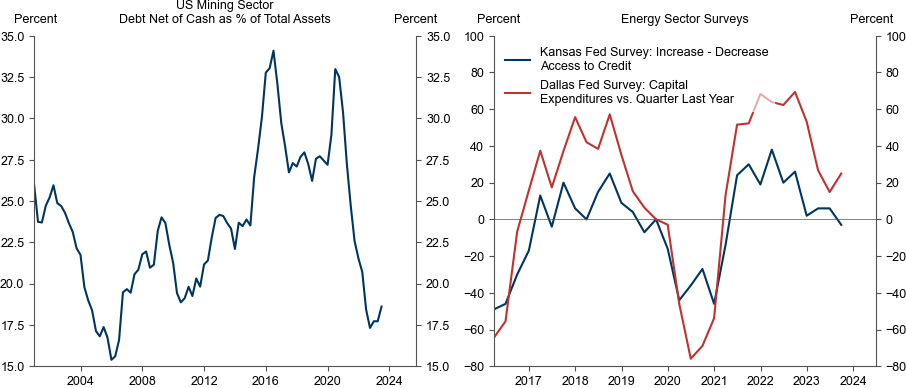
High interest rates and tighter credit conditions will likely only modestly weigh on supply, with effects largely limited to small private firms for three reasons.
First, the sector is in a strong position to fund capex with high cash levels and cash flows, and low leverage (Exhibit 14, left panel). Second, Fed surveys show that energy firms are investing more than a year ago, and that access to credit is broadly unchanged (Exhibit 14, right panel). The Dallas Fed June 2023 survey showed that 24% of small E&Ps and only 8% of large E&Ps identified a significant impact of tighter credit conditions since February 2023. Third, the impact of moves in interest rates on hurdle rates used in practice tends to be far below one-to-one.

Exhibit 14: Low Leverage; Stable Access to Credit; Higher Capex

14. Low Leverage; Stable Access to Credit; Higher Capex. Data available on request.
Source: Federal Reserve, Haver Analytics, Goldman Sachs Global Investment Research

The US Supply Response to Oil Prices

9. What is the key criterion for US private and public producers to decide whether to raise/lower production in response to oil prices? Is the supply response non-linear in price?
Private producers typically drill wells if the internal rate of return (IRR) on the incremental well after properly allocating costs exceeds the required hurdle rate.
Public producers generally have sticky growth targets, but are price elastic to the downside, and shut in wells in 2020 when oil prices dropped below operating expenses (plus the option value of preserving inventory). Public producers are slightly elastic for intermediate oil price levels by nudging up output to the upper end of their growth range when prices are high. However, public producers become essentially inelastic for very high prices as the growth target is then met.[6]
10. What breakeven prices do US producers face? And what price leads to a substantial increase in drilling?
There is no such thing as the breakeven price because it varies 1) across producers and basins, 2) with natural gas and NGL prices (and the mix across these products), and 3) with the hurdle rate.
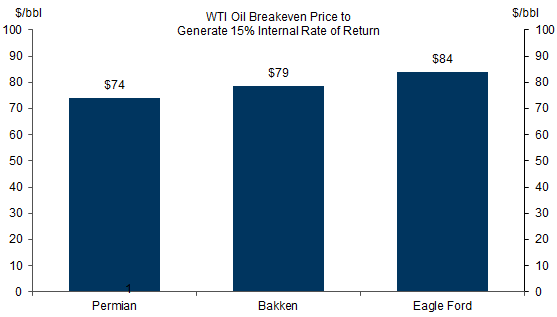
Using detailed project-level valuation models, our equity analysts estimate a WTI oil breakeven price of around $80/bbl (Exhibit 15). We assume a Henry Hub natural gas price of $3.5/MMBtu, a $28/bbbl NGL price, and an internal rate of return of 15%. The WTI breakeven estimate is somewhat lower for the Permian ($74/bbl) than for the Bakken ($79/bbl), and Eagle Ford ($84/bbl).

Exhibit 15: The WTI Oil Breakeven Price Is Around $80/bbl

15. The WTI Oil Breakeven Price Is Around $80/bbl. Data available on request.
Assumes $3.50/MMBtu Henry Hub gas price and $28/bbl NGLs price.
Source: Enverus, Company data, Goldman Sachs Global Investment Research
The latest Kansas City and Dallas Fed energy surveys find an average WTI price firms need to profitably drill a new well of $64/bbl (2023Q3) and $62/bbl (2023Q1), respectively. Because this “profitable price” may not allow meeting a realistic hurdle rate, we put more weight on our own estimates in Exhibit 15 and the Kansas City estimate that substantially increasing drilling requires a $90/bbl WTI price.
11. How has the supply elasticity changed over time? And how does it differ between public and private firms?
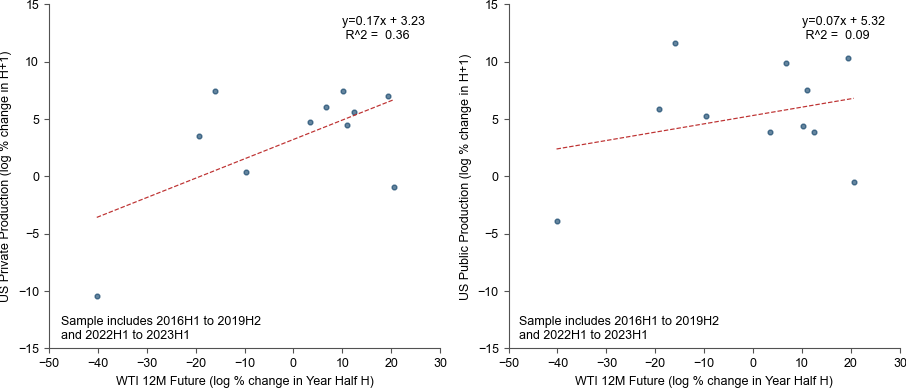
We have shown previously that the supply elasticity of US supply has fallen significantly since around 2016 reflecting capital discipline. Using S&P data on crude production by firm type, we also estimate that the supply elasticity is 2 to 3 times smaller for public firms than for private firms (Exhibit 16). We believe that output is the most elastic for small private producers.

Exhibit 16: Public Firms Appear Less Price Elastic Than Private Firms

16. Public Firms Appear Less Price Elastic Than Private Firms. Data available on request.
Source: S&P, GS Plottool, Goldman Sachs Global Investment Research
12. How much does US supply rise for a 10% rise in oil prices?
We estimate that a 10% rise in oil prices boosts US liquids supply by around 1%, which corresponds to 200kb/d today. This estimate is the median across five approaches: the top-down supply regressions (Exhibit 5), regressions for public and private firms (Exhibit 16), an update of estimates by our equity research colleagues, our analysis of the surprises in 2022 to prices and supply (accounting for bottlenecks), and our earlier top-down energy capex regressions.

Exhibit 17: We Estimate a 1% or 200kb/d Boost to US Liquids Supply From a 10% Oil Price Increase

17. We Estimate a 1% or 200kb/d Boost to US Liquids Supply From a 10% Oil Price Increase. Data available on request.
Source: IEA, S&P, ICE, Goldman Sachs Global Investment Research
13. What are the key implications?
We see two takeways.
First, our analysis of Permian fundamentals and ongoing capital discipline support our forecasts that US liquids supply growth will slow in 2024 to 0.6mb/d on an annual average basis (vs. 1.4mb/d in 2023), and that falling inventories will push Brent to $100/bbl by June 2024.
Second, our estimated supply elasticity of 0.1 implies that the US supply response to higher prices caused by any geopolitical supply shock would offset only about 20-25% of the initial volume shock, and with a delay of about two quarters. For instance, our pricing framework implies a direct boost to oil prices from a potential 1mb/d drop in supply for one year of $12/bbl, which would in turn boost US supply by around 0.2-0.25mb/d. The fact that additional US supply would absorb only 20-25% of the volume shock underscores the key role of OPEC to balance the market. While core OPEC countries currently have nearly 4mb/d of spare capacity, any potential physical or political barriers to deploying this spare capacity are the key upside risk to oil prices.

Appendix

Exhibit 18: US Public E&Ps Stay Focused on Returning Cash to Shareholders

18. US Public E&Ps Stay Focused on Returning Cash to Shareholders. Data available on request.
Source: Goldman Sachs Global Investment Research
  1. 1 ^ The IEA defines total liquids as the sum of crude oil (including condensates), natural gas liquids, and nonconventional oils.
  2. 2 ^ Short-cycle fields are not limited to the US. There are also tight oil projects—which can be extracted from shale formations, sandstone and carbonates—in Canada, Argentina, and China.
  3. 3 ^ Canada’s Montney shale field has a low oil-to-gas ratio, and Argentina’s Vaca Muerta shale oil is pumped by larger producers with stickier output plans.
  4. 4 ^ ExxonMobil discussed drilling "industry-leading longer laterals (up to 4 miles)", which corresponds to 21,120 feet, in the October 11th presentation updating investors on the deal with Pioneer.
  5. 5 ^ Exxon believes it can drive $2 bn of synergies beginning in the second year post-closing, the bulk of which is through capital efficiency benefits (improved resource recovery driving 2/3 of the improvement and 1/3 from capex and opex synergies) as well as incremental G&A savings.
  6. 6 ^ The elasticity of large private producers is between the low elasticity of public producers and the high elasticity of small private producers. As public producers, large private producer want to preserve inventory to protect exit options.

Investors should consider this report as only a single factor in making their investment decision. For Reg AC certification and other important disclosures, see the Disclosure Appendix, or go to www.gs.com/research/hedge.html.