Earlier this year, we estimated that the efficiency gains promised by generative artificial intelligence (AI) could provide a significant boost to global labor productivity. While considerable uncertainty remains about the timing and magnitude of AI’s effects, our baseline expectation is that generative AI will affect productivity within our ten-year forecast horizon. We are therefore upgrading our global GDP forecasts from 2027 onwards to incorporate the impact of generative AI.
Productivity gains map one-to-one to GDP if workers are not permanently displaced and the capital stock increases to match productivity improvements, so—if taken at face value—our baseline estimates would imply a 10-15% cumulative long-run boost to GDP globally. In practice, the net effect of generative AI on GDP is likely to be smaller for two reasons.
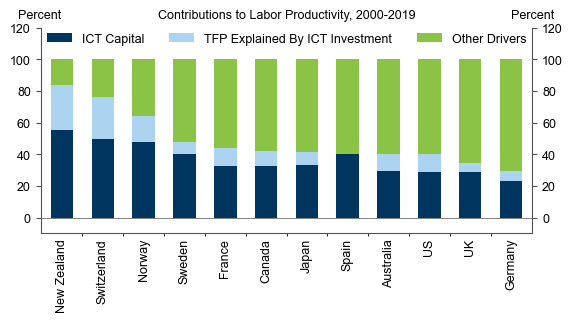
First, if viewed as the “next wave” of technological innovation, the growth impact of generative AI may not be fully additive to the current GDP trend. Information and communication technology (ICT) has recently driven almost half of labor productivity growth in DM economies—reflecting both increased ICT investment and complementarities with existing inputs—so some AI-related gains may substitute for growth that would otherwise occur in a non-AI baseline.
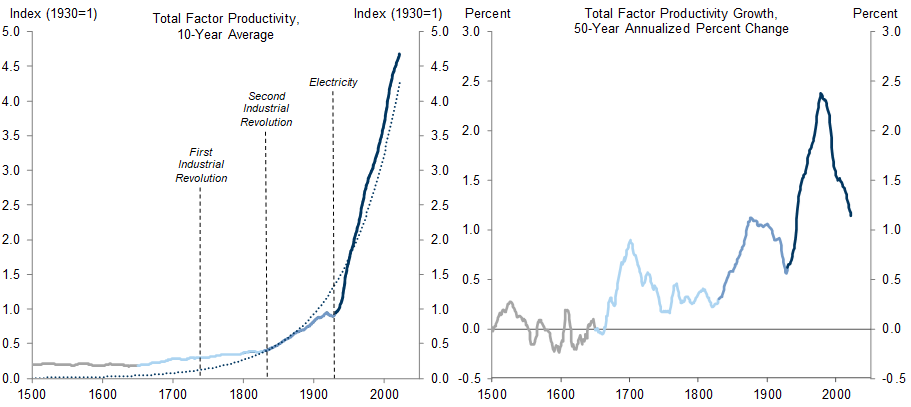
Second, underlying productivity growth has slowed, with recent research suggesting that near-term total factor productivity grows linearly, with an occasional step-up following technological regime shifts, rather than exponentially. Unless AI ushers in a new productivity growth regime—an outcome that is possible but premature to forecast—the boost we anticipate from generative AI may be partially offset by an underlying growth slowdown.
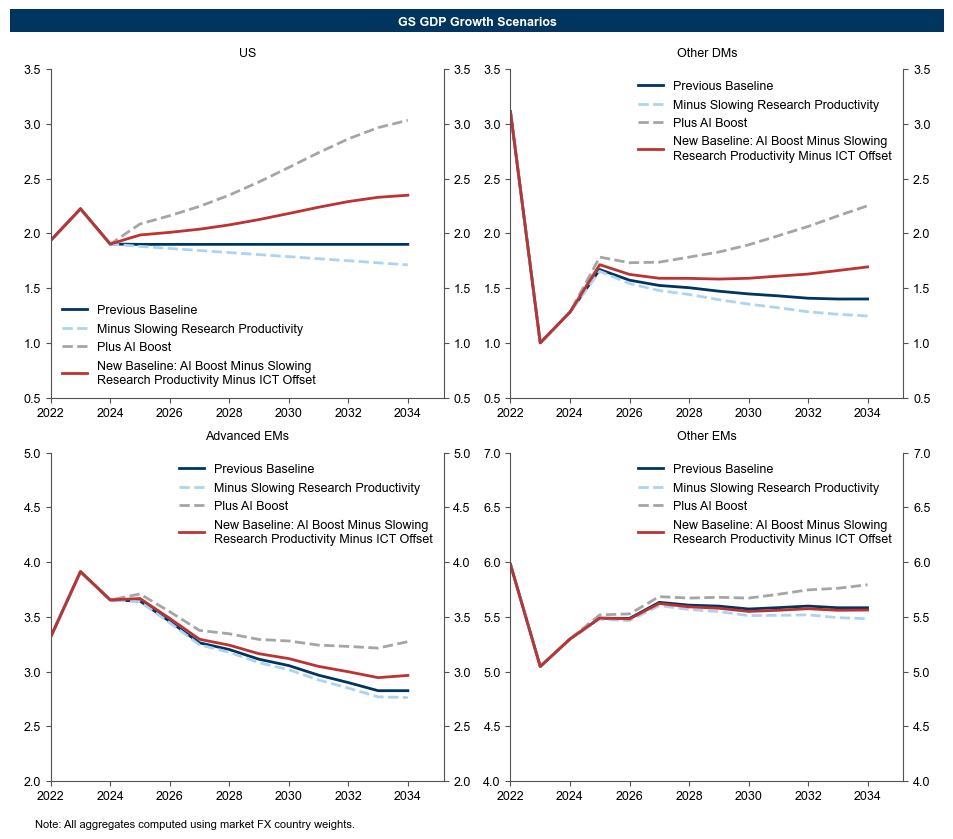
In addition, barriers to adoption may delay productivity growth even if the full efficiency gains we see as possible are ultimately realized. Based on historical productivity gains following technological breakthroughs, commentary from business leaders, and cross-country technology adoption patterns, we anticipate that any GDP growth boost won’t exceed 0.1pp until 2027 in the US, 2028-2032 in other DMs and advanced EMs, and 2034 or later in other EMs.
Nevertheless, the enormous economic potential of generative AI suggests growth upside even after taking these offsets into account. In the coming weeks, we will therefore raise our growth forecasts in the second half of our ten-year forecast horizon as part of our 2024 outlooks, including by 0.4pp in the US, by 0.2-0.4pp in other DMs, and 0.1-0.2pp in advanced EMs by 2034.
Upgrading Our Longer-Run Global Growth Forecasts to Reflect the Impact of Generative AI
The Enormous Economic Potential of Generative AI
Exhibit 1: A Large Share of Work Is Exposed to AI-Driven Automation
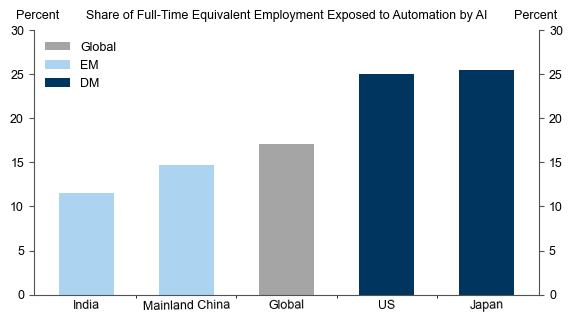
Exhibit 2: The Scale of the Productivity Boom Is Potentially Large but Uncertain
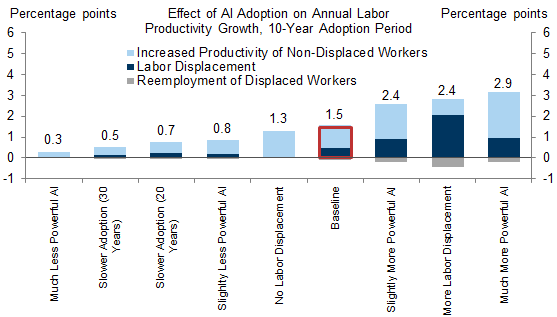
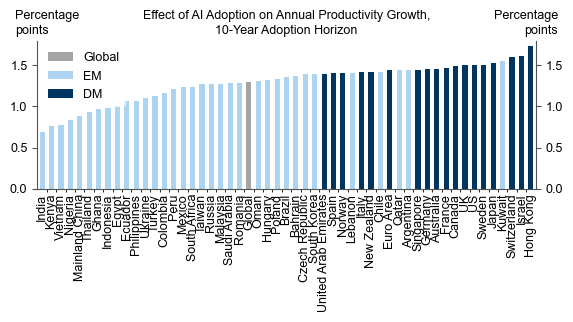
Exhibit 3: We Estimate a 1.3pp Boost to Global Productivity Growth Over a 10-Year Horizon
The Next Wave of Technology-Driven Automation
Exhibit 4: ICT Investment Is Associated with Higher TFP Growth
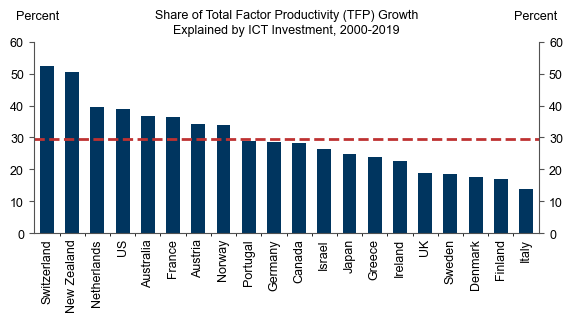
Exhibit 5: Advances and Investment in ICT Have Driven 40% of Labor Productivity Growth Since 2000, and May Partially Overlap With Our Productivity Growth Estimates
A Slowing Ex-AI Productivity Growth Trend
Exhibit 6: A Linear Model Provides a Better Statistical Fit of Productivity Growth Over Recent Decades
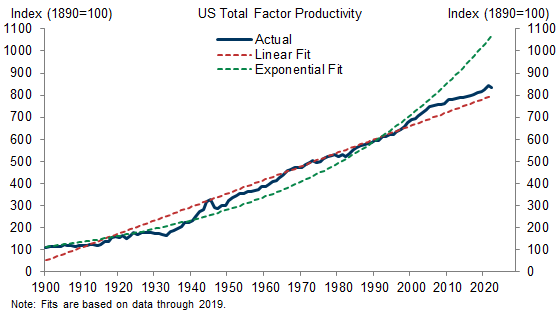
Exhibit 7: The Observed Slowdown in Productivity Growth May Be Explained by Decreasing Returns to R&D
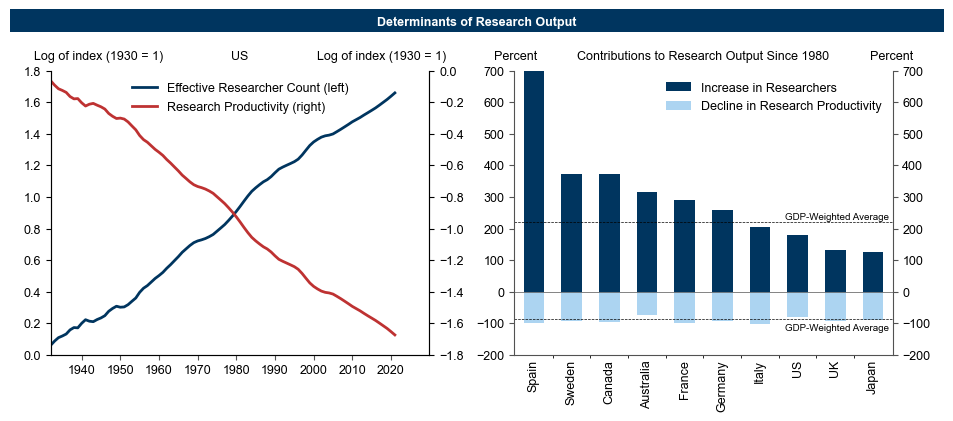
Exhibit 8: Long-Run Productivity Data Points Toward an Initial Jump and Subsequent Slowdown Following Technological Breakthroughs
A Cautious Adoption Outlook
Exhibit 9: Productivity Gains Tend to Lag Technological Breakthroughs
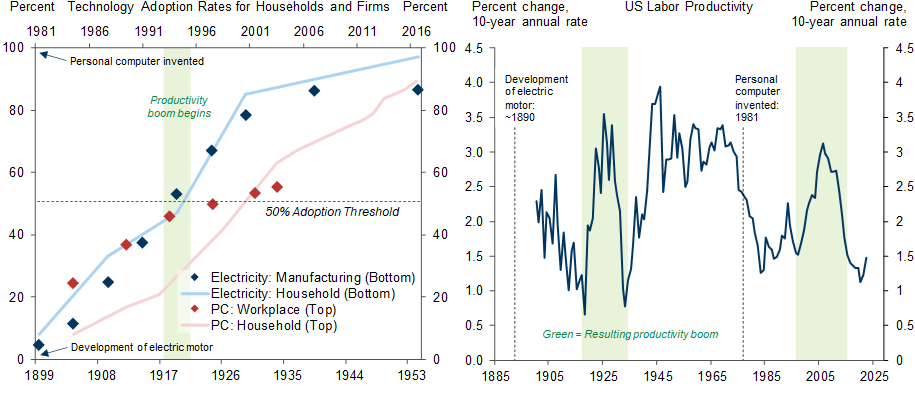
Exhibit 10: Business Leaders Expect a Somewhat Slow Adoption
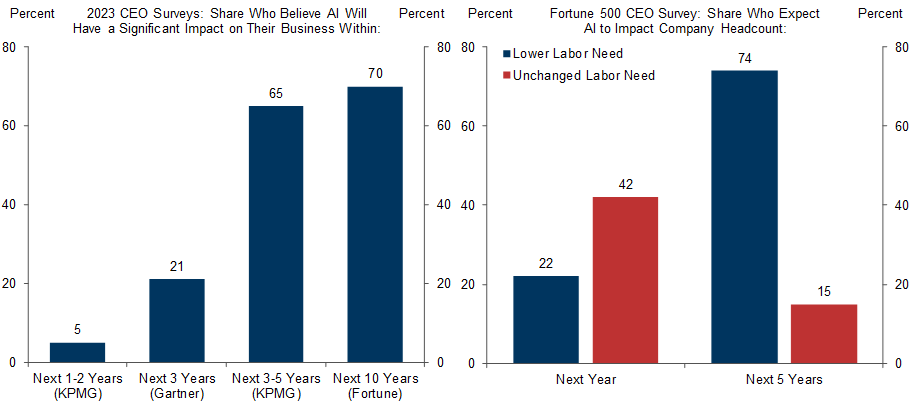
Exhibit 11: Technology Adoption Rates Vary Widely, but DMs Consistently Lead EMs
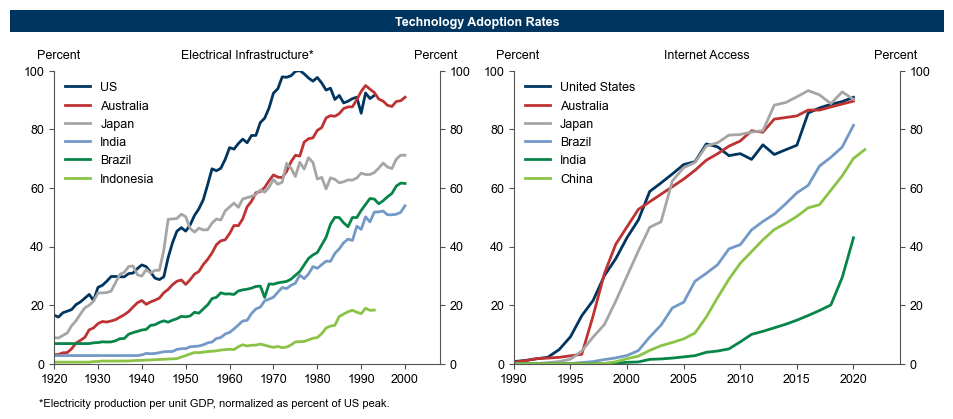
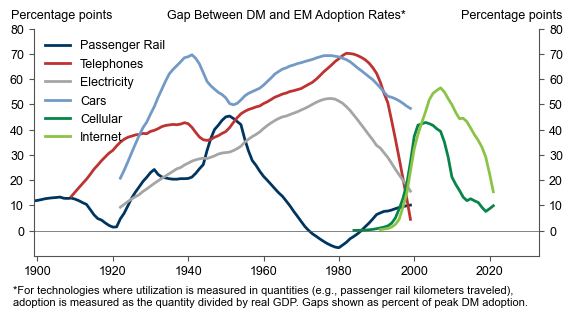
Exhibit 12: The Absolute and Relative Gap Between DM and EM Adoption Rates Has Been Shrinking
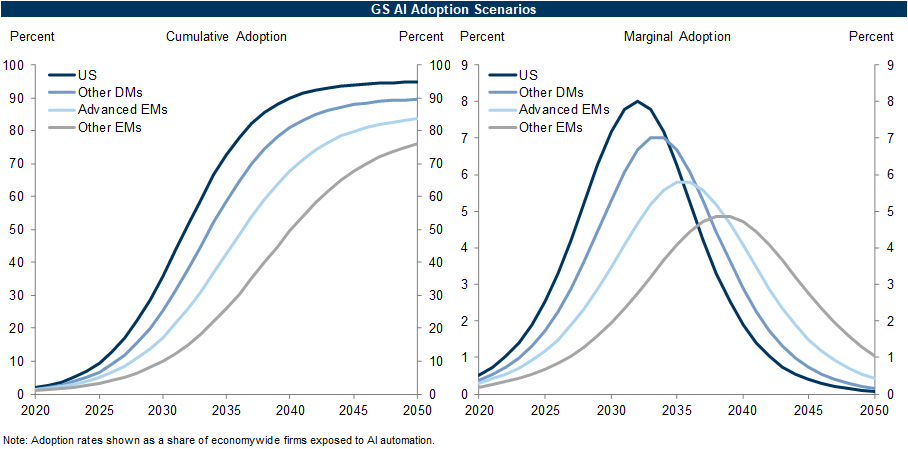
10% of US firms will adopt generative AI by 2025, with firms in other DMs and advanced EMs (e.g., China, Brazil) closely following in 2026 and 2027. We expect firms in other EMs to lag further, reaching 10% adoption in 2029.
We estimate (based on calibration to recent ICT adoption rates, and assuming moderate further declines in adoption lags) that it will take 13 years for the middle 80% of adopting US firms to incorporate AI, and slightly longer intra-country adoption lags of 14, 16, and 18 years for other DMs, advanced EMs, and other EMs respectively.
The terminal rate of adoption (as a share of economywide firms that have some exposure to AI) will range from 80-95%, with the US on the high end and other EMs on the lower end.
Exhibit 13: Our Stylized Scenarios Suggest that the Marginal Rate of AI Adoption Will Accelerate to its Peak in the 2030s
Updating Our Longer-Run Global Growth Forecasts
In a counterfactual without AI, growth will slow linearly through the end of our forecast horizon, on average by 0.15pp across economies (the rate of slowing in the year-over-year growth rate over the next decade that would be implied by a locally linear, rather than exponential, total factor productivity trend).
The cumulative level boost to productivity that we have estimated from AI will be fully realized, but not necessarily over 10 years. For example, if we estimate a 1pp boost to productivity growth over 10 years, that implies a roughly 10% increase in productivity levels, which could instead realize as a (10/N)pp boost to productivity growth over any number of N years.
However, this level boost will be offset by a full replacement of the ICT contribution to productivity growth for all of the years in which AI adoption is increasing from 10% to 90% of its terminal level (13-18 years, depending on country). Continuing with the above example, if ICT contributes 0.2pp to annual growth, and increasing adoption from 10 to 90 percent takes 15 years, we would subtract 3% from the cumulative level boost from AI, and distribute the remaining 7% upside to productivity levels over the adoption timeline we have estimated.
As noted in the previous section, we distribute the overall GDP increase from AI over our forecast window based on the marginal adoption timeline of AI, but accounting for an additional intra-firm lag of 5-10 years for productivity gains to realize.
Exhibit 14: After Accounting for Offsets, We Expect a Moderate Boost to GDP Growth in the US and Other DMs and a Smaller Boost to Advanced EMs in the Second Half of Our Forecast Horizon
Joseph Briggs
Devesh Kodnani
Appendix
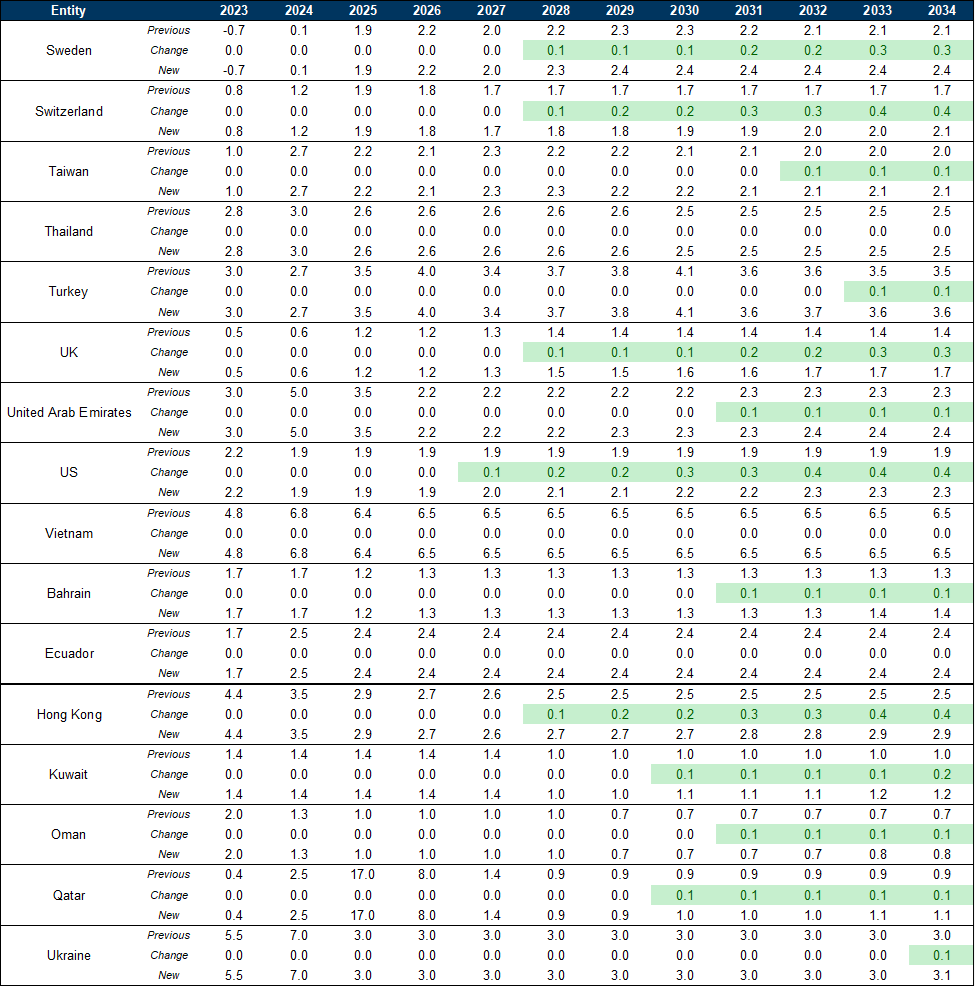
Detailed Summary of GDP Growth Upgrades From Generative AI (1/3)
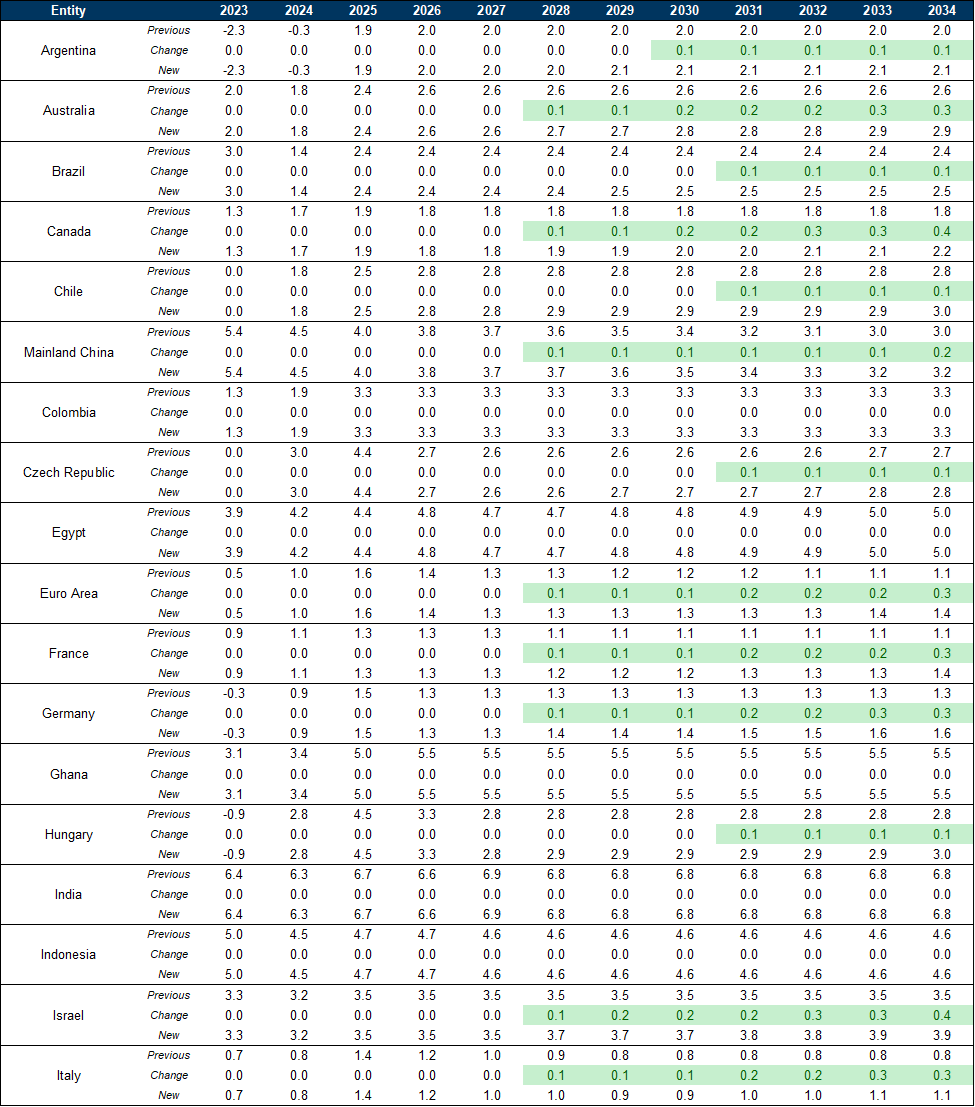
Detailed Summary of GDP Growth Upgrades From Generative AI (2/3)
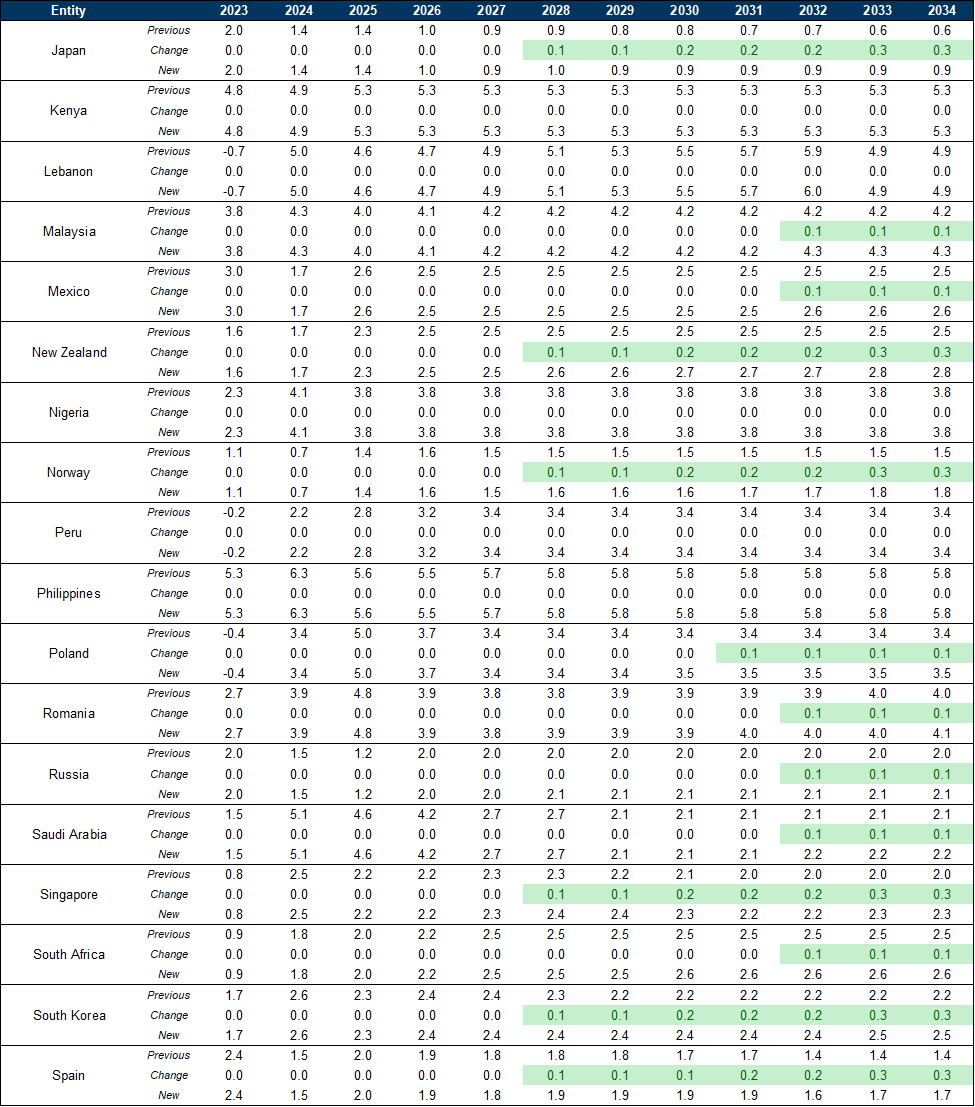
Detailed Summary of GDP Growth Upgrades From Generative AI (3/3)
- 1 ^ In our original report, we combined our detailed occupational exposures into sector-level AI exposures, then extended them to a wider set of countries using the Groningen Growth and Development Center’s Economic Transformation Database (which standardizes the sectoral composition of employment across several DM and EM economies). We also conservatively assumed that AI would not boost agricultural productivity in EMs. In this report, we extend those estimates to all countries in our economics coverage using a regression model which predicts country-level AI productivity exposure using GDP per capita, the services share of GDP, the agriculture share of GDP, adult literacy rates, and whether the country is a DM or EM economy. This model predicts over 80% of the variation in our original country-level estimates.
- 2 ^ Bloom, Nicholas, Charles I. Jones, John Van Reenen, and Michael Webb. "Are ideas getting harder to find?." American Economic Review 110, no. 4 (2020): 1104-1144.
- 3 ^ Brynjolfsson, Rock, and Syverson (2021). “The Productivity J-Curve: How Intangibles Complement General Purpose Technologies.” American Economic Journal: Macroeconomics, Vol. 13, No. 1, pp. 333-372. https://www.aeaweb.org/articles?id=10.1257/mac.20180386
Investors should consider this report as only a single factor in making their investment decision. For Reg AC certification and other important disclosures, see the Disclosure Appendix, or go to www.gs.com/research/hedge.html.