United States/North America
A sharp yield reversal based on a trio of factors. UST yields declined sharply over the course of the week—the benchmark 10y yield, which was only 5bp below its recent high as of last Tuesday’s close is now over 40bp lower. The move appears to confirm our view that bonds were oversold and yields were close to the upper end of their new range (for example, see here and here). This move lower was aided by a trio of factors. First, the refunding meeting suggested less duration supply was in the offing relative to what many investors expected (more on this below). We have been of the view for a while now that investors were overestimating the effects of supply on market-clearing yield levels, and the dominance of price-sensitive marginal investors meant more volatility in longer term bond yields with swings in the macro outlook rather than simply higher yields. Second, following last month’s strong economic momentum, macro data have finally begun to show signs of cooling—both ISM reports and the labor market report surprised to the downside. Third, we think positioning was somewhat short in at least a portion of the investor base, particularly at the long end (we do think there are substantial structural overweights at shorter maturities). One reason we suspect this to be the case is that the magnitude of market moves both on the way up, and now on the way down, are exaggerated relative to the size of information surprises—we had previously noted the rising odds of a sharp reversal alongside a continued extension of the selloff.
Exhibit 1 shows our estimated PCA-based decomposition of the yield declines from their recent peak by macro factor. The weaker economic data shows up in the growth factor, and both the supply news and the marginal dovish FOMC meeting show up in the policy factor. We attribute the downside residual to positioning. Looking ahead, we suspect there could be some further room for the rally extend as investors feel their way to the bottom end of the new range, particularly if supported by softer economic data, but we suspect the yield floor of this range is materially higher than when the selloff began over summer. At the front end, we believe investors are again starting to price too much easing, and we would look to fade the move if it extends much further.
Exhibit 1: A sizable portion of recent yield declines is attributable to slowing growth, with the policy factor explaining the bulk of the remainder
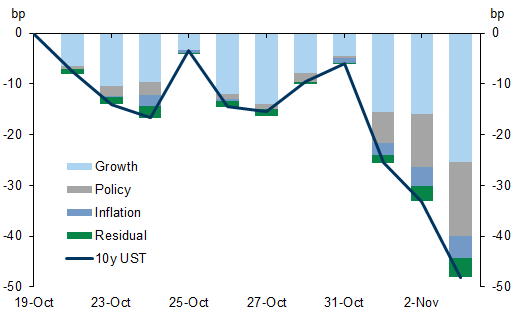
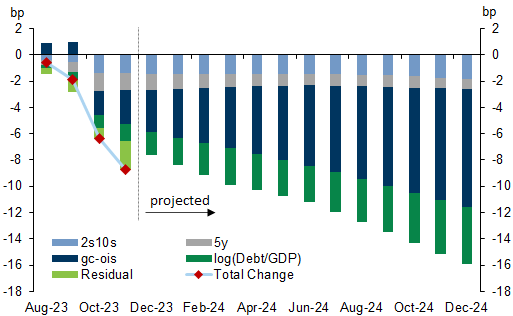
Exhibit 2: The material tightening of swap spread since August can be largely explained by both higher funding costs and increased supply
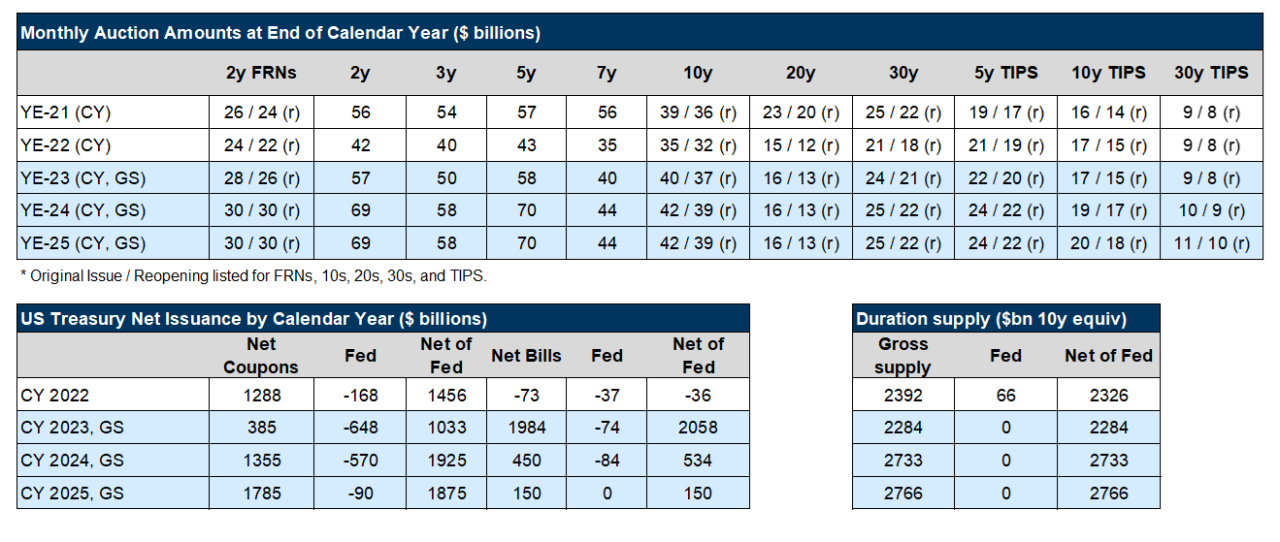
Lower duration supply projection bull flattens the yield curve. On Wednesday, Treasury published its auction size plans for the Nov-23–Jan-24 quarter as part of its refunding process. The announcement appears to have surprised the market by slowing the pace of increases at long tenors, with 10s and 30s increasing by $1bn (compared to $2bn increase last cycle) and 20s unchanged (versus $1bn increase last cycle). We had flagged this possibility previously given the amount of term premium that had built up on that part of the curve, though we hadn’t anticipated an unchanged 20y issuance path. Still, we had expected larger reductions in the pace of increases elsewhere, and on net, duration supply measured in 10y equivalents ended up in line with our projection, but below consensus. The yield curve bull flattened after the announcement, but the magnitude of the move appears disproportionate to the historical beta, possibly on account of positioning. We were surprised by Treasury’s intention to keep cash balance targets at $750bn—a level we believe is higher than necessary given the costs—for the next two quarters. This higher cash target implies larger bill issuance in 4Q23 (~$420bn) than we previously estimated, though we expect bill supply to decline materially beyond the first quarter of next year. At the February 2024 refunding meeting, we expect an additional round of auction size increases, at a similar pace as the current cycle, after which we believe sizes will remain stable for some time.
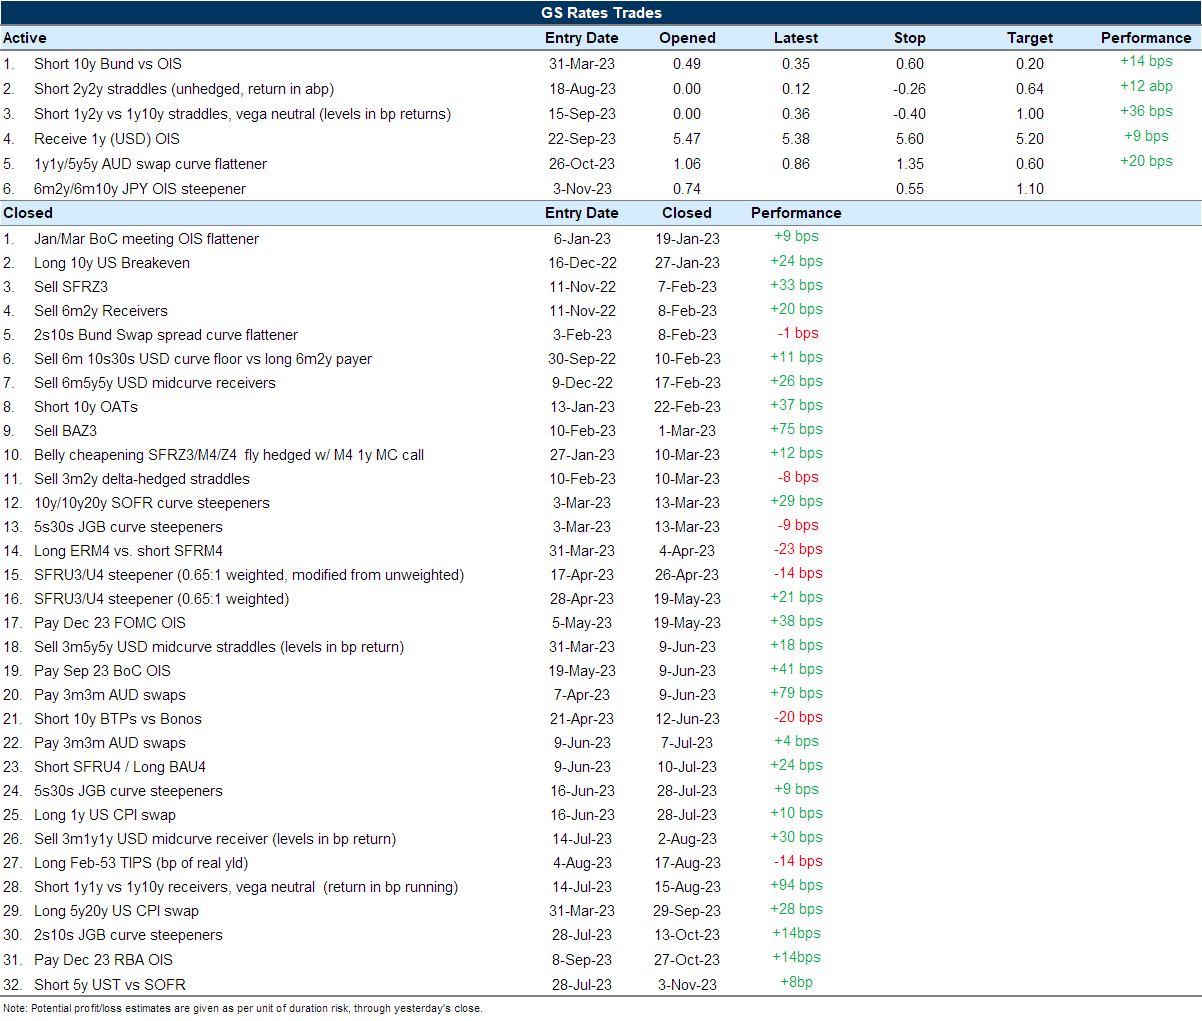
Swap spreads tighten appreciably, but more to come. Over the past few weeks, swap spreads have narrowed meaningfully—our short 5y UST vs SOFR spread trade has tightened by over 8bp since initiation in late July. A decomposition using our equilibrium model for swap spreads suggests that over half of this move can be attributable to the rise in funding costs (GC-OIS widened ~4bp over October) as demand for funding has risen, while supply effects from the ramp up in Treasury issuance since July has contributed to around a quarter of the narrowing in swap spreads (Exhibit 2). Both headwinds are set to continue over the coming quarters—we expect funding spreads to widen further next year alongside QT and fading cash buyer demand, and the ramp up in Treasury issuance is also set to continue for at least one more refunding cycle, leaving duration supply at its most elevated level since 2021. Our model suggests 5y swap spreads will tighten to around -40bp by end-2024 based on these factors. In the very near term however, softer data and renewed concerns about larger downsides could support a bid to 5y USTs. That fact, in conjunction with a residual that suggests the tightening may have locally overshot, leads us to take profits on the swap tightener trade, with the idea of re-engaging once we are past the deceleration in data.
European Rates
From ECB hikes to cuts—weak nominal growth skews EUR yield lower. Data has continued to come in on the softer side in Europe this week, both with respect to prices—with HICP down 1.4pp to 2.9%—and activity, given the slightly negative Q3 GDP reading. Our analysis suggests that over recent months, front-end rates have moved further than broader growth and inflation pricing would imply, suggesting the market is extrapolating from spot data and pricing the risk of worsening growth and labor market conditions. Given the historical record, where recessions have triggered meaningful easing across the G10, including the ECB (Exhibit 3), we can see why front-end rates are trading below levels our fundamental forecasts would imply. However, with the risk of substantial rate cuts from the ECB being increasingly priced by the market, particularly in 2H 2024, we think HICP forwards are too high to justify that easing. This is because, while they appear broadly fair against our market factors, at 2.35% at the 2y2y point, they are inconsistent with the low-growth, low-inflation environment that would justify rapid ECB easing.
Exhibit 3: Average magnitude of easing is larger when growth is clearly negative
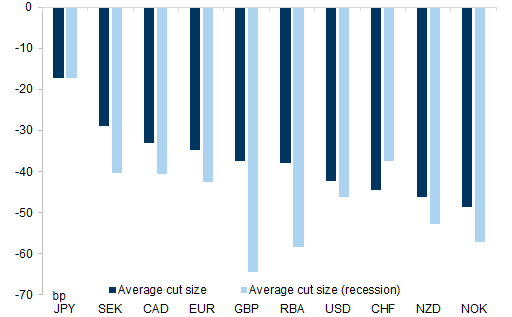
Exhibit 4: Japan has been steadily divesting from most EGBs
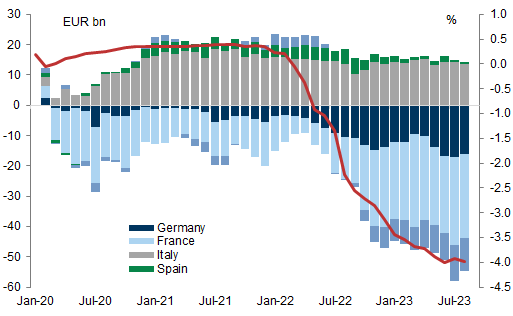
Japanese demand for EGBs already muted, unlikely to rise. On the back of ongoing—if slow-moving—policy normalization out of Japan, we continue to expect higher JGB yields to act as a headwind for EGBs. In a previous report, we had highlighted that OATs stood the most to lose from reduced purchases out of Japan, given the historically strong sponsorship from that investor base. And as we show in Exhibit 4, that view has largely played out, with Japanese investors reducing exposure to French government bonds on net about €30bn since early 2020. We also note that this shift in flows reflects the coincident changes in the effective yield of EGBs net of FX hedging costs, which fell significantly as G10 yields curve flattened. This suggests that any further abrupt shifts in Japanese ownership of EGBs are unlikely. However, until this effective yield increases and becomes more attractive vs JGBs, demand for EGBs from Japanese investors will be muted. This is relevant because even as deficits are due to narrow slightly next year in Europe, there is still a significant degree of fiscal expenditure in cyclically-adjusted terms (Exhibit 5).
BoE happy to hold. The November MPR proved largely uneventful: the BoE kept the Bank rate unchanged and reiterated a tightening bias, with the additional guidance that the “latest projections indicate that monetary policy is likely to need to be restrictive for an extended period”. Staff projections for inflation were also revised up, given the judgment of a weaker outlook for supply growth challenging labor market rebalancing. While the above can be seen as hawkish at the margin, the MPC also reiterated a data-dependent approach, and appeared keen to preserve optionality due to projections also showing lackluster growth for an extended period. Following the meeting, our economists have maintained their baseline of no additional hike by the BoE. With a still building policy drag—in particular through the housing sector—they also continue to expect the Bank to deliver its first easing relatively early, in 3Q24. Due to higher levels of inflation and wages, the UK curve is still upward sloping at the very front-end, despite the BoE’s track record of delivering the fastest cuts on average during periods of recession (Exhibit 3). Amid downside risks to growth in the UK, we think there is room for UK yields and curve shape to catch down towards the US and Europe.
Exhibit 5: Cyclically-adjusted spending is still high in Europe
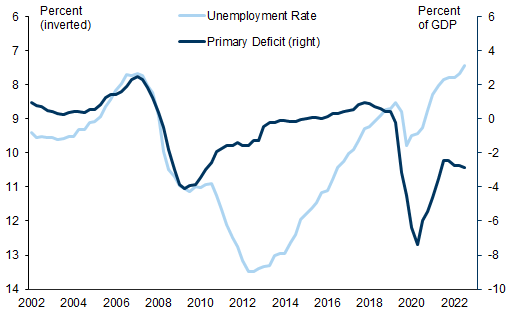
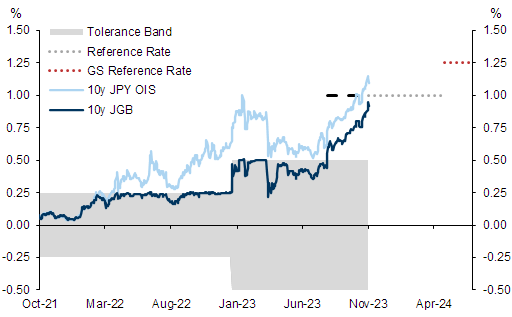
Exhibit 6: We expect long-end JGB yields to rise next year
Other G10 Markets
BOJ’s YCC tweak should further steepen yield curve. The BOJ delivered another tweak to its YCC program this week by suspending daily fixed rate operations on 10y JGBs, and shifting to a more “nimble” approach to regard the 1.0% level for JGBs “as a reference in its market operations”, which we interpret as a softer ceiling rather than a hard stop. That said, while Governor Ueda confirmed that some drift higher in rates reflecting fundamentals will be allowed, he also noted that “speculative rise” in interest rates above 1% would be tamped by nimble operations, and the BOJ’s bond purchases on the day following the meeting appears consistent with this limited tolerance for sharp moves in yields. Looking ahead, our economists now expect the BOJ to further raise the reference rate on 10y JGBs in April 2024 (to 1.25%; Exhibit 6), before exiting NIRP in October 2024 on receiving enough confirmation of a ‘virtuous cycle’ between price inflation and wage growth, though we expect the latter will be more gradual than current market pricing. Broadly we think markets are underpricing the potential for 10y yields to set higher—we expect investors will test the new reference levels—and overpricing both the speed and magnitude of policy rate increases at the front end. As a result, we recommend adding 6m2y/6m10y JPY OIS swap curve steepeners. We like expressing the steepener in swap space because 2y swap spreads appear relatively wide, while 10y spreads are closer to the recent tights. The trade carries modestly positively, largely on account of the risk premium for additional tightening at the front end.
Latest Thematic Research:
Latest Global Markets Dailies:
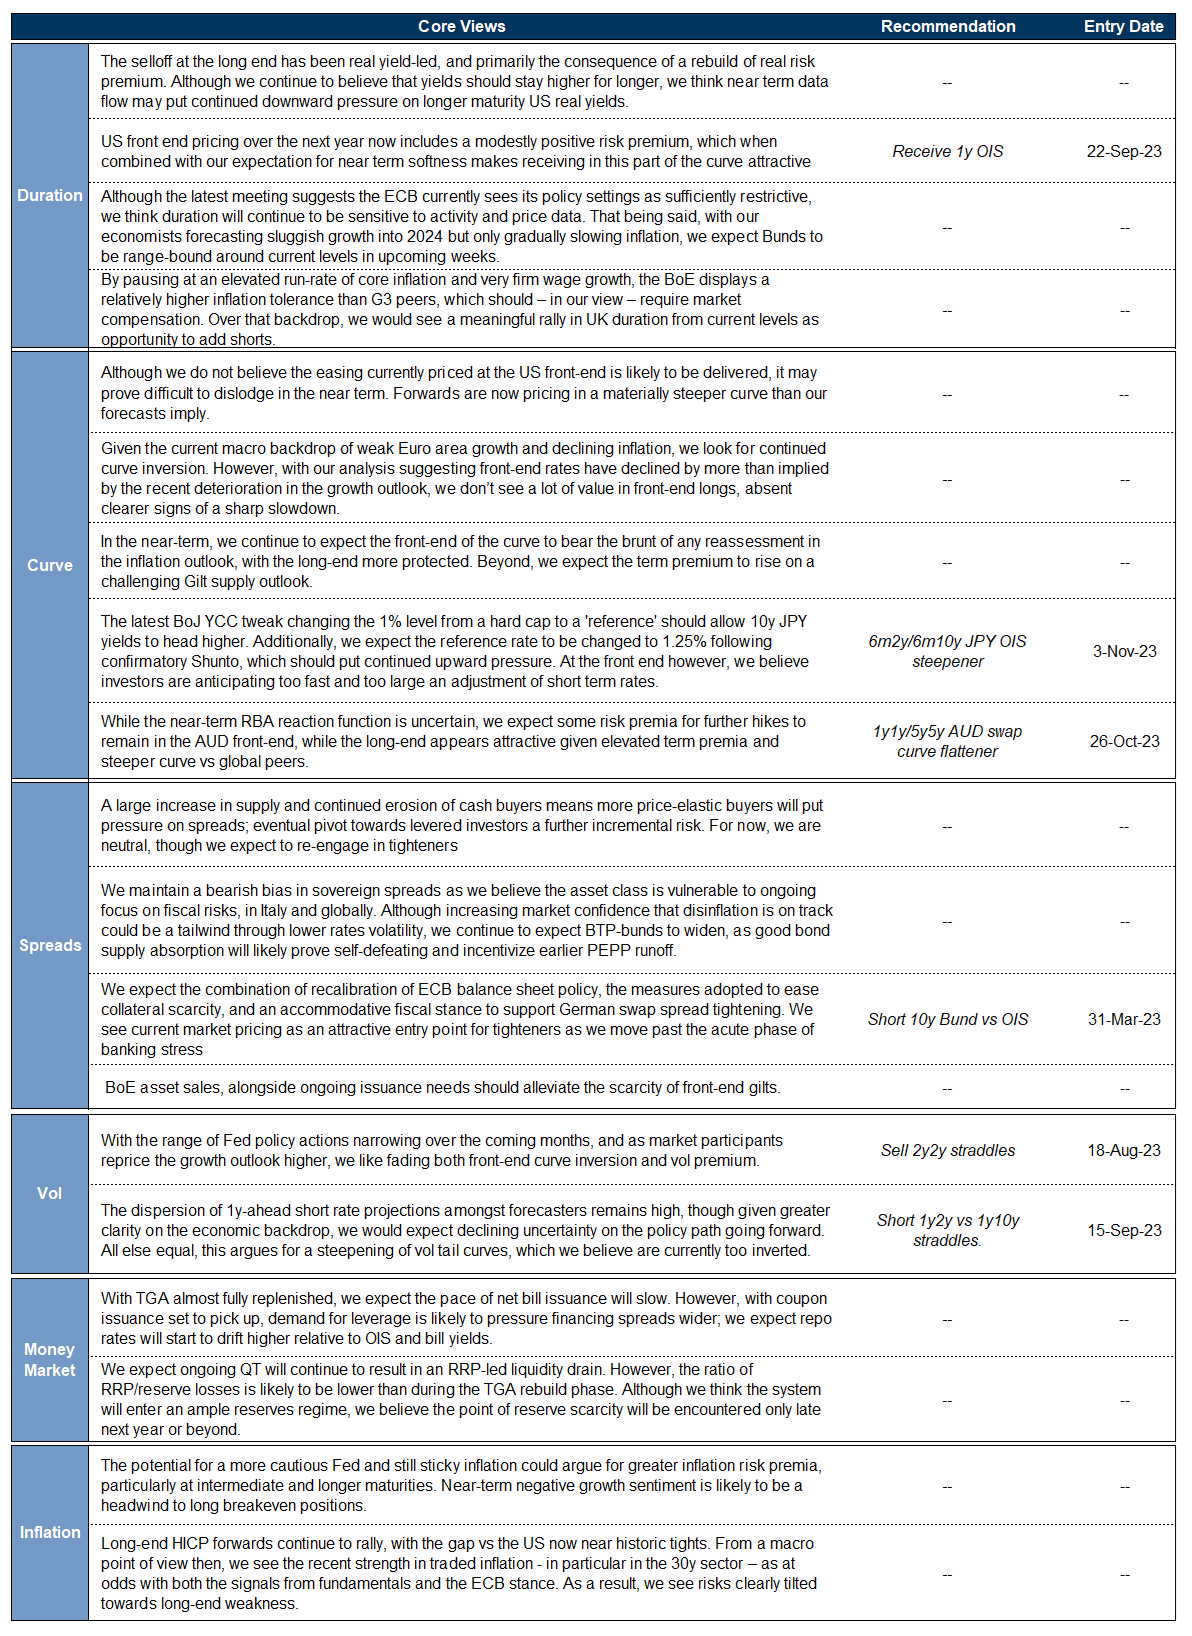
Summary of Views
Forecasts
G10 10y yield forecast
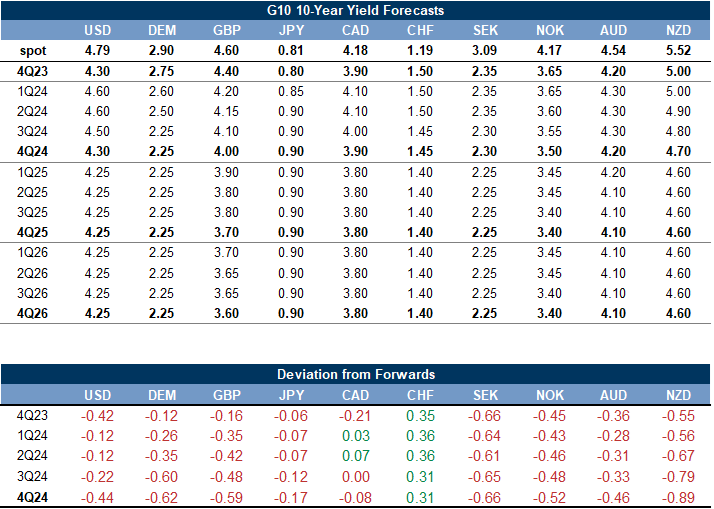
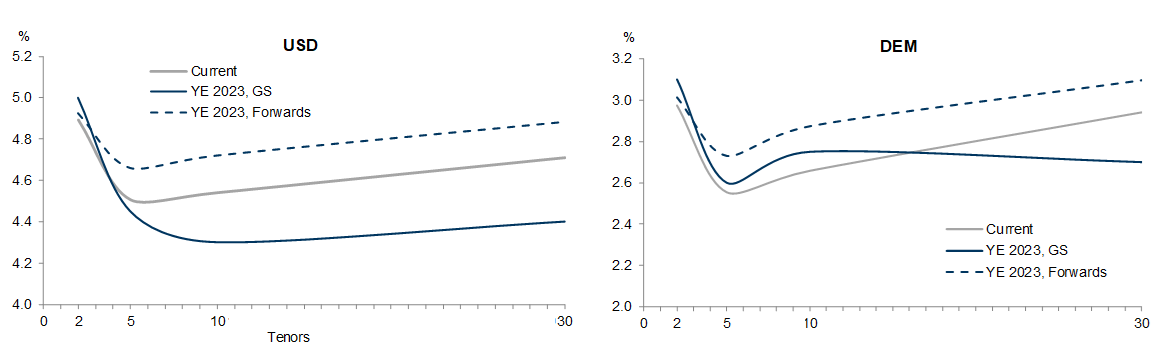
G4 Curve Forecast
Central Bank Dashboard
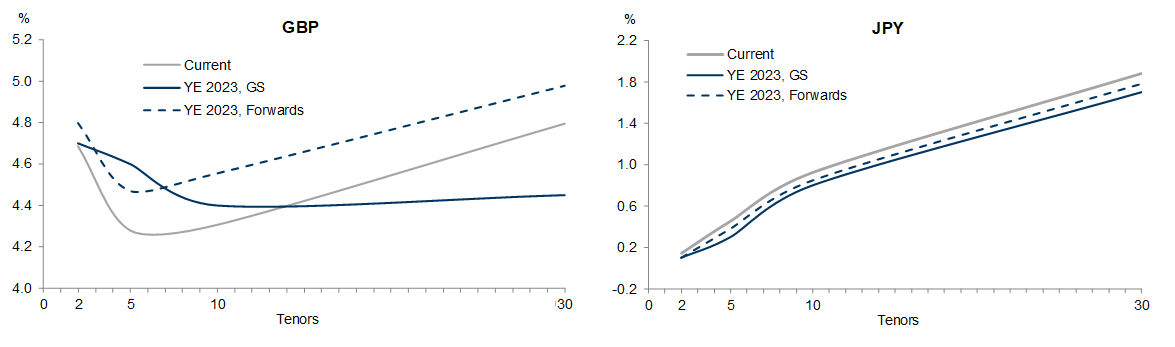
Cumulative amount of hikes/cuts priced from today
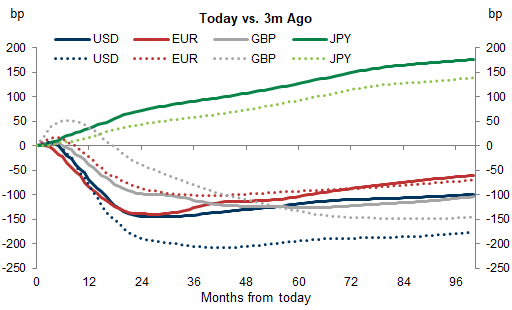
Expected hikes by year, GS vs. Market
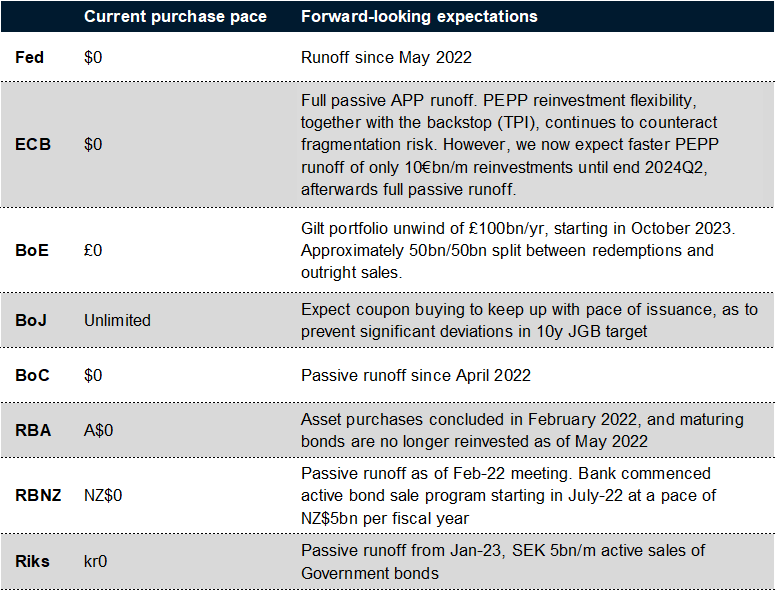
Central Bank Sovereign QE expectations
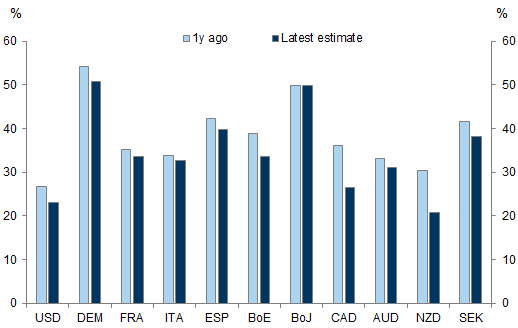
Central bank ownership of sovereign bonds, current vs. 1y ago
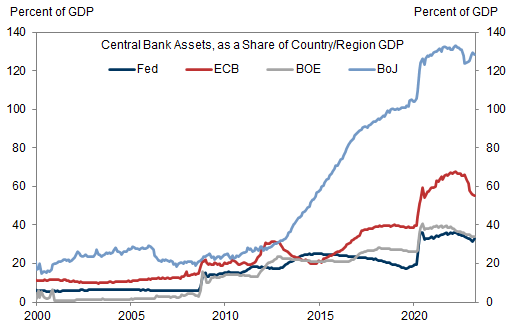
Central bank assets as a share of GDP
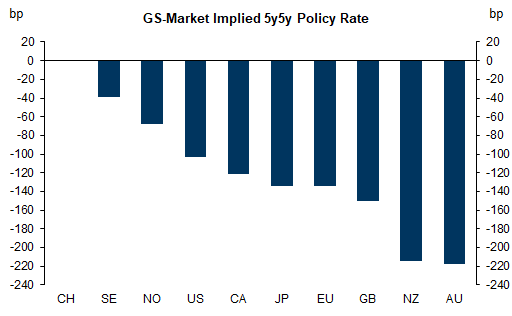
GS forecasts vs. market pricing of 5y5y average policy rate
Positioning and Flows Monitor
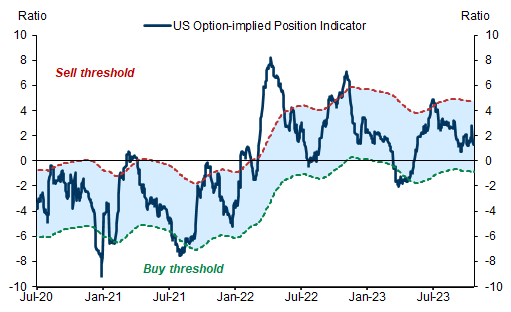
Option implied position indicator
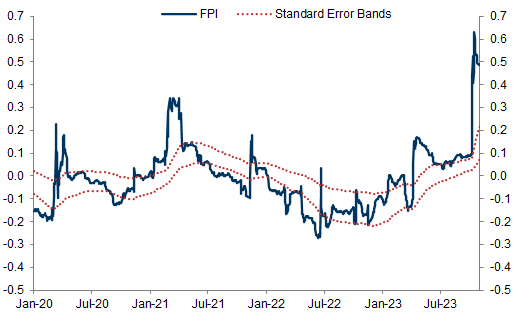
GS Fund Positioning Indicator
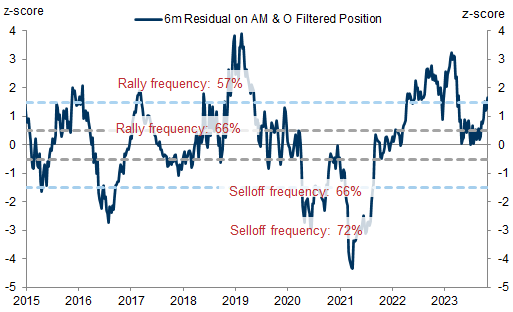
Residual of 10y UST yield changes on filtered AM position vs 6m ahead change in 10y UST yield
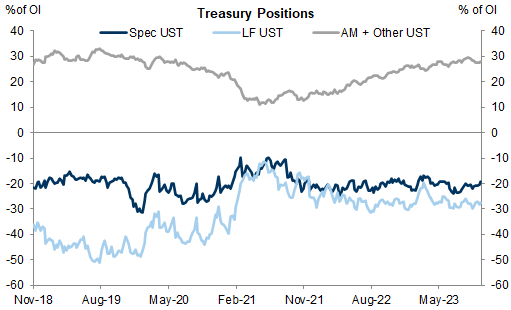
CFTC Commitment of Traders and Traders in Financial Futures
Net positions in Eurodollars
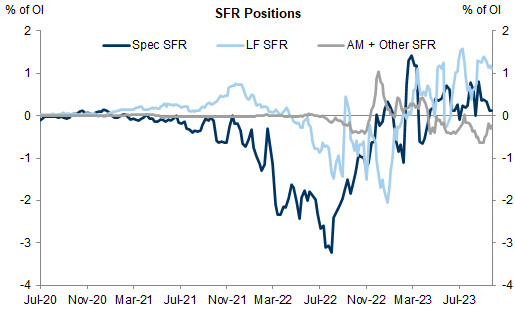
Net positions in UST futures
Primary dealer transactions
US Commercial Banks' Holdings of Treasury and Agency Securities

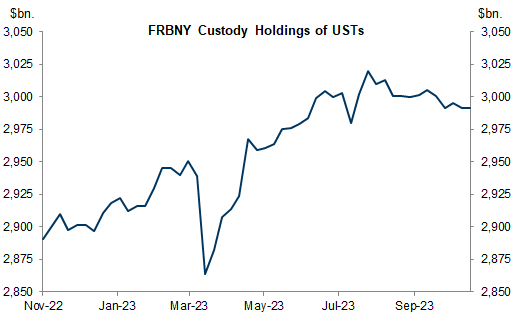
NY Fed Custody Holdings
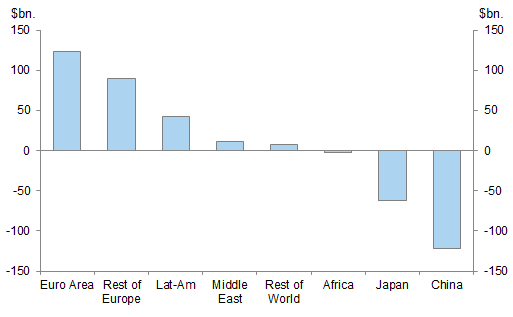
US TIC Treasury Flows
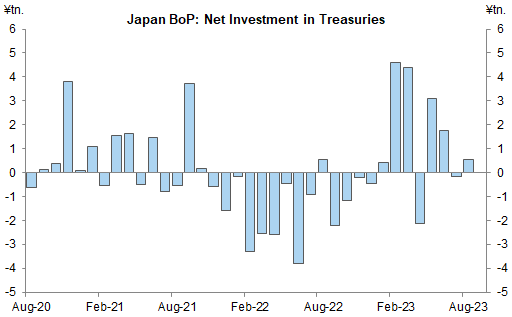
Net monthly purchases of short and long term US Treasuries by Japanese investors
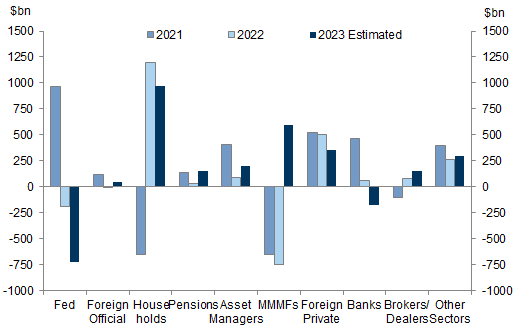
Flow of Funds annual net purchases of US Treasuries, by sector
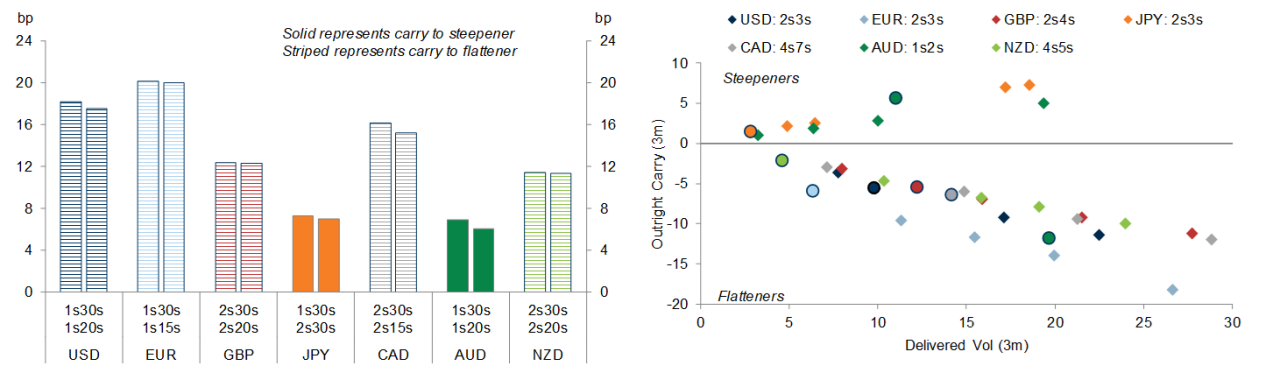
Carry/Rolldown Monitor
Outright Carry
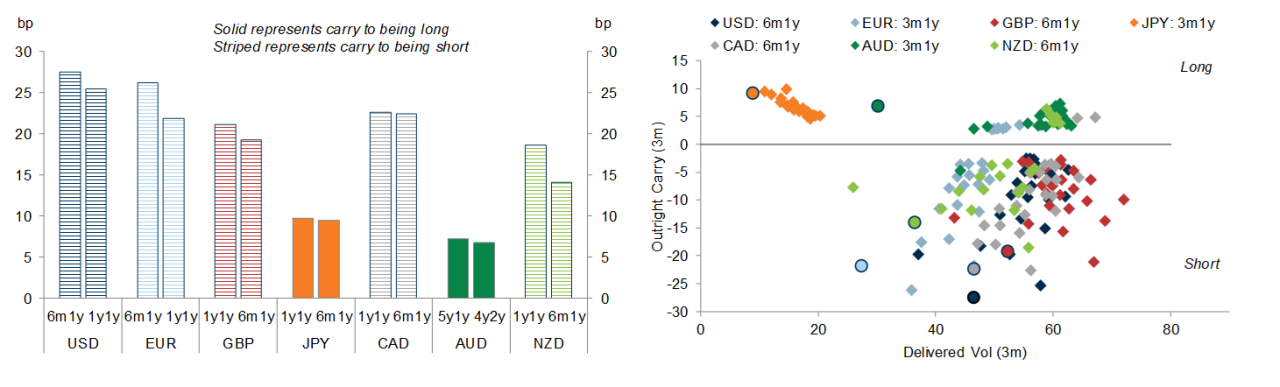
Curve Carry
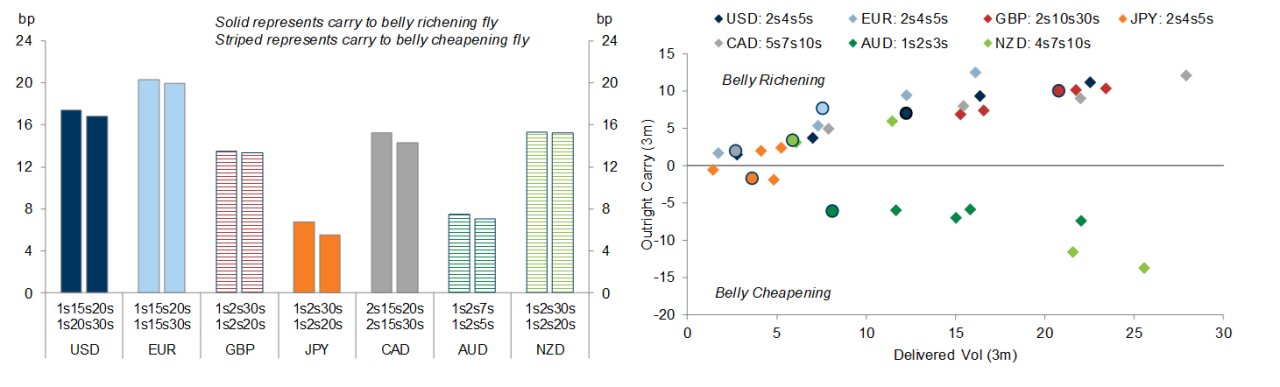
Fly Carry
Treasury Supply Monitor
Gross Treasury auction size estimates by year end, with GS projections
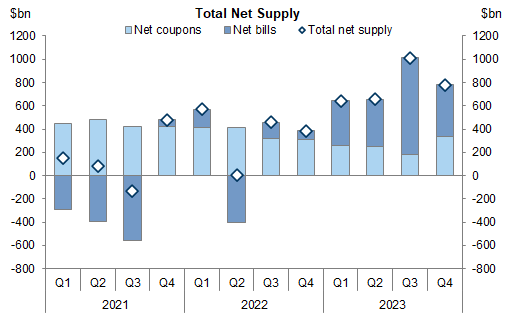
Net issuance per quarter
Average monthly UST issuance, gross and net of Fed purchases; $bn 10y equivalents
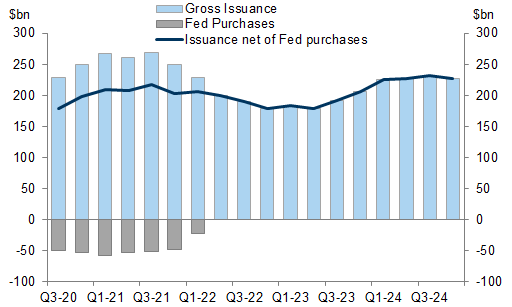
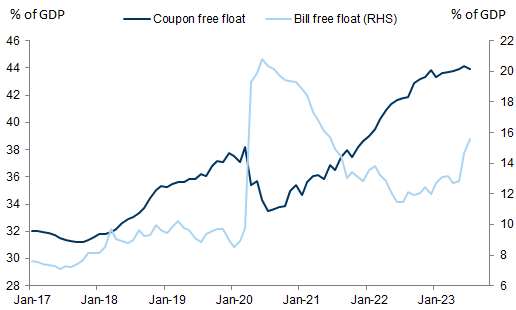
Free float (Treasuries outstanding less Fed and foreign official holdings) as % of GDP
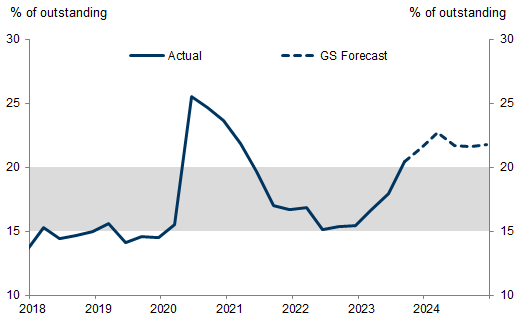
Bills as a share of Treasuries outstanding and GS forecast
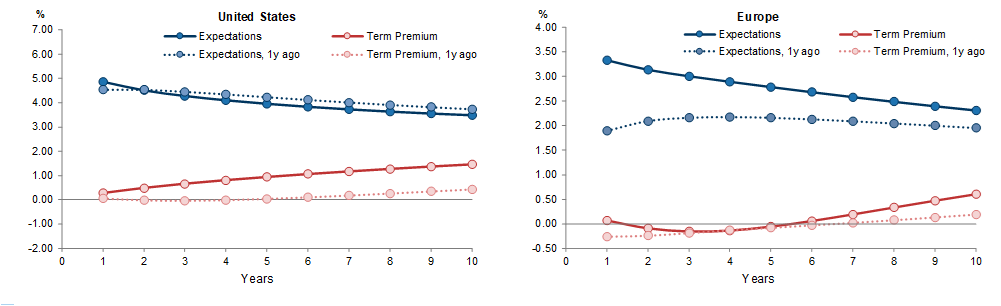
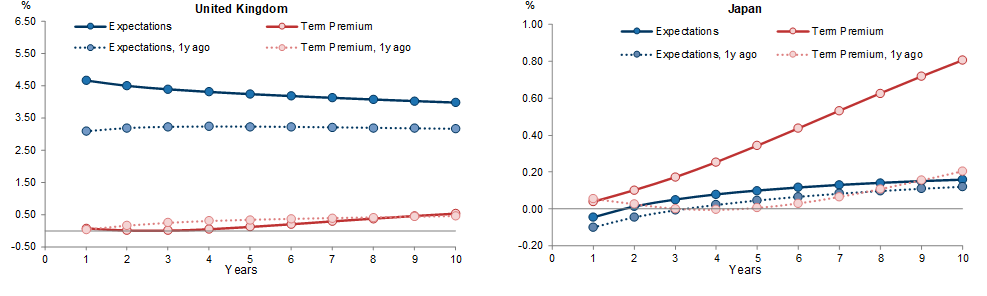
GS Term Premium Decomposition
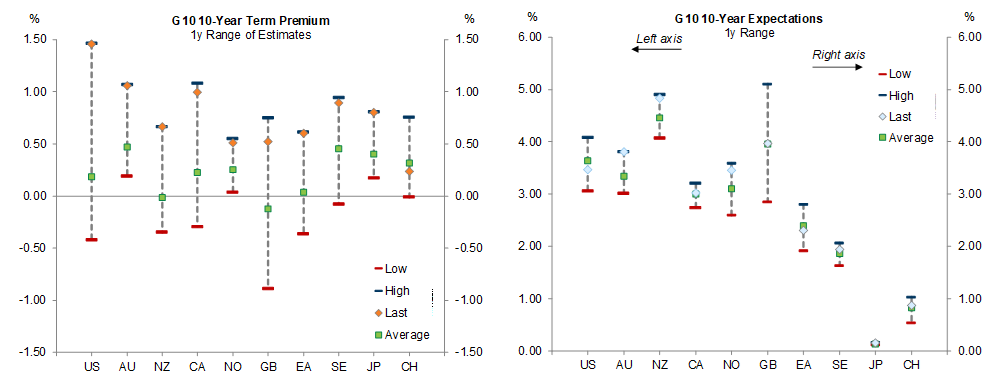
1y Range of G10 10y Yields, by Term Premium and Expectations Components
Term Structure of Fitted Yields, by Component
2023 Trade Recommendations
Investors should consider this report as only a single factor in making their investment decision. For Reg AC certification and other important disclosures, see the Disclosure Appendix, or go to www.gs.com/research/hedge.html.
Gallery
View all 38 exhibits