Goldman Sachs Research
US Daily: When Will Balance Sheet Runoff End and How Will the Fed Know When to Stop? (Abecasis/Korapaty)
19 November 2023 | 6:09PM EST | Research | Economics| By Jan Hatzius and others
More
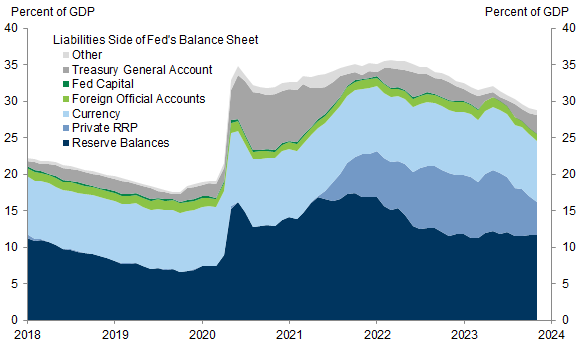
  • Since last year, the Fed’s balance sheet has shrunk by roughly $1.2tn to $7.8tn, and balance sheet runoff has proceeded smoothly so far. In today’s note, we provide an update of our Fed balance sheet projections and lay out a series of indicators we are watching to track conditions in money markets.

  • The FOMC will likely aim to stop balance sheet normalization when bank reserves go from “abundant” to “ample”—that is, when changes in the supply of reserves have a real but modest effect on short-term rates. We expect the FOMC to begin considering changes to the speed of runoff around 2024Q3, to slow the pace in 2024Q4, and to finish runoff in 2025Q1. At that point, we expect bank reserves to be around 12-13% of bank assets and the Fed’s balance sheet to be around 22% of GDP (vs. around 30% currently and 18% in 2019). The key risk to our forecast is that the increased supply of debt that we expect in 2024 causes intermediation bottlenecks in the Treasury market that lead the Fed to stop runoff earlier.

  • We continue to expect the Fed’s remaining balance sheet runoff to have modest effects on interest rates, broader financial conditions, growth, and inflation—much less than the impact of interest rate hikes this cycle.

  • There is substantial uncertainty over how conditions in money markets will evolve as runoff continues. We therefore introduce a number of indicators to monitor how conditions are evolving in short-term funding markets. These indicators suggest that liquidity currently remains abundant, though we expect them to signal pockets of scarcity in mid-2024.

When Will Balance Sheet Runoff End and How Will the Fed Know When to Stop?

Since last year, the Fed’s balance sheet has shrunk by $1.2tn to $7.8tn, and balance sheet runoff has proceeded smoothly so far. In today’s note, we provide an update of our Fed balance sheet projections and lay out a series of indicators we are watching to track conditions in money markets.

The evolution of balance sheet runoff and our projection for the stopping point

As the Fed lets securities roll of its balance sheet, the stock of Treasury and MBS debt it used to hold needs to be absorbed by the private sector. Private savers absorb this debt by drawing on bank deposits and money market fund balances. In response, banks and money market funds reduce their holdings at the Fed, putting downward pressure on bank reserves and balances at the Fed’s reverse repo (RRP) facility.[1]
Exhibit 1 breaks down the evolution of the liability side of the Fed’s balance sheet. In 2022, the bulk of the reduction in the Fed’s balance sheet came from a decline in bank reserves, which fell from $4.3tn in 2021, or around 19% of bank assets, to around $3.1tn in December 2022, or 13.5% of bank assets. At the same time, the Fed’s reverse repo facility—where intermediaries like money market funds can deposit excess liquidity if market rates fall below the RRP rate set by the Fed—actually increased in 2022, as the rapid rise in the fed funds rate led depositors toward money market funds in search for more attractive yields and a decline in outstanding Treasury bills pushed money markets toward the RRP facility.
In contrast, reserve balances have been relatively flat in 2023, and the Fed’s liabilities declined largely because of lower RRP use.[2] RRP balances declined by over $1.5tn to $936bn this year, as increased Treasury bill issuance and higher demand for funding by banks pushed money market funds away from the facility. Looking ahead, we expect RRP balances to continue declining and reach near-zero levels in 2024 as these dynamics continue. Lower RRP balances account for the bulk of the decline in the Fed’s liabilities that we expect over the next year.

Exhibit 1: In 2022, the Fed’s Balance Sheet Shrunk Through Lower Bank Reserves; In 2023, It Has Shrunk Through Lower RRP Balances

1. In 2022, the Fed’s Balance Sheet Shrunk Through Lower Bank Reserves; In 2023, It Has Shrunk Through Lower RRP Balances. Data available on request.
Source: Federal Reserve, Goldman Sachs Global Investment Research
The FOMC will likely aim to stop balance sheet normalization when bank reserves go from “abundant” to “ample”—that is, when changes in the supply of reserves have a real but modest effect on short-term rates relative to the Fed’s administered rates. To gauge when reserves and broader conditions in money markets will start exerting upward pressure on short-term rates, we use a censored regression model that predicts the spread between the effective fed funds rate and the Fed’s interest on reserve balances (IORB) rate based on reserves as a share of bank assets, our projections for bill supply, and demand for short-term financing from levered investors proxied by short positions in Treasury futures.
Our model suggests that short-term rates will start becoming more sensitive to changes in reserves around 2024Q3, and we expect the FOMC to begin considering changes to the speed of runoff at that point and then to slow the pace of balance sheet reduction in 2024Q4 by cutting the monthly runoff caps in half from $60bn to $30bn for Treasury securities and $35bn to $17.5bn for MBS securities.[3] We expect runoff to finish in 2025Q1, when bank reserves are 12-13% of bank assets (vs. 14% currently), or roughly $2.9tn (vs. $3.3tn currently), and the Fed’s balance sheet is around 22% of GDP (vs. around 30% currently and 18% in 2019). As runoff progresses, we expect the spread of the fed funds rate to the IORB rate to rise by 5-10bp over the next year, from -7bp currently.
Our estimate of the level of reserves at which the Fed will stop runoff is similar to recent estimates by Fed economists. New York Fed President John Williams and other Fed economists estimate that the ample reserves region starts at around 13% of bank assets.[4] Estimates by economists David Lopez-Salido and Annette Vissing-Jorgensen are also consistent with reserves at around 12-13% of bank assets.[5]
We continue to expect the Fed’s balance sheet runoff to have modest effects on interest rates, broader financial conditions, growth, and inflation. Our rule of thumb derived from a range of studies is that 1% of GDP of balance sheet reduction is associated with a roughly 2bp rise in 10-year Treasury yields. In total, our projections for runoff imply that balance sheet normalization will have exerted around 20bp worth of upward pressure on 10-year yields since runoff started. Together with our rule of thumb that a 25bp boost to 10-year term premia from balance sheet reduction has roughly the same impact on financial conditions and growth as a 25bp rate hike, this implies that the total runoff process should have the effect of a little under one rate hike. At this point, a large part of runoff has already occurred and most of what remains is likely already anticipated by financial markets, meaning that most of the impact on Treasury yields is likely behind us. Studies of asset purchase programs tend to find more evidence that they influence yields when they are announced or anticipated than when the flow of runoff occurs, consistent with the idea that financial markets price information about future events when they receive it, not when the event occurs.
The key risk to our forecast is that the increased supply of debt that we expect in 2024 causes intermediation bottlenecks in the Treasury market that lead the Fed to stop runoff earlier. Another possible risk is that FOMC participants decide to stop runoff early in order to avoid risking volatility in money markets. Indeed, a recent paper by President Williams and other Fed economists argues that elevated uncertainty over the shape of the demand curve for Fed reserves implies a higher optimal level of reserve supply by the Fed, all else equal.[6]

Monitoring conditions in funding markets

There is substantial uncertainty about how sensitive short-term rates will actually prove to changes in reserve balances and how conditions in money markets will evolve as runoff continues. We therefore introduce a number of indicators to monitor how conditions are evolving in short-term funding markets.

Conditions in overall funding markets

As liquidity becomes scarcer, money market rates like repo rates and the fed funds rate will start to increase relative to the Fed’s administered rates. Between 2017 and 2019, as the Fed’s balance sheet normalization progressed, the spread between the fed funds rate and the IORB rate rose from around -10bp to +5bp. So far, key money market rates including the fed funds rate remain close to the lower end of the IORB-RRP band, with the fed funds rate currently 6bp below the IORB rate, indicating that liquidity remains plentiful in funding markets (left-hand side of Exhibit 2).
At the same time, short-term Treasury rates are well above other short-term money market rates (light blue line, left-hand side of Exhibit 2), suggesting that money market funds will likely continue to move assets out of the RRP facility and into bills (right-hand side of Exhibit 2).

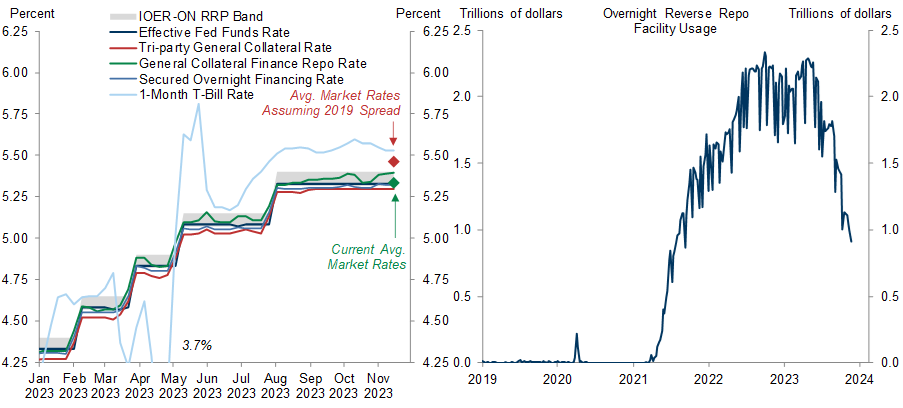
Exhibit 2: Key Money Market Rates Remain Close to the Lower End of the IORB-RRP Band, Indicating That Liquidity Remains Plentiful; Short-Term Treasury Rates Remain Above Repo Rates, Which Should Push Money Market Funds to Continue Shifting Assets from the RRP Facility to Treasuries

2. Key Money Market Rates Remain Close to the Lower End of the IORB-RRP Band, Indicating That Liquidity Remains Plentiful; Short-Term Treasury Rates Remain Above Repo Rates, Which Should Push Money Market Funds to Continue Shifting Assets from the RRP Facility to Treasuries. Data available on request.
Source: Federal Reserve, Goldman Sachs Global Investment Research

Conditions for banks

Banks may demand more reserves if they need to meet unexpected deposit outflows. Deposit flows have normalized since the banking turmoil of March 2023 subsided, which has stabilized banks’ immediate liquidity needs (left-hand side of Exhibit 3). Additionally, spreads on bank rates and CD rates—which increased in 2019 as banks sought to preserve funds amid increasingly scarce liquidity—remain low, suggesting that banks are not yet being forced to pay more for funds (right-hand side of Exhibit 3).

Exhibit 3: Bank Deposits Have Stabilized After the Banking Turmoil of March 2023 Subsided; Bank Rates Remain Below Market Rates, Suggesting the System Has Plenty of Liquidity

3. Bank Deposits Have Stabilized After the Banking Turmoil of March 2023 Subsided; Bank Rates Remain Below Market Rates, Suggesting the System Has Plenty of Liquidity. Data available on request.
Source: Federal Reserve, Wall Street Journal, Goldman Sachs Global Investment Research
If liquidity becomes scarce, banks can borrow from the Fed through the Standing Repo Facility (SRF) and the discount window at a rate slightly above the IORB rate.[7] As a result, routine use of the SRF or the discount window would signal that liquidity has become scarce and would likely lead the Fed to slow or stop balance sheet runoff. So far, though, the SRF remains untapped (left-hand side of Exhibit 4), and while outstanding loans to banks remain elevated in the aftermath of the banking turmoil in March, banks have been paying down these loans gradually (right-hand side of Exhibit 4).

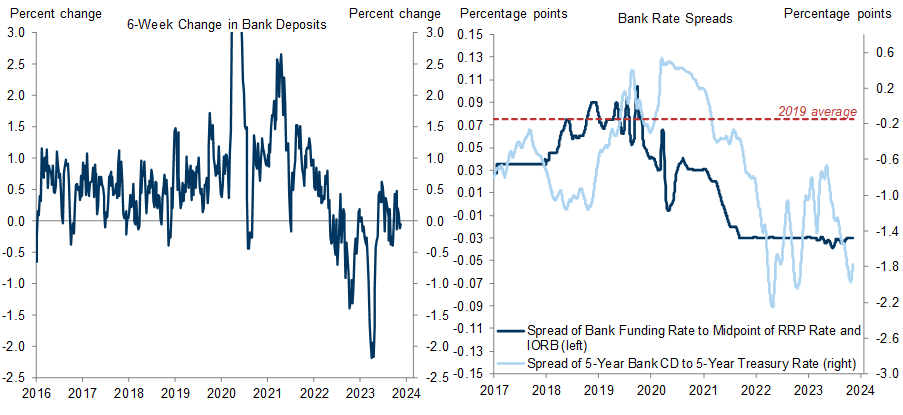
Exhibit 4: The Standing Repo Facility Remains Untapped; Banks Have Been Paying Off Discount Window and BTFP Loans Since March

4. The Standing Repo Facility Remains Untapped; Banks Have Been Paying Off Discount Window and BTFP Loans Since March. Data available on request.
Source: Federal Reserve, Goldman Sachs Global Investment Research
Consistent with stable funding conditions for banks, changes in the spread of the fed funds rate to the IORB rate remain insensitive to changes in reserves (Exhibit 5). This suggests that the Fed is still supplying “abundant” reserves to the banking system.

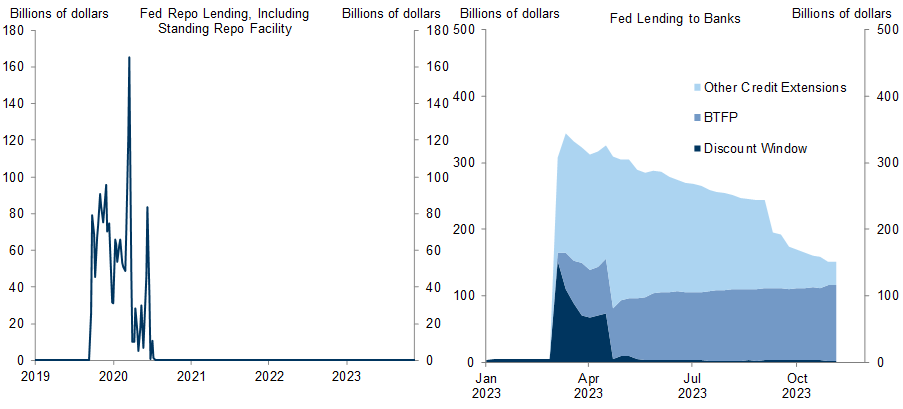
Exhibit 5: The Fed Funds Rate-IORB Spread Remains Insensitive to Changes in Reserves

5. The Fed Funds Rate-IORB Spread Remains Insensitive to Changes in Reserves. Data available on request.
Source: Goldman Sachs Global Investment Research
While there is abundant liquidity in the aggregate banking system, the distribution of reserves remains uneven (left-hand side of Exhibit 6). Banks can acquire reserves by borrowing in repo markets and taking out advances from the Federal Home Loan Banks (FHLBs), whose bonds can be purchased by market participants like money market funds. FHLB bond issuance has picked up slightly in recent weeks but remains well below its March levels, suggesting that banks’ funding needs remain broadly stable (right-hand side of Exhibit 6).

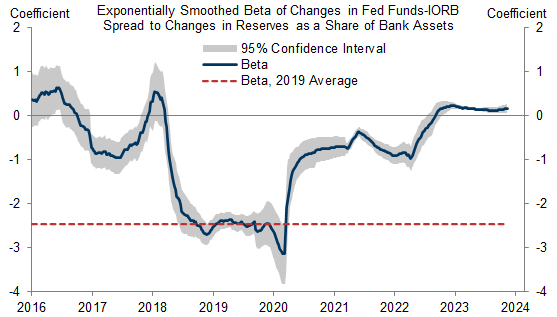
Exhibit 6: The Distribution of Bank Reserves Remains Uneven; FHLB Issuance Has Picked Up Slightly in Recent Weeks but Remains Well Below Its March Level

6. The Distribution of Bank Reserves Remains Uneven; FHLB Issuance Has Picked Up Slightly in Recent Weeks but Remains Well Below Its March Level. Data available on request.
Source: Federal Financial Institutions Examination Council, Department of the Treasury, Goldman Sachs Global Investment Research
Looking ahead, the Fed’s most recent Senior Financial Officer Survey shows that a net 10% of bank financial officers expect reserves at their banks to decline further, while 56% expect reserves to remain roughly where they are now (left-hand side of Exhibit 7). These results are broadly consistent with our expectation that bank reserves will decline modestly before the Fed stops runoff. Bank financial officers have also signaled that the lowest level of reserves they are comfortable with has mostly risen since last year (right-hand side of Exhibit 7).

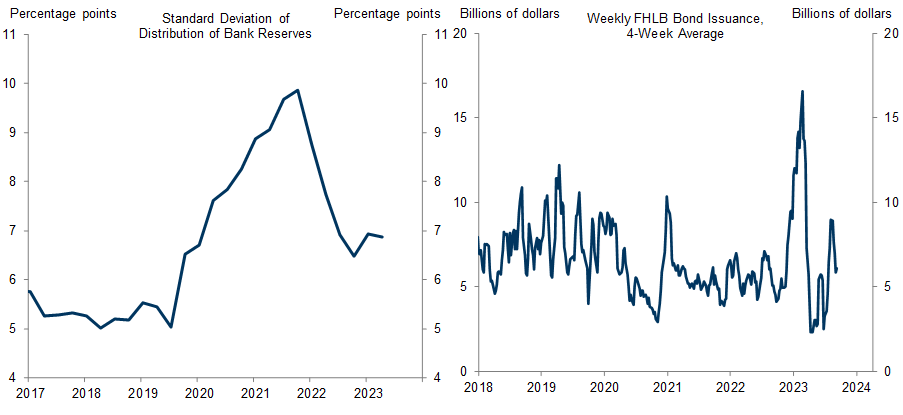
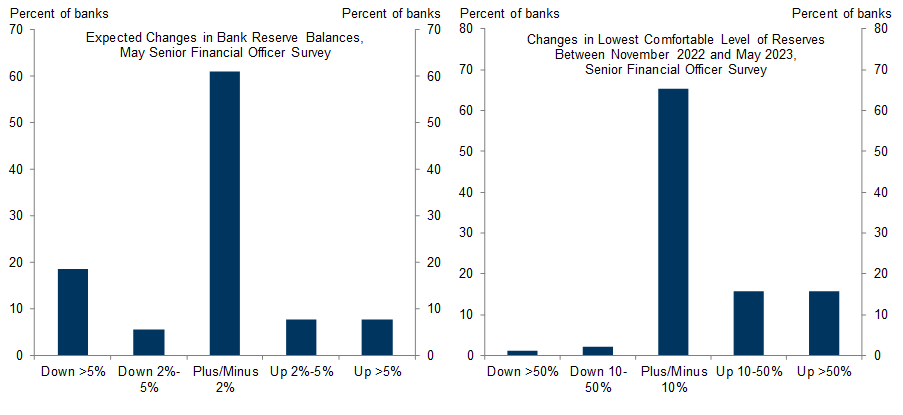
Exhibit 7: Most Banks Expect Reserve Balances to Remain Near Current Levels and Report That the Lowest Level of Reserves They’re Comfortable With Has Risen Since Last Year

7. Most Banks Expect Reserve Balances to Remain Near Current Levels and Report That the Lowest Level of Reserves They’re Comfortable With Has Risen Since Last Year. Data available on request.
Source: Federal Reserve, Goldman Sachs Global Investment Research

The evolution of non-reserve liabilities

As runoff continues, changes in the Fed’s non-reserve liabilities can lead to fluctuations in liquidity available to banks and money market funds. For example, the suspension of the debt ceiling in June allowed Treasury to replenish the Treasury General Account (TGA) at the Fed, which absorbed funds from the RRP facility and lowered the Fed’s supply of liquidity to the private sector. TGA balances rose to $850bn in October but have since fallen to $740bn, and we expect them to remain at $700-750bn over the next few months.
At the same time, the demand for currency has risen slowly but consistently over time. We don’t expect slowly-rising currency demand to have material effects over the next few months, but we do expect it to put a modest amount of upward pressure on the equilibrium size of the balance sheet as a share of GDP over time.

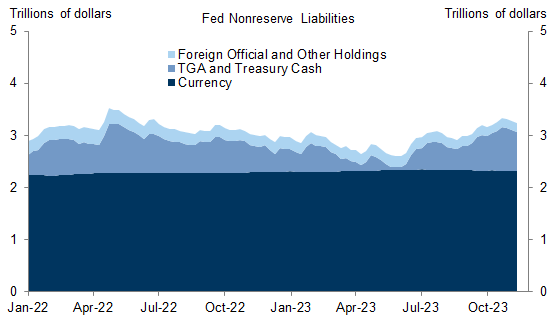
Exhibit 8: The Fed’s Nonreserve Liabilities Have Grown in Recent Months as the Treasury Replenished the TGA and Currency Demand Continues to Increase

8. The Fed’s Nonreserve Liabilities Have Grown in Recent Months as the Treasury Replenished the TGA and Currency Demand Continues to Increase. Data available on request.
Source: Federal Reserve, Goldman Sachs Global Investment Research

Manuel Abecasis

Praveen Korapaty

  1. 1 ^ This simplified illustration ignores other changes that may affect banks and money market funds’ incentives for holding reserves and RRP balances, such as changes in interest rates and changes in the composition of bank deposits. Acharya and Rajan (2022), for example, argue that QE shifts the composition of bank funding toward more volatile uninsured demand deposits, which increases banks’ demand for reserves in order to ensure liquidity in the face of more volatile liabilities. Interest rates also change the optimal composition of bank funding—for example, time deposits have increased rapidly since the Fed started hiking, and banks may demand a different quantity of reserves to match these liabilities.
  2. 2 ^ The Fed’s balance sheet expanded somewhat in response to the banking turmoil in March 2023 but resumed its decline after conditions in the banking sector stabilized in April.
  3. 3 ^ This should meaningfully slow the pace of Treasury runoff but have a more muted impact on the pace of MBS runoff, since higher mortgage rates have reduced mortgage prepayments substantially.
  4. 4 ^ Afonso, Gara, Domenico Giannone, Gabriele La Spada, and John C. Williams, “Scarce, Abundant, or Ample? A Time-Varying Model of the Reserve Demand Curve,” May 2022 (revised June 2023).
  5. 5 ^ Lopez-Salido, David, and Annette Vissing-Jorgensen, “Reserve Demand, Interest Rate Control, and Quantitative Tightening,” November 2021 (revised September 2023). We take the parameters in the paper and estimate the implied level of reserves using the latest data on deposits, which have declined somewhat since the authors published it in 2022. Their estimates imply that reserve balances equal to $2.6tn would roughly match money market conditions in September 2019 while reserve balances equal to $3.2tn would result in an IORB-fed funds spread of zero. The average of these two estimates is about $2.9tn, similar to our forecast for the stopping point.
  6. 6 ^ See Afonso, Gara, Gabriele La Spada, Thomas M. Mertens, and John C. Williams, “The Optimal Supply of Central Bank Reserves under Uncertainty,” November 2023.
  7. 7 ^ The SRF and discount window rates are currently set at 5.50%, 10bp above the IORB rate.

Investors should consider this report as only a single factor in making their investment decision. For Reg AC certification and other important disclosures, see the Disclosure Appendix, or go to www.gs.com/research/hedge.html.