Goldman Sachs Research
Hedge Fund Trend Monitor
Hedge fund crowding reaches new record as popular positions enjoy momentum
In this report we analyze the holdings of 735 hedge funds with $2.4 trillion of gross equity positions at the start of 4Q 2023 ($1.6 trillion long and $797 billion short).
The combination of elevated hedge fund concentration and the strong performance of popular stocks has supported returns this year but lifted our crowding index to a record high. Our Hedge Fund VIP list of the most popular long positions has returned +31% YTD, and most of the "Magnificent 7" mega-cap tech stocks remain at the top of the list. Mirroring the increasing concentration in the equity market, concentration in hedge fund portfolios has risen; the typical hedge fund holds 70% of its long portfolio in its top 10 positions. These dynamics have also lifted hedge fund exposure to the Momentum factor to a near record.
While riding the momentum of popular tech stocks, funds searched for alpha in the Health Care and Consumer sectors. After improving for most of 2023, the stock-picking environment has recently deteriorated as stock correlations and the macro share of stock returns have risen while return dispersion has declined. Nonetheless, the latest filings show hedge funds looking for opportunities amid the volatility created by GLP-1 enthusiasm and consumer uncertainty. LLY, ABT, and HD ranked on our Rising Stars list of stocks with the largest increase in hedge fund popularity last quarter, while BSX and DKS are among the Falling Stars. The popularity of small-caps also reflects the hunt for alpha.

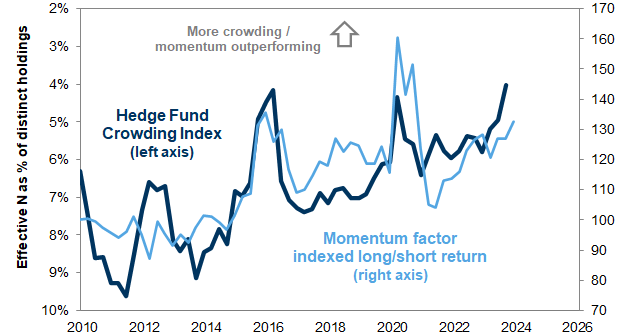
Exhibit 1: Hedge fund crowding has risen as popular positions have gained momentum

1. Hedge fund crowding has risen as popular positions have gained momentum. Data available on request.
Source: Goldman Sachs Global Investment Research

5 key points from the Goldman Sachs Hedge Fund Trend Monitor

This Hedge Fund Trend Monitor analyzes 735 hedge funds with $2.4 trillion of gross equity positions ($1.6 trillion long and $797 billion short). Our analysis of positions at the start of 4Q 2023 is based on 13-F filings as of November 15, 2023.
  1. PERFORMANCE: The most popular hedge fund long and short positions have supported returns despite a deteriorating stock-picking environment Our Hedge Fund VIP list of the most popular long positions (ticker: GSTHHVIP) has returned +31% YTD, handily outperforming the S&P 500 (+19%), the equal-weight S&P 500 (+5%) and the most shorted stocks (GSCBMSAL, +0%). This outperformance has persisted despite the market volatility in recent months, with popular long positions outperforming concentrated shorts in most sectors. However, the improvement in the alpha-generation backdrop that took place earlier in 2023 has reversed, with the "micro" share of stock returns declining in 4QTD.

  2. LEVERAGE AND SHORT INTEREST: Hedge funds have lifted net exposures modestly while maintaining record gross leverage. Elevated gross exposures help explain the extreme recent volatility of heavily shorted stocks. However, short interest in the typical stock remains low as funds have increasingly hedged using macro products like ETFs and futures rather than single stock shorts.

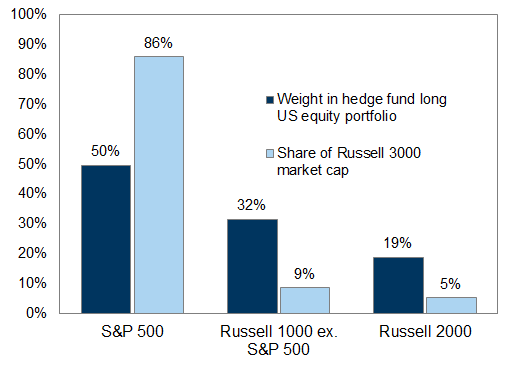
  3. MAGNIFICENT 7: Funds bought mega-cap tech during 3Q, lifting their exposures to the "Magnificent 7" to a new high. The mega-cap tech stocks account for 13% of the aggregate hedge fund long portfolio, twice their weight at the start of 2023 but only half the stocks' weight in the Russell 3000. Except for TSLA, each of the seven rank among the top 10 members of our Hedge Fund VIP list. MSFT and AMZN have been the top two VIPs for nine consecutive quarters.

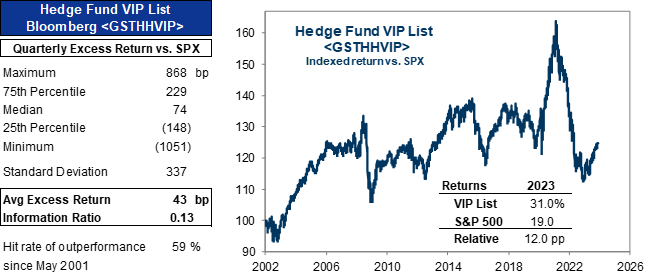
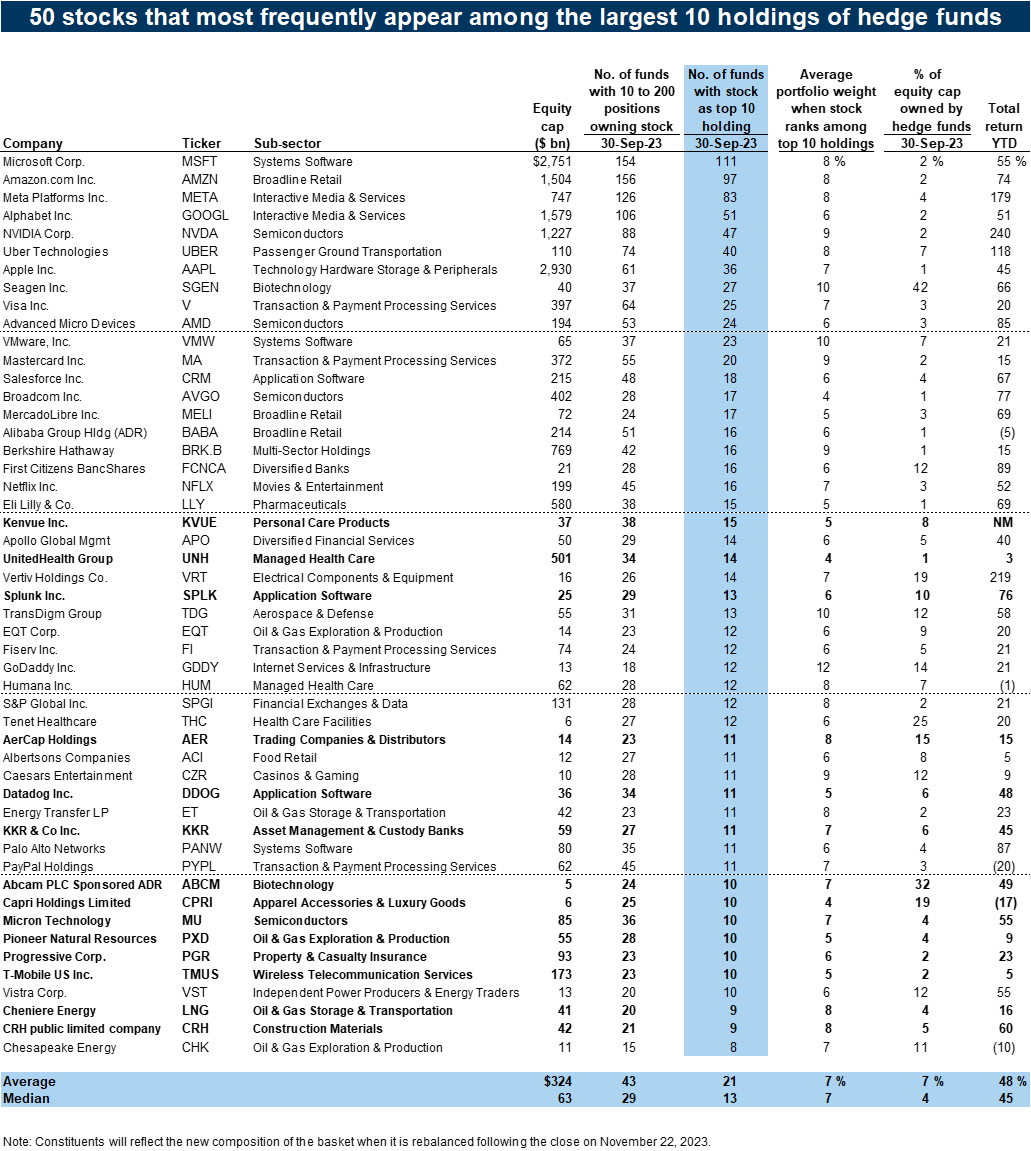
  4. HEDGE FUND VIPS: The mega-caps remain the most popular hedge fund long positions. The top 6 stocks this quarter (MSFT, AMZN, META, GOOGL, NVDA, UBER) also ranked as the top 6 last quarter. The VIP list contains the 50 stocks that appear most often among the top 10 holdings of fundamental hedge funds. The basket has outperformed the S&P 500 in 59% of quarters since 2001 with an average quarterly excess return of 43 bp. 14 new constituents: ABCM, AER, CPRI, CRH, DDOG, KKR, KVUE, LNG, MU, PGR, PXD, SPLK, TMUS, and UNH.

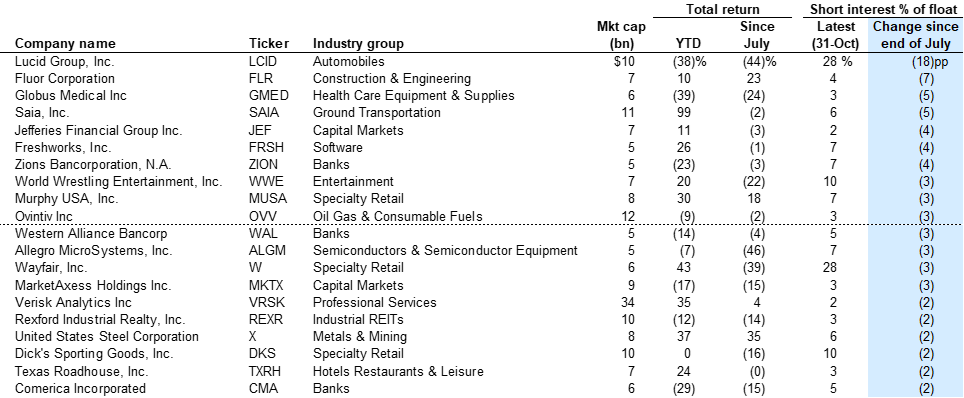
  5. SECTORS: Hedge funds added heavily to Tech last quarter, with broad-based increases across industries. Funds sold Health Care, but it remains the largest sector overweight relative to the Russell 3000. Funds also sold Energy, where tilts are close to the lowest since before the GFC. The consumer remains a point of debate, with consumer firms heavily represented on our list of "controversial" stocks with high ownership and high short interest (Exhibit 15). CZR, DLTR, HLT, SYF, and WYNN joined our High Hedge Fund Concentration basket (Exhibit 39). Similarly, funds remained underweight Financials and JPM and C fell out of our VIP list, but CMA, JEF, MKTX, WAL, and ZION ranked among the stocks with the largest decrease in short interest during the last few months.

Performance, leverage, and short interest

Complementary long and short positions have allowed hedge funds to maintain a solid YTD return despite the recent rise in equity market volatility. Our Hedge Fund VIP basket of the most popular hedge fund long positions (ticker: GSTHHVIP) has returned +31% YTD, handily outperforming the S&P 500 (+19%), a basket of the stocks with the largest outstanding notional dollars of short interest (GSTHVISP, +4%), and a basket of stocks with the highest concentration of short interest relative to float (GSCBMSAL, +0%). During the three months from August through October, the VIP list dropped by -7%, but the most shorted stocks declined by -35%, helping preserve alpha. As a result, based on estimates from GS Prime Services, US equity long/short funds have generated a +7% YTD return.

Exhibit 2: GS Prime Services estimates a 7% YTD return for US long/short equity hedge funds

as of November 17, 2023
2. GS Prime Services estimates a 7% YTD return for US long/short equity hedge funds. Data available on request.
Hedge fund performance estimates represent weighted averages of fund performance derived from aggregated Goldman Sachs Prime Services client positions for an anonymized basket of Equity Long/Short funds.
Source: FactSet, Goldman Sachs Prime Services, Goldman Sachs Global Investment Research

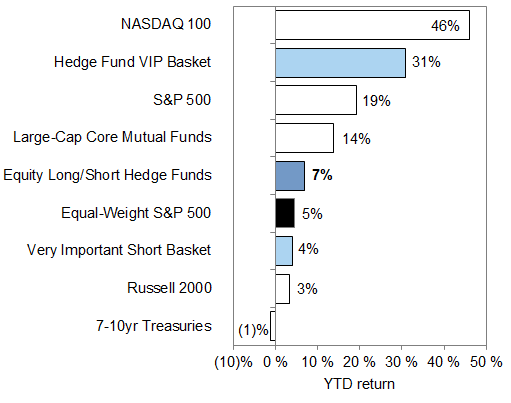
Exhibit 3: The most popular hedge fund positions have fared well YTD

3. The most popular hedge fund positions have fared well YTD. Data available on request.
Source: Goldman Sachs Global Investment Research
The most popular hedge fund long positions have outperformed the most concentrated short positions YTD in most sectors. Popular longs have lagged only in Financials and Real Estate.

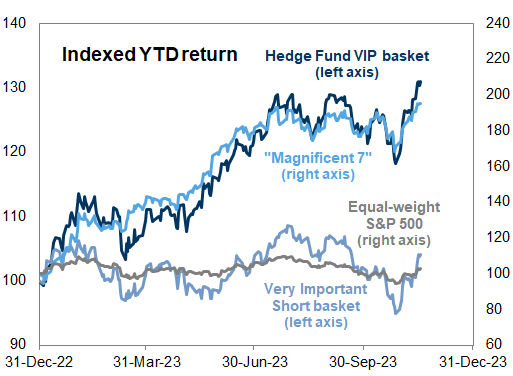
Exhibit 4: The most popular hedge fund long positions have outperformed the most concentrated shorts in most sectors YTD

4. The most popular hedge fund long positions have outperformed the most concentrated shorts in most sectors YTD. Data available on request.
Source: Goldman Sachs Global Investment Research
The most concentrated short positions have contributed to hedge fund alpha this year but have been extremely volatile. Between 2002 and 2020, our rolling basket of the stocks with the highest short interest relative to float has averaged realized volatility of 1.5-2 times that of the equal-weight S&P 500. However, since the "meme stock" short squeeze in early 2021, the most shorted stocks have been 2-3 times as volatile as the equal-weight S&P 500. While volatility in the most shorted stocks declined modestly in 2022, it has risen again YTD in 2023.

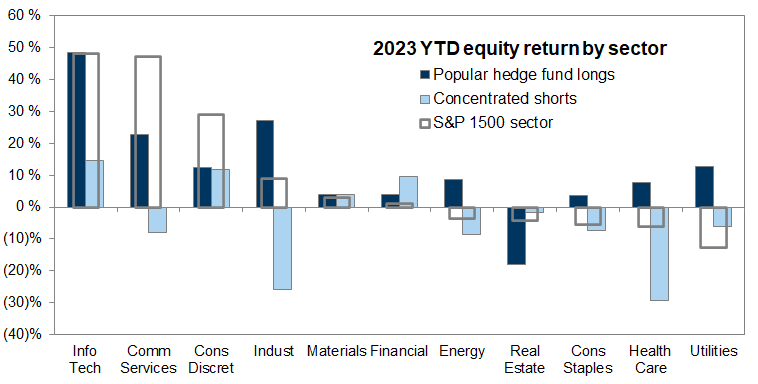
Exhibit 5: Short positions have been particularly volatile in recent years

5. Short positions have been particularly volatile in recent years. Data available on request.
Source: Goldman Sachs Global Investment Research

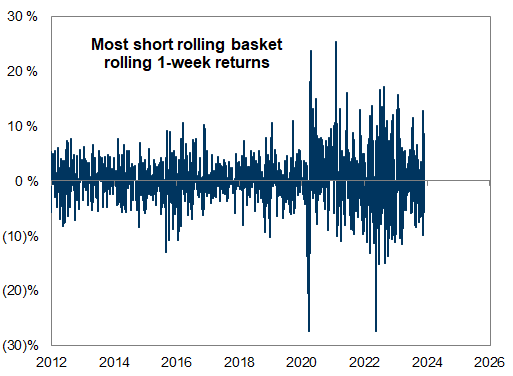
Exhibit 6: Highly shorted stocks have recently been highly volatile

6. Highly shorted stocks have recently been highly volatile. Data available on request.
Source: Goldman Sachs Global Investment Research
One possible explanation for the elevated volatility of heavily shorted stocks is the elevated degree of hedge fund gross exposure. Data from Goldman Sachs Prime Services show hedge funds lifting gross exposures to record highs in early 2023 while net leverage remained constrained. While funds have lifted net exposures modestly YTD, gross exposure currently registers at the highest level on record.

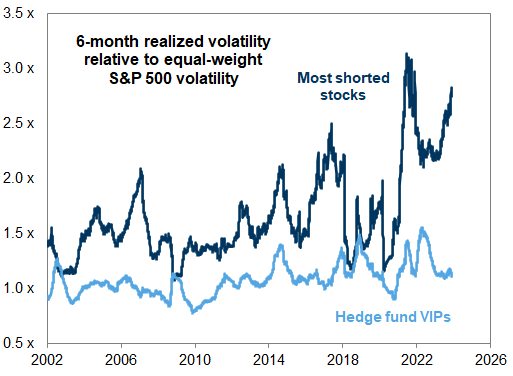
Exhibit 7: Hedge fund gross and net leverage

Aggregated data from Goldman Sachs Prime Services as of 16-Nov-23; should not be relied upon as a comprehensive view of the market
7. Hedge fund gross and net leverage. Data available on request.
Source: Goldman Sachs Prime Services, Goldman Sachs Global Investment Research
Despite record hedge fund gross exposures, short interest for the typical stock remains close to historical lows. The median S&P 500 stock carries short interest equal to 1.7% of market cap, only modestly above the record low of 1.5% reached last year and in 2000. Rising ETF short interest and large hedge fund short positions in equity futures indicate that funds have increasingly relied on 'macro' products as hedges in lieu of individual stock shorts.

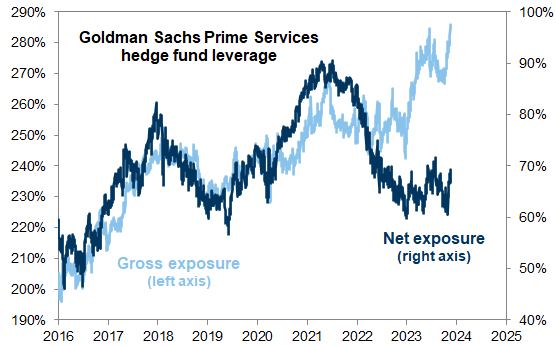
Exhibit 8: Short interest for the typical stock remains low vs. history

8. Short interest for the typical stock remains low vs. history. Data available on request.
Source: FactSet, Goldman Sachs Global Investment Research

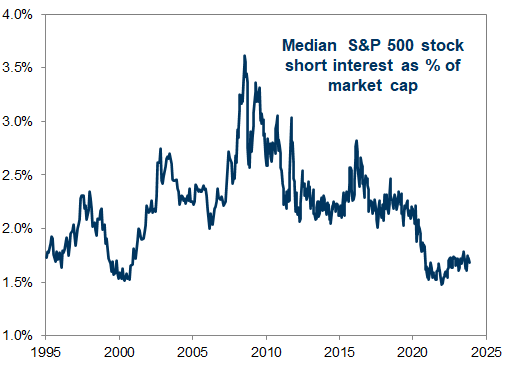
Exhibit 9: Funds have increasingly used macro products as shorts

9. Funds have increasingly used macro products as shorts. Data available on request.
Source: CFTC, Goldman Sachs Global Investment Research
The exhibits below show the stocks with the largest changes in short interest since the recent market high at the end of July. We screen for Russell 3000 stocks with market caps over $5 billion for changes in short interest between the end of July 2023 and the most recent available short interest data, which reflect positions at the beginning of November. For stocks with the highest level of short interest, rather than recent changes, see Exhibit 52 in Appendix A.

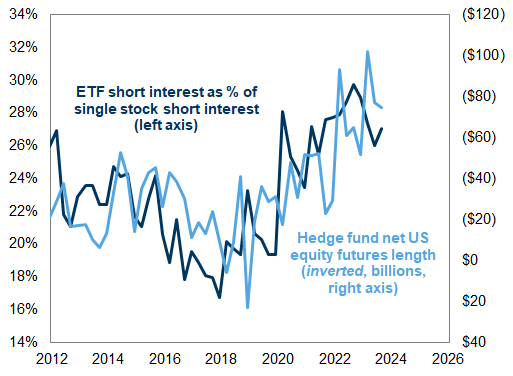
Exhibit 10: Stocks with largest increases in short interest since end of July

Russell 3000 stocks with market caps over $5 billion
10. Stocks with largest increases in short interest since end of July. Data available on request.
Source: FactSet, Goldman Sachs Global Investment Research

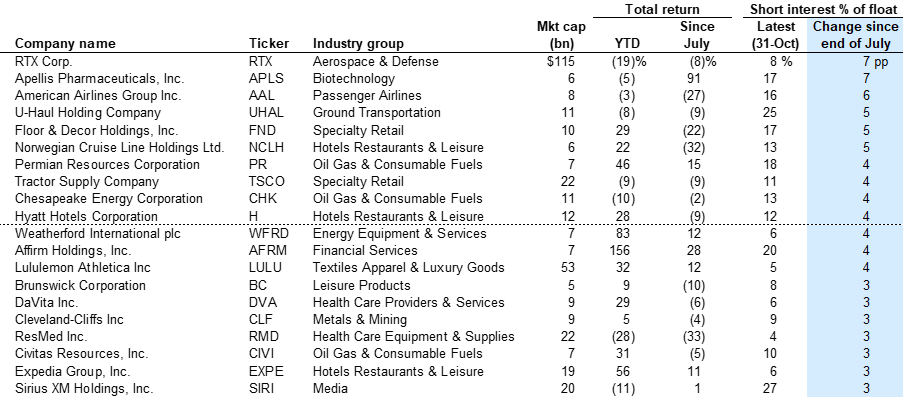
Exhibit 11: Stocks with largest decreases in short interest since end of July

Russell 3000 stocks with market caps over $5 billion
11. Stocks with largest decreases in short interest since end of July . Data available on request.
Source: FactSet, Goldman Sachs Global Investment Research

Macro vs. micro returns

The recent trend toward increasingly micro-driven stock returns has reversed so far in 4Q 2023. Since mid-2022, the alpha generation environment for stock-pickers had consistently improved, helping explain the large coincident increase in hedge fund gross exposures as funds focused on alpha over beta. Earlier in 2023, stock returns had become more micro-driven than they had been since late 2017. However, that dynamic has reversed so far in 4Q, with the macro portion of stock returns increasing.

Exhibit 12: The trend toward increasingly micro-driven stock returns has reversed QTD

12. The trend toward increasingly micro-driven stock returns has reversed QTD. Data available on request.
Macro share of returns calculated as the R-squared value of a linear regression of individual stock daily returns on a set of macro drivers including equal-weight S&P 500 returns and interest rates, among others.
Source: Goldman Sachs Global Investment Research
Rising stock correlations and falling return dispersion also reflect the increasingly challenging stock-picking environment. S&P 500 average stock correlations had declined sharply for most of this year before rising back to long-term average levels in recent months. Likewise, return dispersion — measured as the cross-sectional distribution of returns across S&P 500 stocks — had registered above-average levels earlier this year, indicating a favorable environment for alpha generation, before recently declining.

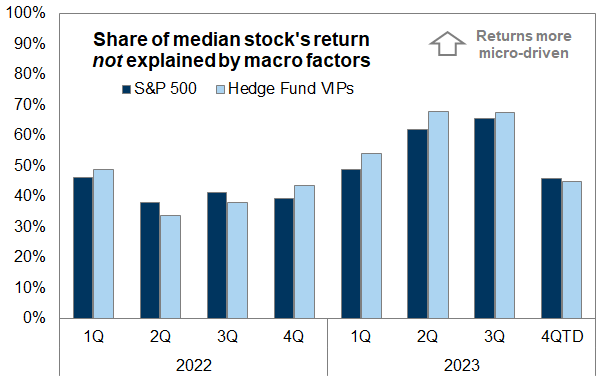
Exhibit 13: S&P 500 average realized stock correlation has recently risen

13. S&P 500 average realized stock correlation has recently risen. Data available on request.
Source: Goldman Sachs Global Investment Research

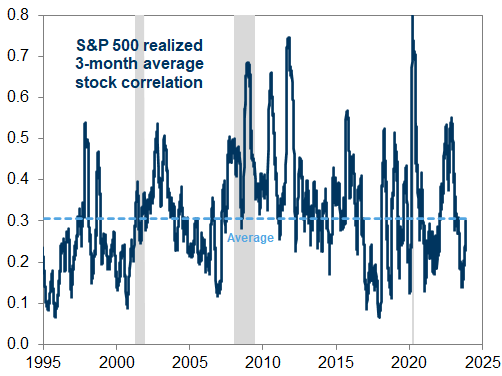
Exhibit 14: Falling dispersion narrows the alpha opportunity for stock-pickers

14. Falling dispersion narrows the alpha opportunity for stock-pickers. Data available on request.
Source: Goldman Sachs Global Investment Research
For investors looking for alpha opportunity, Exhibit 15 shows "controversial" stocks ranking in the top 20% of stocks both in terms of hedge fund long position popularity and short interest relative to market cap.

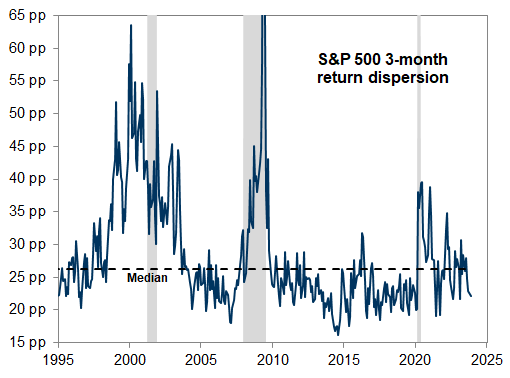
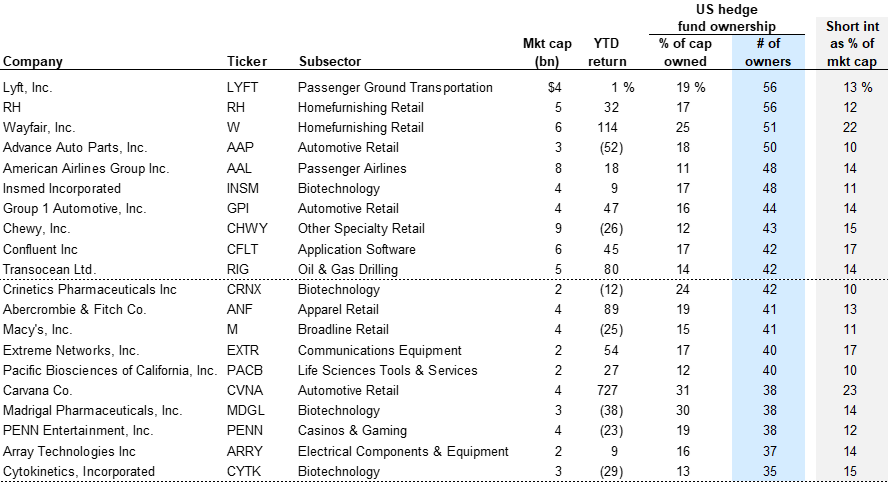
Exhibit 15: Stocks with market caps > $2 billion that rank highly on both hedge fund popularity and short interest

15. Stocks with market caps > $2 billion that rank highly on both hedge fund popularity and short interest. Data available on request.
Source: FactSet, Goldman Sachs Global Investment Research

Thematic and factor rotations: Momentum, Magnificent 7, and small-caps

Hedge fund long portfolios have reached a near-record tilt toward Momentum as a factor. Funds maintained their large positions in tech and other secular growth favorites during 2022 despite the sharp underperformance of those stocks, giving portfolios a record anti-Momentum tilt last year. This year, as those stocks have retaken market leadership, portfolios have grown increasingly exposed to Momentum. Likewise, the hedge fund long portfolio tilt to Growth vs. Value has climbed in recent quarters to the highest level since late 2020.

Exhibit 16: Fund portfolios have rarely been more tilted toward Momentum

16. Fund portfolios have rarely been more tilted toward Momentum. Data available on request.
Source: Goldman Sachs Global Investment Research

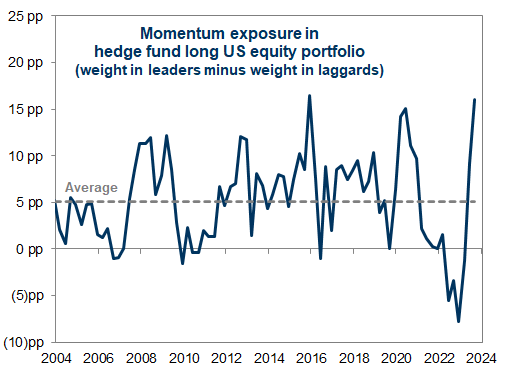
Exhibit 17: Hedge fund portfolios continued to rotate toward Growth during 3Q

17. Hedge fund portfolios continued to rotate toward Growth during 3Q. Data available on request.
Source: Goldman Sachs Global Investment Research
Funds bought mega-cap tech as the stocks stalled during 3Q, lifting the portfolio weights of the "Magnificent 7" to double their weight at the start of 2023. The "Magnificent 7" mega-cap tech stocks (AAPL, AMZN, GOOGL, META, MSFT, NVDA, and TSLA) account for 13% of the US hedge fund long equity portfolio, with all of the stocks but TSLA ranking among the top 10 constituents of our Hedge Fund VIP list. Likewise, according to GS Prime Services, hedge fund net exposures in these stocks currently rank in the 99th percentile since 2016, compared with just a 12th percentile position at the start of 2023. However, this 13% long portfolio weight is only half the weight accounted for by the seven stocks in the Russell 3000 index (25%). Similarly, while hedge funds carry a 20% net weight in the Info Tech sector, relative to the Russell 3000 this equates to a large underweight tilt (Exhibit 27).

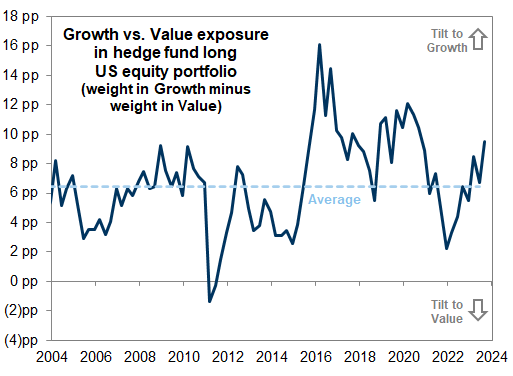
Exhibit 18: The weight of mega-cap tech stocks in hedge fund long portfolios has doubled YTD

18. The weight of mega-cap tech stocks in hedge fund long portfolios has doubled YTD. Data available on request.
Source: Goldman Sachs Global Investment Research

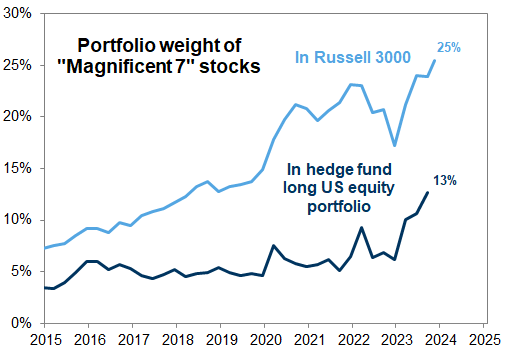
Exhibit 19: Hedge funds added to positions in mega-cap tech stocks during 3Q

19. Hedge funds added to positions in mega-cap tech stocks during 3Q. Data available on request.
Source: Goldman Sachs Global Investment Research
Hedge fund portfolio rotations during 3Q also reflected a focus on GLP-1 drugs. While AI optimism helped boost hedge fund ownership of the mega-cap tech stocks, GLP-1 enthusiasm lifted LLY to the top of our Rising Stars list of stocks with the largest increase in hedge fund popularity (Exhibit 43). LLY also remains a member of our Hedge Fund VIP list of the most popular long positions, its third consecutive quarter on the list. However, some positions indicated an expectation of mean-reversion in the GLP-1 trade. ABT and PODD, both members of our Global Banking & Markets division's GLP-1 "At Risk" basket, also ranked as Rising Stars after declining during 3Q. In contrast, BSX, another member of the "At Risk" basket, landed on the Falling Stars list this quarter.

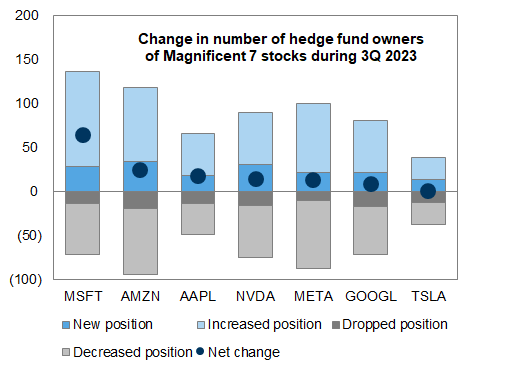
Exhibit 20: AI and GLP-1 themes have captured market focus this year

AI basket pair = GSTMTAIP Index; GLP-1 basket pair = GSPUGLPP Index
20. AI and GLP-1 themes have captured market focus this year. Data available on request.
Source: Goldman Sachs Global Banking & Markets, Goldman Sachs Global Investment Research
Widespread hedge fund ownership of mega-caps and their recent outperformance has shifted the composition of hedge fund portfolios in favor of large stocks. At the start of 2023, Russell 2000 constituents accounted for 25% of hedge fund long portfolios, but that share registered 19% at the start of 4Q. Nonetheless, funds remain relatively concentrated in mid- and small-caps compared to their shares of overall equity market capitalization.

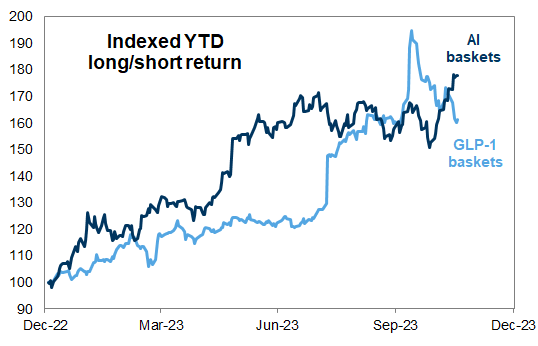
Exhibit 21: Small-cap weight in hedge fund portfolios has declined as large stocks have outperformed

21. Small-cap weight in hedge fund portfolios has declined as large stocks have outperformed. Data available on request.
Source: Goldman Sachs Global Investment Research

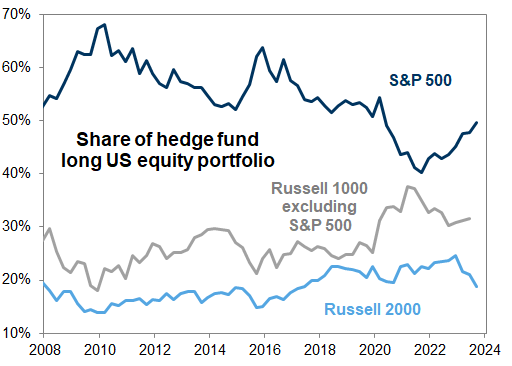
Exhibit 22: Hedge funds remain concentrated in small stocks compared to the market

22. Hedge funds remain concentrated in small stocks compared to the market. Data available on request.
Source: FactSet, Goldman Sachs Global Investment Research

Concentration, crowding, and turnover

Concentration within the typical hedge fund portfolio and crowding across fund portfolios both increased during 3Q 2023. The typical hedge fund holds 70% of its long portfolio in its top 10 positions, matching the highest concentration on record outside of 4Q 2018. Our Hedge Fund Crowding Index[1] registered the most crowding across hedge fund long portfolios in our 22-year data history.

Exhibit 23: Hedge fund portfolio density increased

holdings as of September 30, 2023
23. Hedge fund portfolio density increased. Data available on request.
Source: Goldman Sachs Global Investment Research

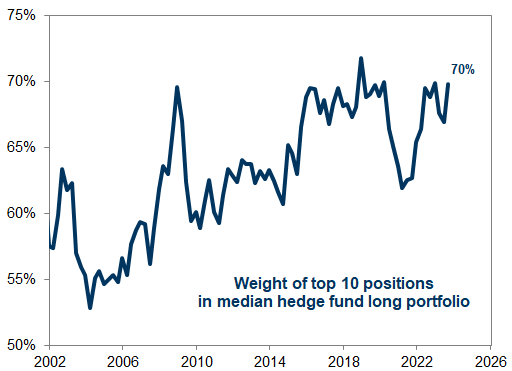
Exhibit 24: Crowding across hedge funds increased in 3Q

holdings as of September 30, 2023
24. Crowding across hedge funds increased in 3Q. Data available on request.
Source: Goldman Sachs Global Investment Research
Portfolio position turnover declined last quarter. During 3Q, the average fund turned over 23% of its distinct equity positions and 13% of the largest quartile of positions. Turnover varied across sectors, dipping the most in Health Care and Financials while increasing in Consumer Staples and Utilities.

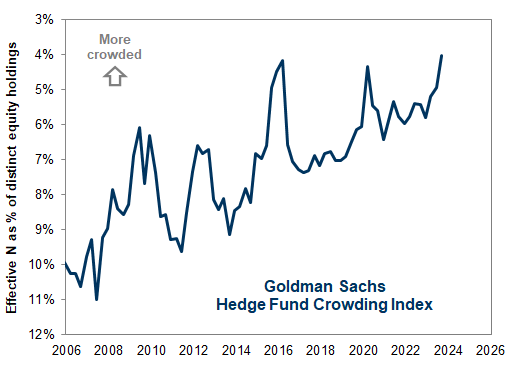
Exhibit 25: Portfolio turnover decreased in 3Q

holdings as of September 30, 2023
25. Portfolio turnover decreased in 3Q. Data available on request.
Source: Goldman Sachs Global Investment Research

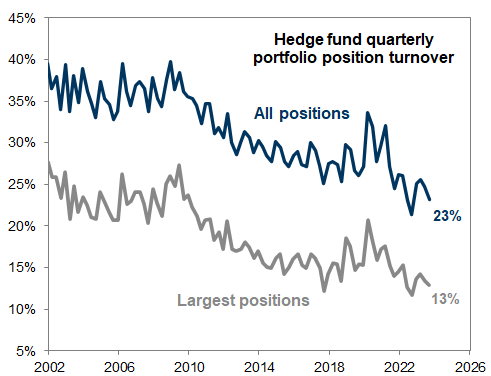
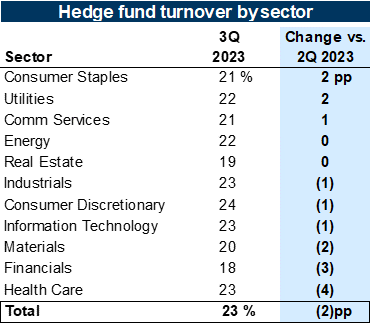
Exhibit 26: Portfolio position turnover varied across sectors

holdings as of September 30, 2023
26. Portfolio position turnover varied across sectors. Data available on request.
Source: Goldman Sachs Global Investment Research

Sector positions

Info Tech remained the largest hedge fund net sector weight at the start of 4Q, capturing 20% of total net exposure, but nonetheless registered the largest "underweight" relative to the Russell 3000 (-486 bp). Health Care remained the largest overweight (+660 bp). Hedge fund and mutual fund sector tilts are generally in the same directions, with Energy and Financials the exceptions: Mutual funds are overweight both sectors versus their benchmarks while hedge funds are underweight relative to the Russell 3000.

Exhibit 27: Hedge fund sector allocations relative to the Russell 3000 and large-cap mutual funds

holdings as of September 30, 2023
27. Hedge fund sector allocations relative to the Russell 3000 and large-cap mutual funds. Data available on request.
Source: FactSet, Goldman Sachs Global Investment Research
Hedge funds rotated sharply toward the Tech sector during 3Q. Funds increased their net tilt to Info Tech by 489 bp, the largest change of any sector, reducing their underweight tilt from nearly the largest on record in mid-2023 to roughly the average tilt of the last few years. In contrast, hedge funds chopped exposure to Energy (-167 bp), Health Care (-160 bp), and Industrials (-132 bp).

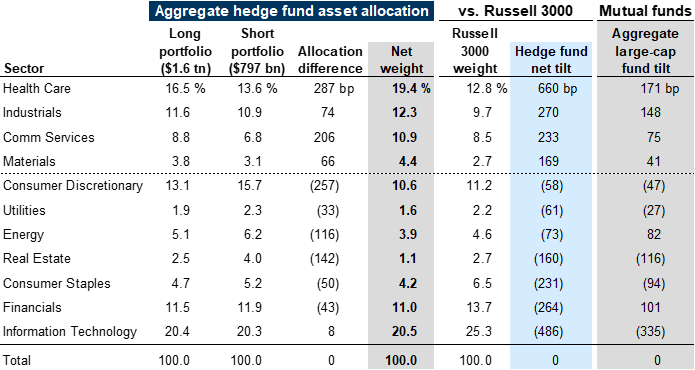
Exhibit 28: Changes in hedge fund sector tilts during 3Q

excludes ETF positions
28. Changes in hedge fund sector tilts during 3Q. Data available on request.
Source: FactSet, Goldman Sachs Global Investment Research

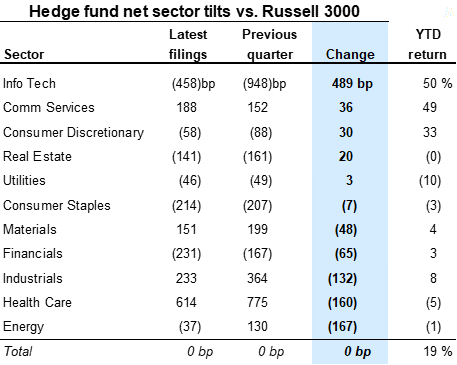
Exhibit 29: Funds added to tech during 3Q

holdings as of September 30, 2023
29. Funds added to tech during 3Q. Data available on request.
Source: FactSet, Goldman Sachs Global Investment Research
Within Info Tech, hedge funds became incrementally more overweight relative to the Russell 3000 in 9 of 12 subsectors. The largest increases were in Systems Software and Tech Hardware, driven by MSFT and AAPL as those stocks each dipped by about 10% during 3Q. For the largest changes within Info Tech at the stock level, see Exhibit 31 below, which compares the number of funds establishing new positions or adding to existing positions in each stock versus the number of funds trimming or dropping their positions altogether.

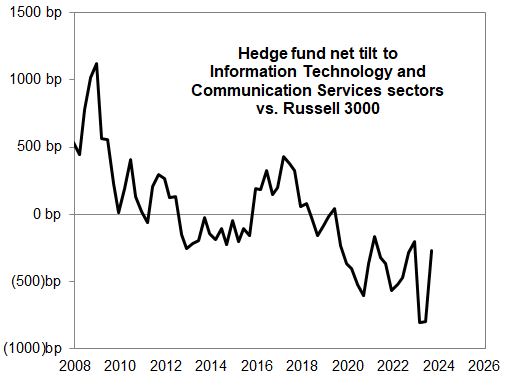
Exhibit 30: Subsector tilts and changes in tilts

holdings as of September 30, 2023
30. Subsector tilts and changes in tilts. Data available on request.
Source: FactSet, Goldman Sachs Global Investment Research

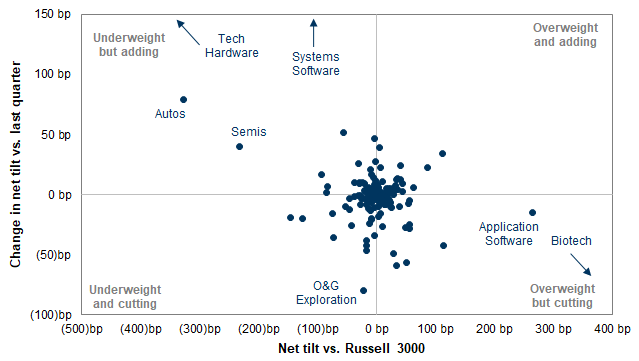
Exhibit 31: Info Tech stocks with the largest net increase in hedge fund popularity last quarter

holdings as of September 30, 2023
31. Info Tech stocks with the largest net increase in hedge fund popularity last quarter. Data available on request.
Source: FactSet, Goldman Sachs Global Investment Research
In contrast, hedge funds cut exposure in 6 of 7 Energy subsectors. Integrated Oil & Gas was the sole exception as funds increased exposure to BP and SU. See Exhibit 32 for a list of Energy stocks with the largest net decrease in hedge fund popularity.

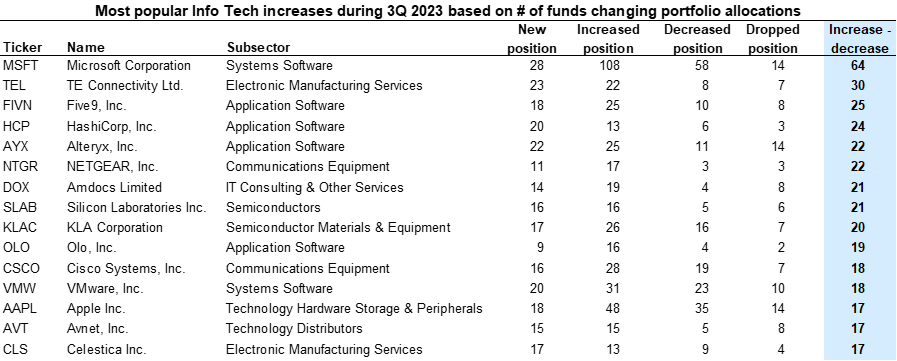
Exhibit 32: Energy stocks with the largest net decrease in hedge fund popularity last quarter

holdings as of September 30, 2023
32. Energy stocks with the largest net decrease in hedge fund popularity last quarter. Data available on request.
Source: FactSet, Goldman Sachs Global Investment Research
Hedge funds entered 4Q with nearly their smallest net tilt to Energy since 2007. At the other end of the distribution, while Financials is a large underweight, the tilt in that sector ranks in the 92nd percentile vs. the past decade.

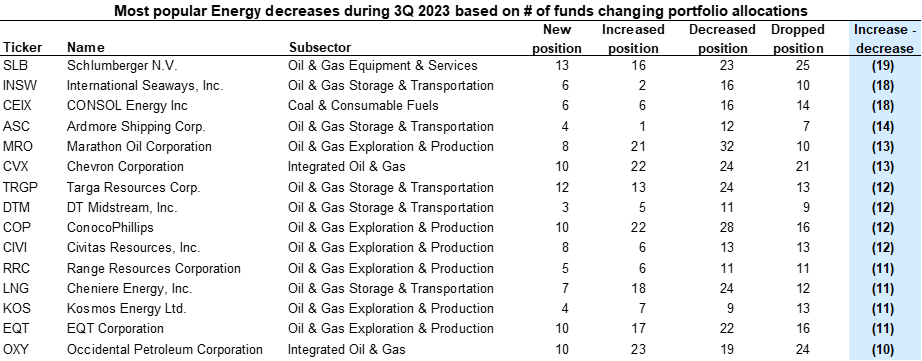
Exhibit 33: Hedge fund net sector tilts relative to past decade

holdings as of September 30, 2023; excludes ETF positions
33. Hedge fund net sector tilts relative to past decade. Data available on request.
Source: FactSet, Goldman Sachs Global Investment Research

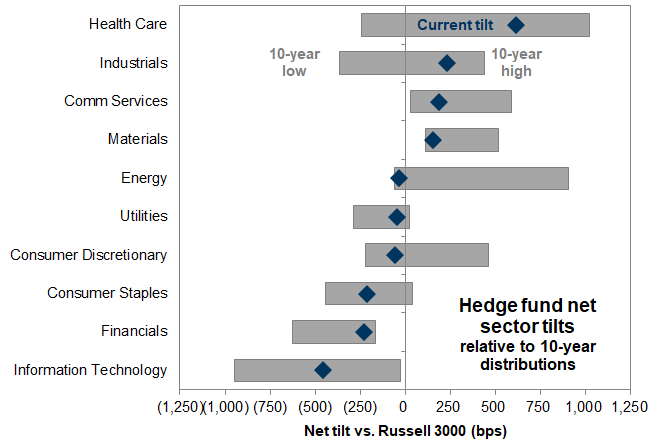
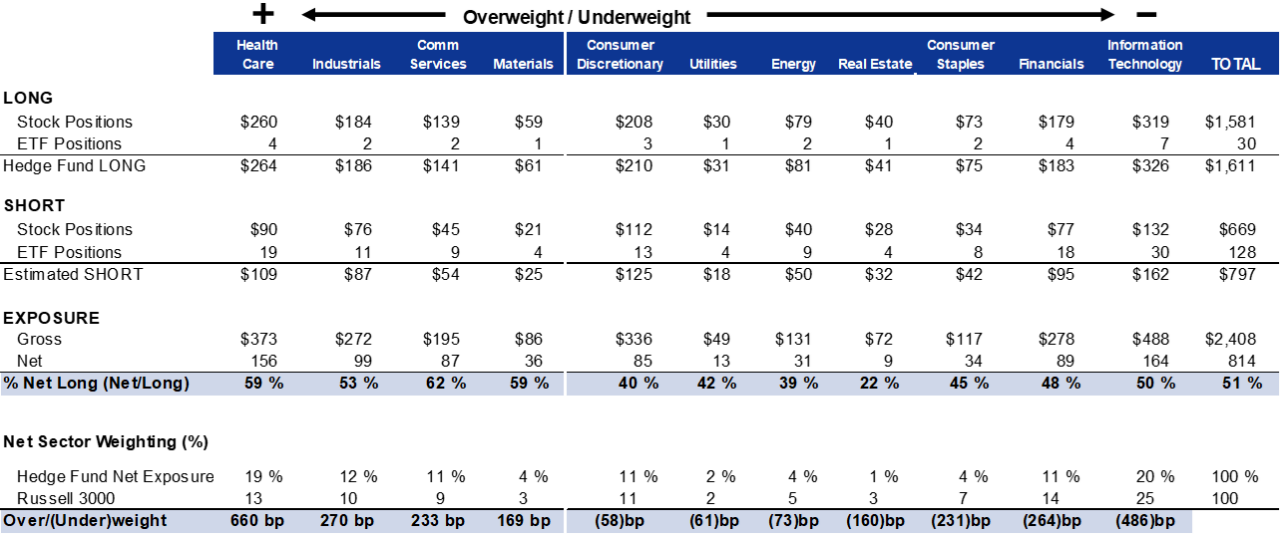
Exhibit 34: Estimated hedge fund long, short, and net exposure, by sector ($ in billions)

holdings as of September 30, 2023
34. Estimated hedge fund long, short, and net exposure, by sector ($ in billions). Data available on request.
Source: FactSet, Goldman Sachs Global Investment Research

The Hedge Fund VIP List: "The stocks that matter most"

Our Hedge Fund VIP list (ticker: GSTHHVIP) contains the top long positions of fundamentally-driven hedge funds. These "stocks that matter most” are the positions that appear most frequently among the top 10 holdings within hedge fund portfolios. For this analysis, we limit our universe to hedge funds with 10 to 200 distinct equity positions in an attempt to isolate fundamentally-driven investors from quantitative funds or funds that mirror private equity investments.
From an implementation standpoint, the Hedge Fund VIP list represents a tool for investors seeking to “follow the smart money” based on 13-F filings. By construction, the VIP list identifies the 50 stocks whose performance will largely influence the long side of many fundamentally driven hedge funds.
The Hedge Fund VIP basket has outperformed the S&P 500 YTD (+31% vs. +19%) and has outperformed the S&P 500 in 59% of quarters since 2001. The basket has been a strong historical performer at the cost of high volatility. The outperformance this year is a reversal from 2021 and 2022, when the basket underperformed the S&P 500 by 30 pp.
Our Hedge Fund VIP basket is not sector-neutral to the S&P 500. The VIP list contains stocks from 10 of the 11 sectors, with Real Estate absent. Information Technology (24%) represents the largest weight in the basket.
Turnover for the basket during 3Q 2023 was around the historical average, with 14 new stocks entering the list (28%). New constituents are listed in bold in Exhibit 36.

Exhibit 35: Hedge fund VIPs have outperformed by 43 bp on average each quarter since 2001 (90 quarters)

as of November 15, 2023
35. Hedge fund VIPs have outperformed by 43 bp on average each quarter since 2001 (90 quarters). Data available on request.
Source: Goldman Sachs Global Investment Research

GSTHHVIP: The 50 stocks that matter most to hedge funds

Exhibit 36: Very Important Positions (VIP) for hedge funds

new stocks in basket listed in bold; holdings as of September 30, 2023; pricing as of November 14, 2023; based on 554 funds with 10-200 distinct US equity positions
36. Very Important Positions (VIP) for hedge funds. Data available on request.
Source: Solactive, FactSet, data compiled by Goldman Sachs Global Investment Research

The most concentrated hedge fund positions

Since 2001, the strategy of buying the 20 most concentrated S&P 500 stocks has outperformed the broad index in 59% of quarters, with an average quarterly excess return of 134 bp per quarter. We define “concentration” as the share of market capitalization owned in aggregate by hedge funds. The High Concentration basket is not sector-neutral to the S&P 500, and the stocks tend to be mid-caps, at the lower end of the S&P 500 capitalization distribution. Hedge funds own 12% of the market cap of the average constituent in the High Concentration basket, 3% of the average S&P 500 stock, and less than 1% of the average constituent in our Low Concentration basket.

Exhibit 37: Hedge fund concentration baskets versus the S&P 500

as of November 15, 2023
37. Hedge fund concentration baskets versus the S&P 500. Data available on request.
Source: Goldman Sachs Global Investment Research
The High Hedge Fund Concentration basket has underperformed the S&P 500 by 19 pp YTD and the Low Concentration basket has underperformed by 12 pp. Stocks with low hedge fund concentration often trade with low betas and outperform during periods of market stress. The Low Concentration basket outperformed by 13 pp in 2022.
Eight new High Concentration basket stocks this quarter: CZR, DLTR, HLT, SYF, TPR, TTWO, WDC, WYNN.

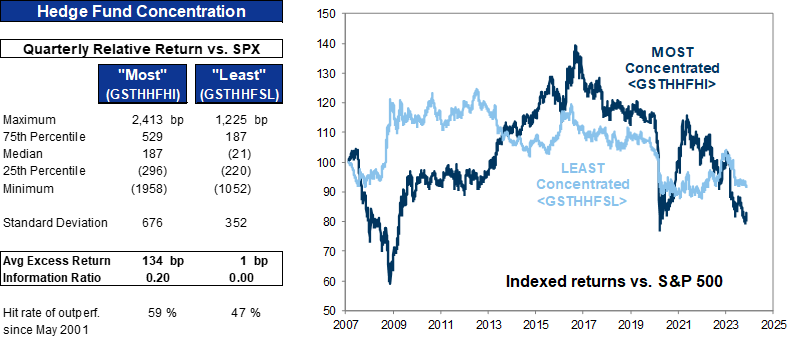
Exhibit 38: The most concentrated stocks have underperformed the S&P 500 by 19 pp YTD

as of November 15, 2023
38. The most concentrated stocks have underperformed the S&P 500 by 19 pp YTD. Data available on request.
Source: FactSet, Goldman Sachs Global Investment Research

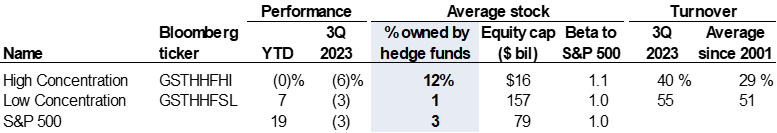
Goldman Sachs S&P 500 hedge fund concentration baskets

Exhibit 39: The 20 S&P 500 stocks with the most concentrated hedge fund ownership <ticker: GSTHHFHI>

holdings as of September 30, 2023; pricing as of November 15, 2023; new constituents in bold
39. The 20 S&amp;P 500 stocks with the most concentrated hedge fund ownership &lt;ticker: GSTHHFHI&gt;. Data available on request.
Source: FactSet, data compiled by Goldman Sachs Global Investment Research

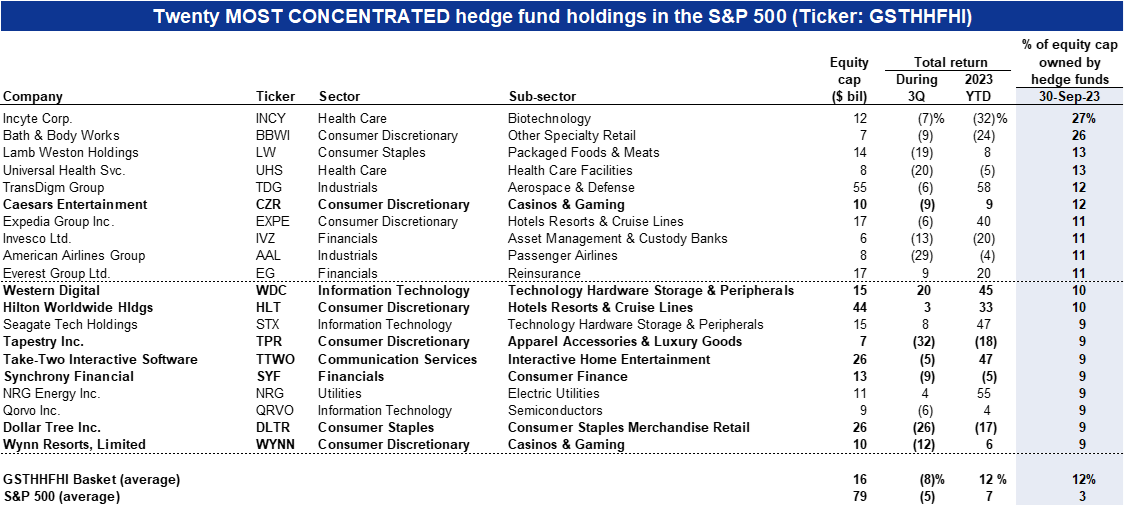
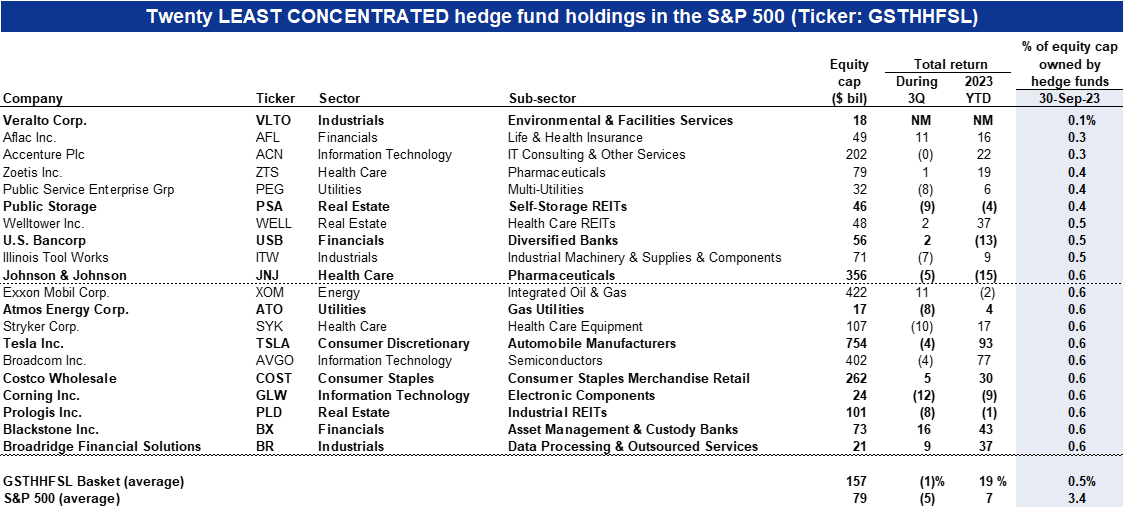
Exhibit 40: The 20 S&P 500 stocks with the least hedge fund concentration <ticker: GSTHHFSL>

holdings as of September 30, 2023; pricing as of November 15, 2023; new constituents in bold
40. The 20 S&amp;P 500 stocks with the least hedge fund concentration &lt;ticker: GSTHHFSL&gt;. Data available on request.
Source: FactSet, data compiled by Goldman Sachs Global Investment Research

Rising and falling stars

Changes in popularity with hedge fund investors can be strong signals for future stock performance. During the last 20 years, stocks with the largest increase in the number of hedge fund investors ("Rising Stars") have typically gone on to outperform sector peers during the quarters following their rise in popularity. "Falling Star" stocks with the largest decline in number of owners have subsequently underperformed peers by a similar magnitude. The Rising Stars we highlighted based on last quarter's 13-F filings have outperformed the Russell 1000 and the Falling Stars in recent months.

Exhibit 41: Change in popularity has been a signal for forward returns

returns since 2002
41. Change in popularity has been a signal for forward returns. Data available on request.
Source: Goldman Sachs Global Investment Research

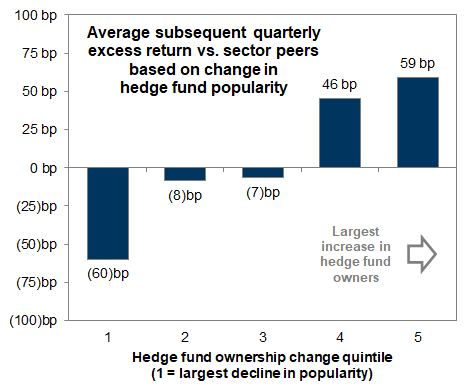
Exhibit 42: Last quarter's Rising Stars have outperformed Falling Stars and the Russell 1000

as of November 15, 2023
42. Last quarter's Rising Stars have outperformed Falling Stars and the Russell 1000. Data available on request.
Source: Goldman Sachs Global Investment Research
The tables below show our new lists of Rising and Falling Stars based on the most recent position filings. AMZN is the only Rising Star that was in the same list last quarter. None of the Falling Stars appeared in the same list last quarter.

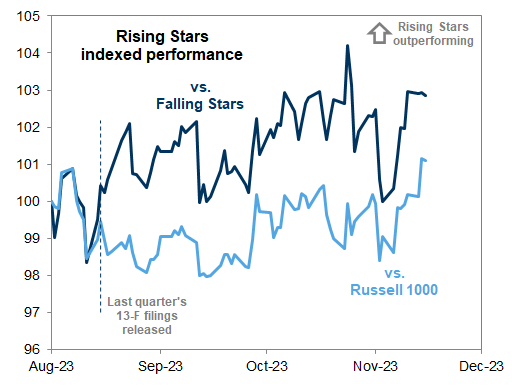
Exhibit 43: Rising stars: Russell 1000 stocks with the largest increase in number of hedge fund owners during 3Q 2023

43. Rising stars: Russell 1000 stocks with the largest increase in number of hedge fund owners during 3Q 2023. Data available on request.
Source: FactSet, Goldman Sachs Global Investment Research

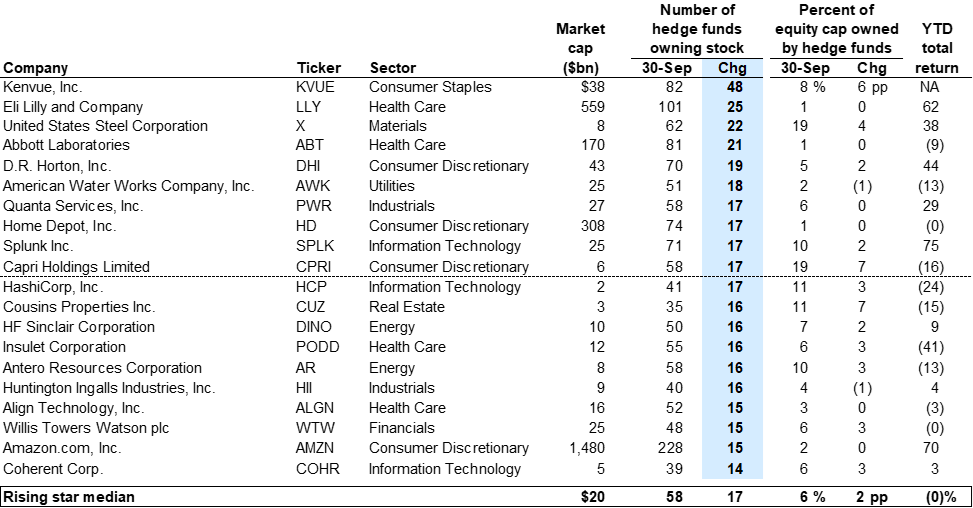
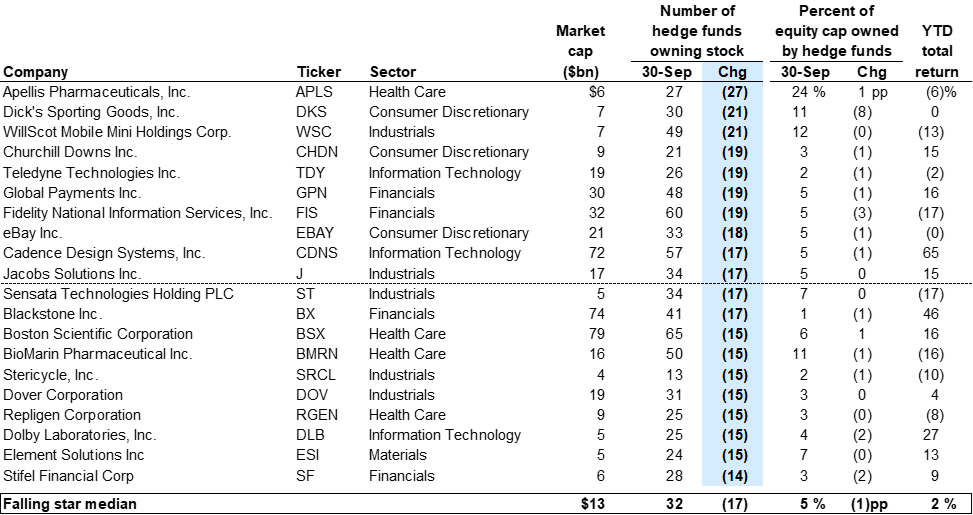
Exhibit 44: Falling stars: Russell 1000 stocks with the largest decrease in number of hedge fund owners during 3Q 2023

44. Falling stars: Russell 1000 stocks with the largest decrease in number of hedge fund owners during 3Q 2023. Data available on request.
Source: FactSet, Goldman Sachs Global Investment Research

ETF ownership

The ETF share of hedge fund long portfolios increased during 3Q. The current share of 2.7% is the highest since 4Q 2021 and above the average for the past decade.
The $181 billion of ETF shorts accounts for 80% of gross hedge fund ETF exposure. Funds use ETFs more as hedging tools than as directional investments. In contrast, single-stock shorts constitute just 30% of gross single-stock positions.

Exhibit 45: Hedge fund ETF long exposure

holdings as of September 30, 2023
45. Hedge fund ETF long exposure. Data available on request.
Source: FactSet, Goldman Sachs Global Investment Research

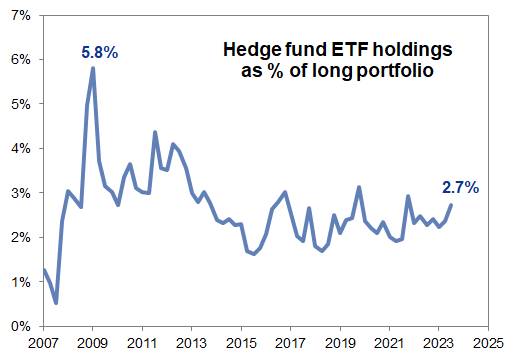
Exhibit 46: Hedge fund positions in sector ETFs

holdings as of September 30, 2023
46. Hedge fund positions in sector ETFs. Data available on request.
Source: FactSet, Goldman Sachs Global Investment Research
The table below shows the top 20 ETFs based on hedge fund gross exposure at the start of 4Q 2023.

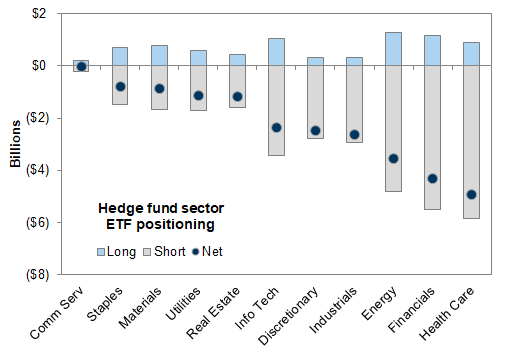
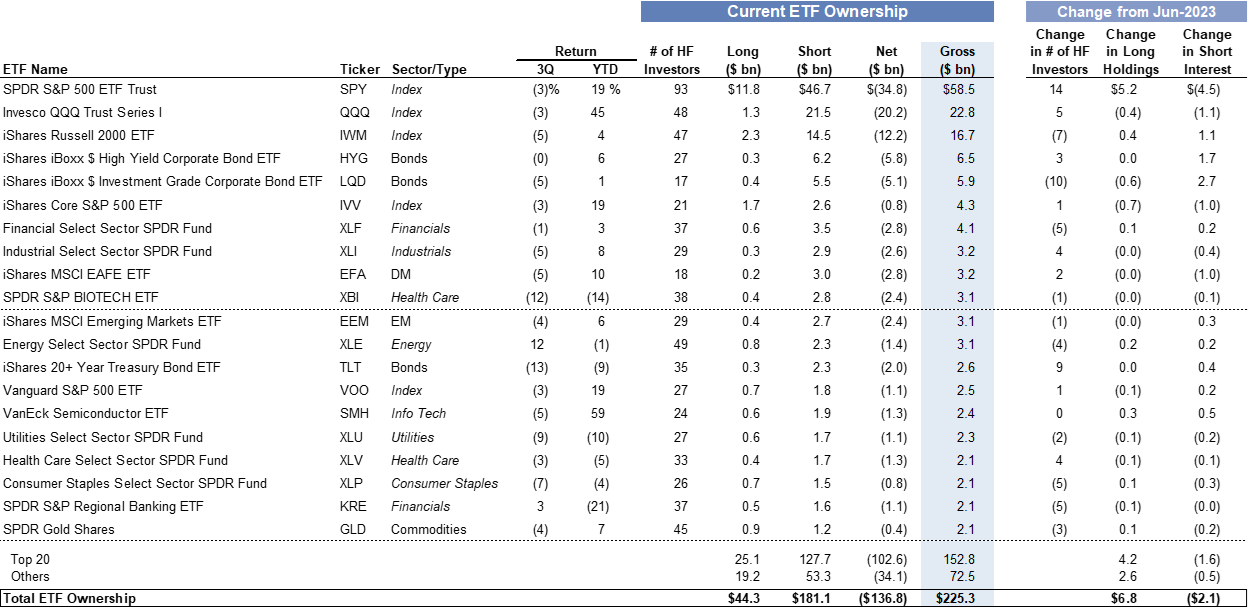
Exhibit 47: Top 20 ETFs by hedge fund ownership (long and short)

holdings as of September 30, 2023; pricing as of November 15, 2023
47. Top 20 ETFs by hedge fund ownership (long and short). Data available on request.
Source: FactSet, Goldman Sachs Global Investment Research

The Very Important Short Position List

Our Very Important Short Position list (ticker: GSTHVISP) is designed as a short hedge for the Hedge Fund VIP List long portfolio. The equal-weighted basket consists of 50 S&P 500 constituents with the highest total dollar value of short interest outstanding. The VISP basket excludes companies in our long VIP List and stocks with more than 10% of float-adjusted shares held short to allow for sufficient liquidity.
Because the Hedge Fund VIP List consists of 50 equal-weighted stocks, when hedging the long portfolio with the market-cap weighted S&P 500, long positions with S&P 500 weights greater than 2% will be implicitly underweight. By addressing this issue and incorporating information about shorts disclosed by the exchanges, we believe we have created a better approximation of hedge fund short-side performance to use as a hedge.
We use the total dollar value of short interest outstanding as an estimate of hedge fund short portfolio holdings. Short positions in large-cap stocks can be significant on a total dollar value basis even though these stocks typically have less short interest as a percentage of shares outstanding as a result of their size. Constituents of this basket are not based on 13-F holdings and these are not stocks with the highest percentage of short interest. See Appendix A for a screen of stocks with the largest outstanding short interest as a share of market cap.
The long GSTHHVIP/short GSTHVISP pair has performed far better than the long GSTHHVIP/short S&P 500 pair. The long/short VIP pair has generated an average quarterly return of 107 bp (4.3% annualized) since 2001, with a 64% quarterly hit rate of outperformance.

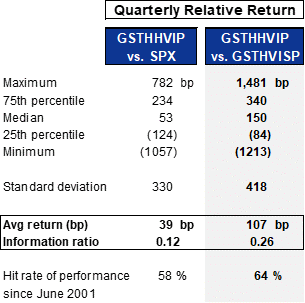
Exhibit 48: Hedge fund VIP basket pairs

48. Hedge fund VIP basket pairs. Data available on request.
Source: Goldman Sachs Global Investment Research

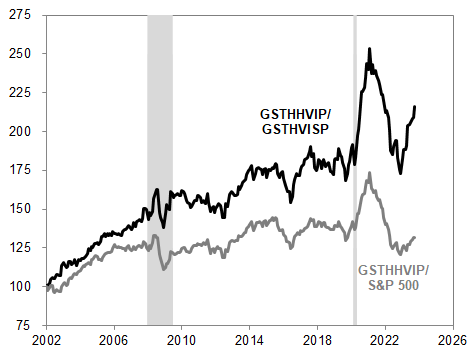
Exhibit 49: Information ratio of VIP vs. VISP is 0.26

49. Information ratio of VIP vs. VISP is 0.26. Data available on request.
Source: Goldman Sachs Global Investment Research

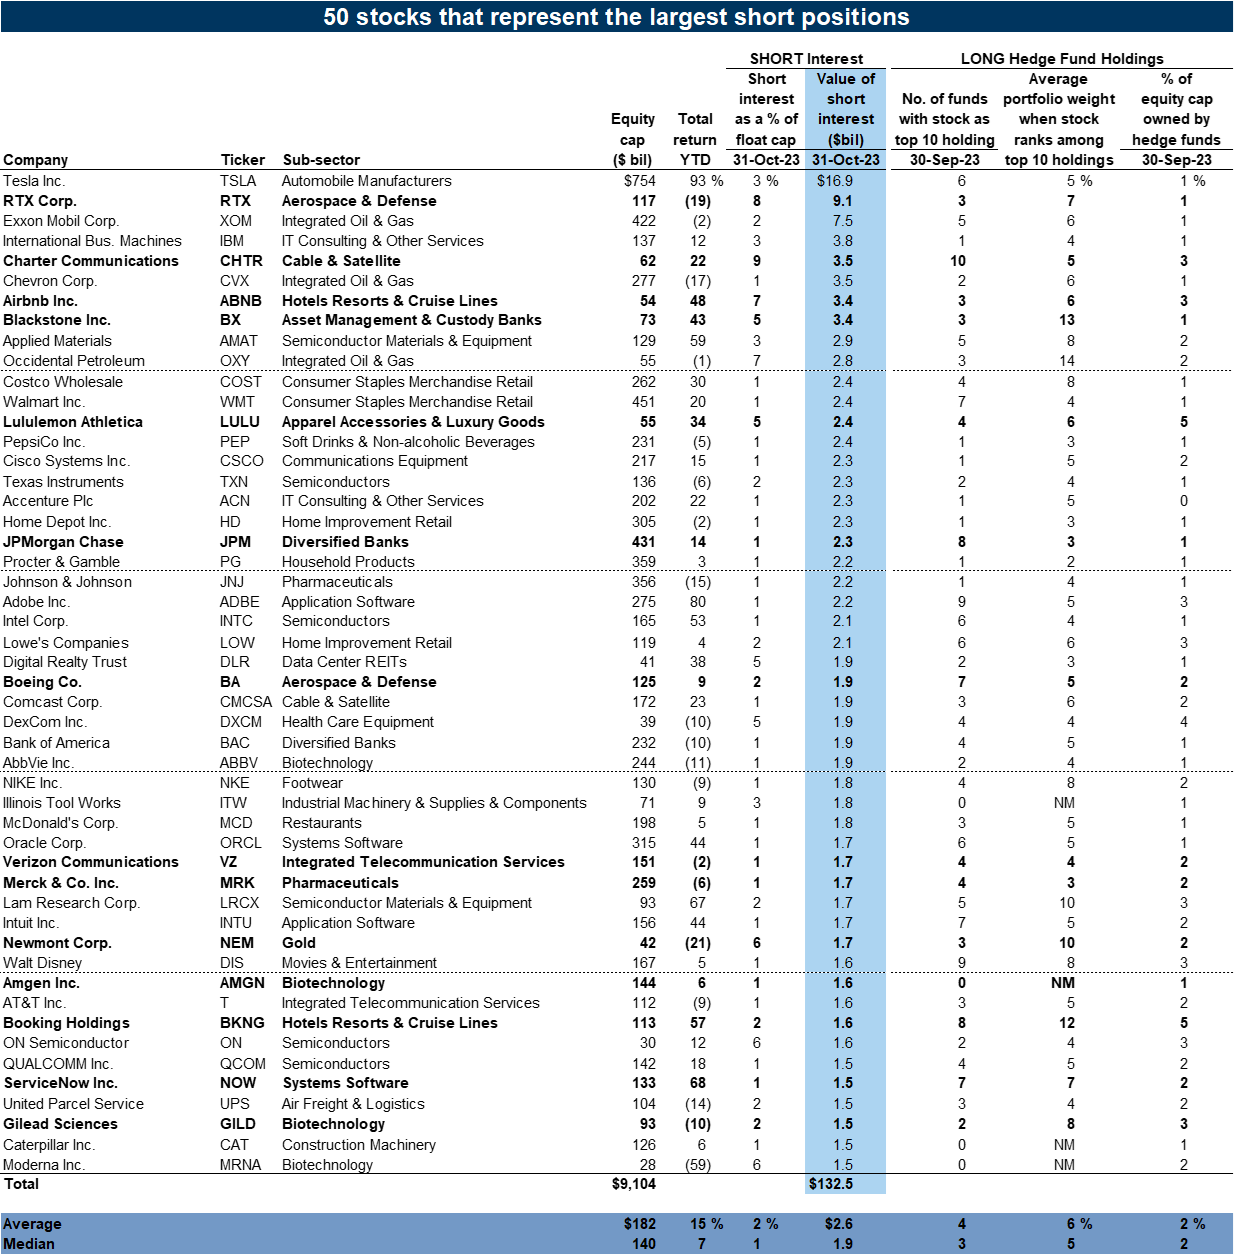
GSTHVISP: 50 stocks representing the largest short positions

Exhibit 50: Very Important Short Positions (VISP) for hedge funds

new stocks in basket listed in bold; short interest as of October 31, 2023; pricing as of November 15, 2023
50. Very Important Short Positions (VISP) for hedge funds. Data available on request.
Source: FactSet, data compiled by Goldman Sachs Global Investment Research

Appendix A: Hedge fund data tables

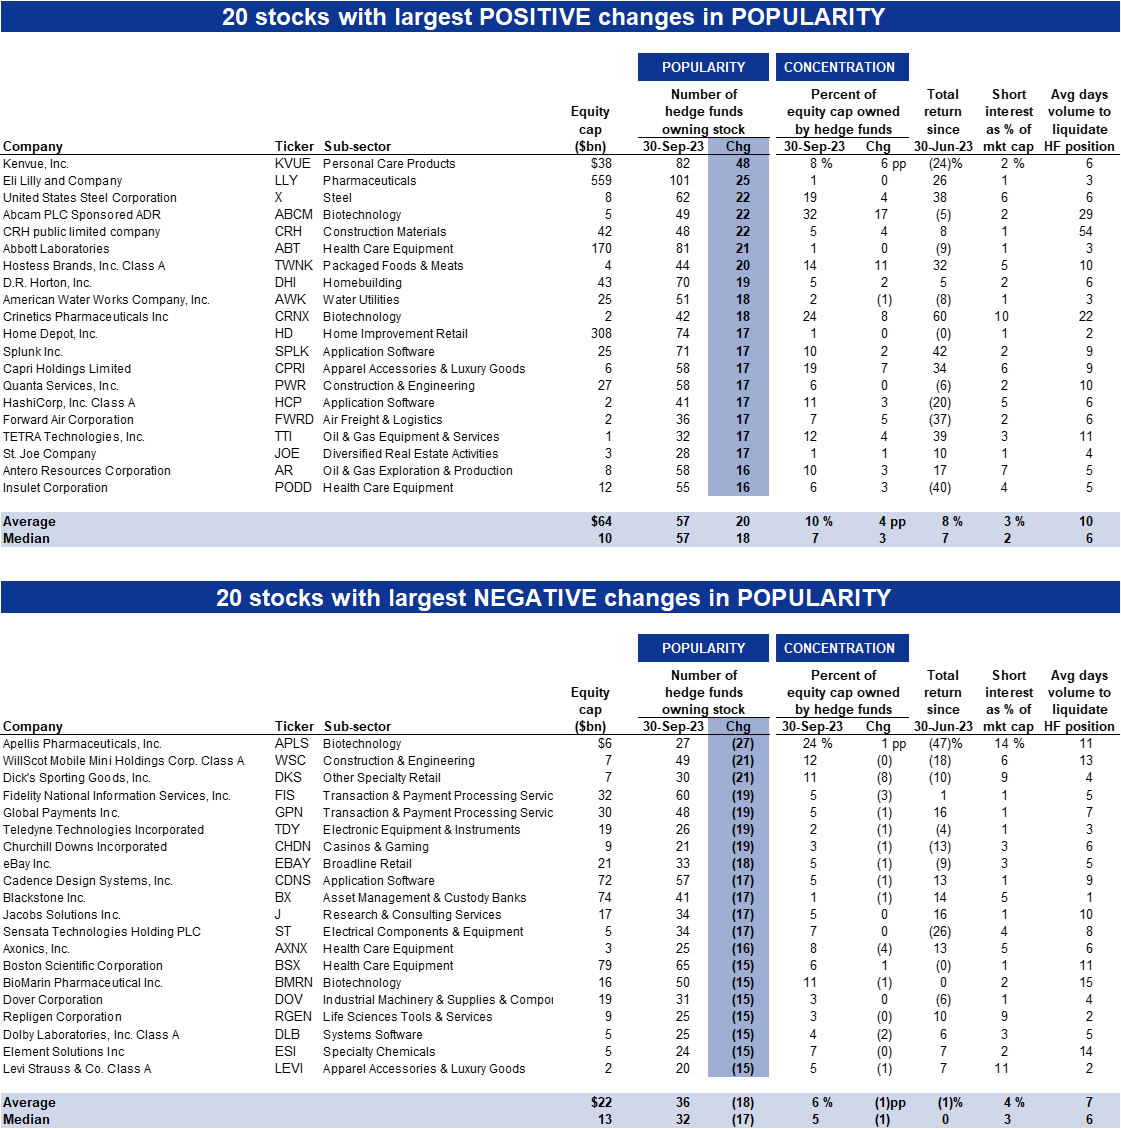
Change in popularity: Largest increase and decrease in number of hedge fund owners

Exhibit 51: Change in popularity during 3Q 2023

51. Change in popularity during 3Q 2023. Data available on request.
Source: FactSet, compiled by Goldman Sachs Global Investment Research

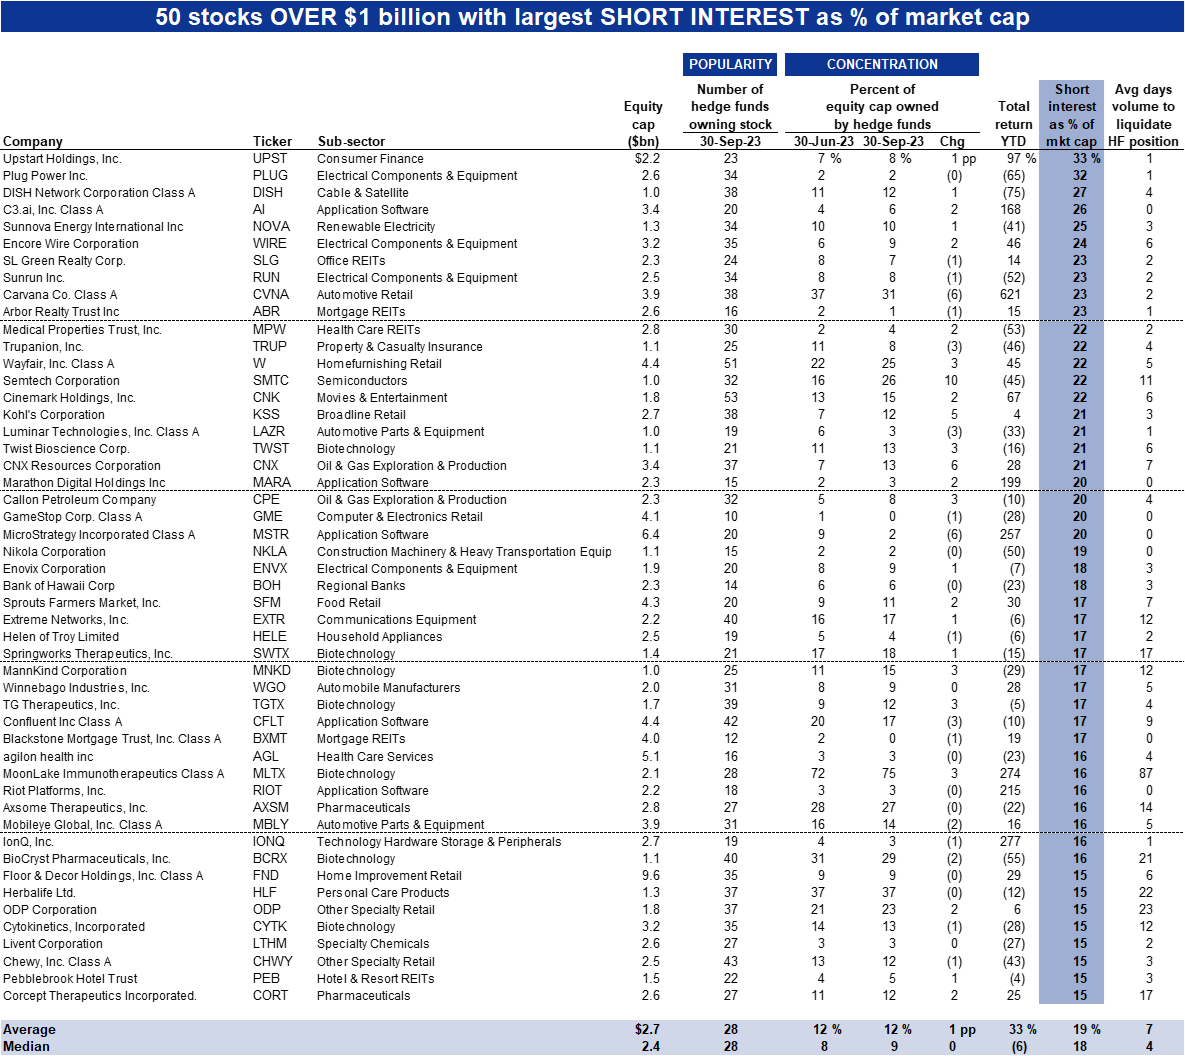
Concentrated shorts: Highest short interest outstanding as a percentage of market cap

Exhibit 52: Highest short interest: Stocks over $1 billion in market cap

52. Highest short interest: Stocks over $1 billion in market cap. Data available on request.
Source: FactSet, Compiled by Goldman Sachs Global Investment Research

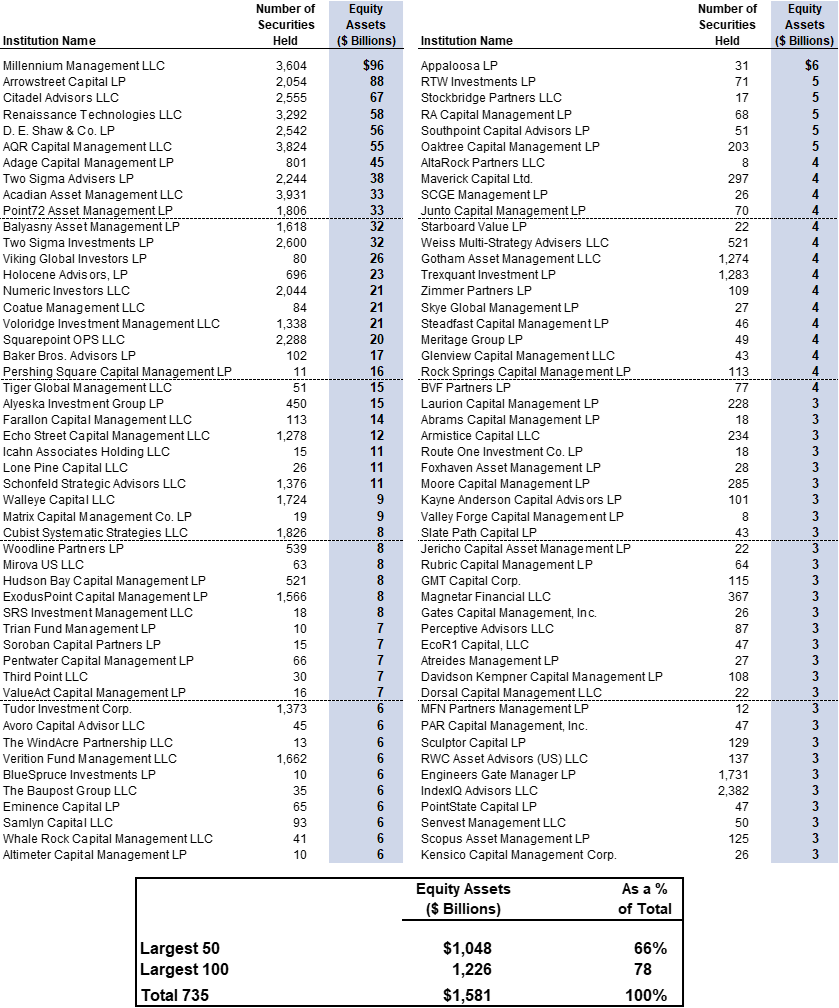
Appendix B: 100 largest hedge funds in our analysis ranked by equity assets

Data available on request.
Source: FactSet, data compiled by Goldman Sachs Global Investment Research

Appendix C: Drawbacks of our hedge fund holding analysis

Data limitations

One weakness of our analysis is that it excludes any synthetic positions that hedge funds may create through the use of derivative contracts (options, swaps, futures). Such financial instruments are not required to be disclosed in public filings.
We track both natural and leveraged long positions based on filings of hedge fund holdings. However, a hedge fund could offset a long position that we are able to monitor with a synthetic short position in options or futures on the underlying stock or an index of similar stocks that we currently are not able to monitor because the data on such trades and positions is not disclosed. These positions could either magnify or reduce the conclusions of our Hedge Fund Trend Monitor.

Lack of international holdings

Hedge funds are not required to include foreign holdings in their 13-F filings. Consequently, our analysis may not capture all the long equity positions of hedge funds. While we do not believe this lack of data significantly affects our analysis of holdings by sector and capitalization size, we may overestimate the “density” of hedge fund portfolios.

Incomplete reporting of short positions

Our data is limited to publicly disclosed short interest statistics released by the exchanges. Only US broker-dealers are required to report short positions to these exchanges, so we miss any shorts held in overseas accounts. Swaps and other derivatives are also not captured in this analysis. We assume that hedge funds account for 85% of all short interest in the market and that the short side of hedge fund portfolios mirrors the overall short market in terms of sector allocation.

Timeliness

Another potential weakness of our analysis relates to the timeliness of the reported data. For example, the equity holdings for the 735 hedge funds we studied were based on 13-F filings of positions owned as of September 30, 2023, although these filings were not made public until mid-November 2023.
Importantly, we believe our analysis of hedge fund holdings based on 13-F filings with 45-day delays is generally more reflective of actual current holdings than many market participants are inclined to believe.
Hedge fund holdings turnover is lower than most expect. On average, 77% of stocks that were in hedge fund portfolios on June 30, 2023 also appeared in portfolios on September 30, 2023. Because the overall holdings picture was surprisingly constant, we think it is reasonable to believe that the most recent holdings data remain relevant today.
  1. 1 ^ Hedge Fund Crowding Index is measured as the effective N (calculated as 1/Σ[weight2]) divided by the number of distinct equities in the aggregate portfolio of hedge funds with between 10 and 200 individual equity positions.

Investors should consider this report as only a single factor in making their investment decision. For Reg AC certification and other important disclosures, see the Disclosure Appendix, or go to www.gs.com/research/hedge.html.