The market’s sensitivity to individual data releases has increased sharply over the last couple of years, as those releases will ultimately decide Fed policy. However, two data quality issues have made assessing the implications of data releases for the outlook in real time more difficult.
First, distortions to seasonal adjustment factors caused by level shifts and much larger than usual swings in data early in the pandemic can bias our perception of the state of the economy. These distortions are most apparent in continuing jobless claims—which have predictably risen over the last couple of months because of seasonal adjustment issues—and Census retail sales—which will likely underperform “true” consumption activity during the holiday season—but likely affect a broader set of economic indicators.
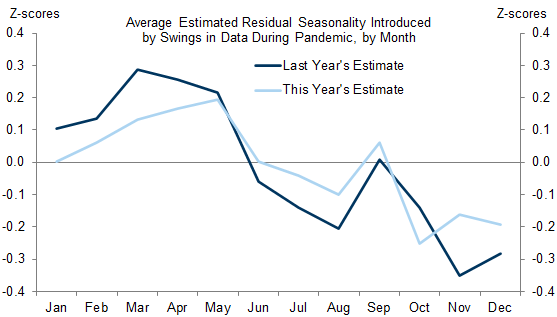
We assess whether revisions to pre-pandemic seasonal factors for 22 indicators have introduced new seasonal distortions. Our analysis suggests that, on average, residual seasonality boosts seasonally-adjusted economic indicators by 0.2 standard deviations between March and May—the period when economic activity declined most sharply in 2020—and weighs them down during the rest of the year. On average, the effects are modestly smaller than when we conducted the same analysis last year and should continue to fade in future years.
Second, falling response rates to government statistical surveys can increase the uncertainty around the reported state of the economy. For example, the response rate to the Job Openings and Labor Turnover Survey (JOLTS) has plummeted almost 30pp since the start of the pandemic to just over 30%. The resulting smaller sample size has likely boosted its median monthly standard error—a measure of the expected discrepancy between a sample estimate and the true value of a population—by more than 90% relative to 2002-2013 (equivalent to a 90% confidence interval of roughly 700k).
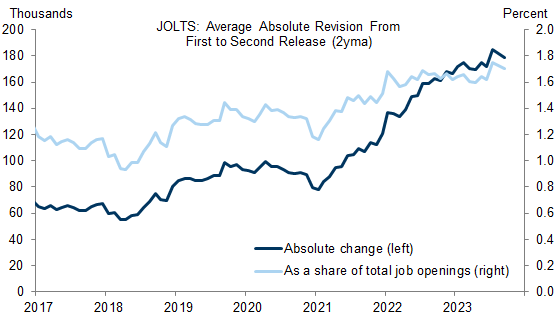
Lower response rates have also likely contributed to larger-than-usual data revisions, as incremental responses can have a greater influence on updated estimates. For example, JOLTS job openings have been revised by an average of 180k in the second print over the last couple of years, double what was typical four years ago and more than triple what was typical six years ago.
Understanding these data quality problems introduced by the pandemic has been vital to interpreting the economic data over the last few years. In particular, it has enabled investors to see through several misleading signals sent by fluctuations in the jobless claims and official job openings data. We have addressed these challenges by calculating our own seasonal adjustment factors when necessary and supplementing official data plagued by low response rates with alternative data based on much larger sample sizes.
Data Quality Is Still a Problem: Seasonal Distortions and Falling Response Rates
Residual Seasonality: Seasonal Echoes of the Pandemic
Exhibit 1: Retail Sales Growth Disappointed Last Holiday Season, as Spending Did Not Grow Proportionally with the Elevated Level of Retail Sales
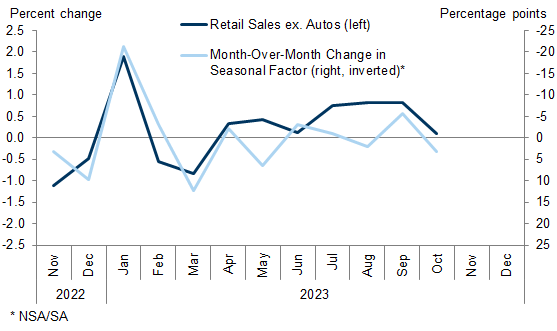
Exhibit 2: Seasonal Patterns Emerged Across Seasonally-Adjusted Continuing Claims Following the Recalculation of Seasonal Factors With Pandemic Era Data
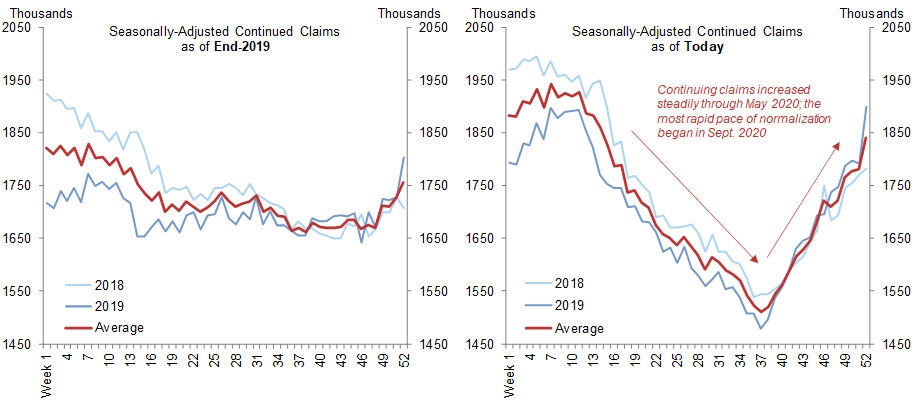
Exhibit 3: Revisions to Pre-Pandemic Data Arising From the Recalculation of Seasonal Factors Have Predicted Changes in Seasonally-Adjusted Continuing Claims This Year
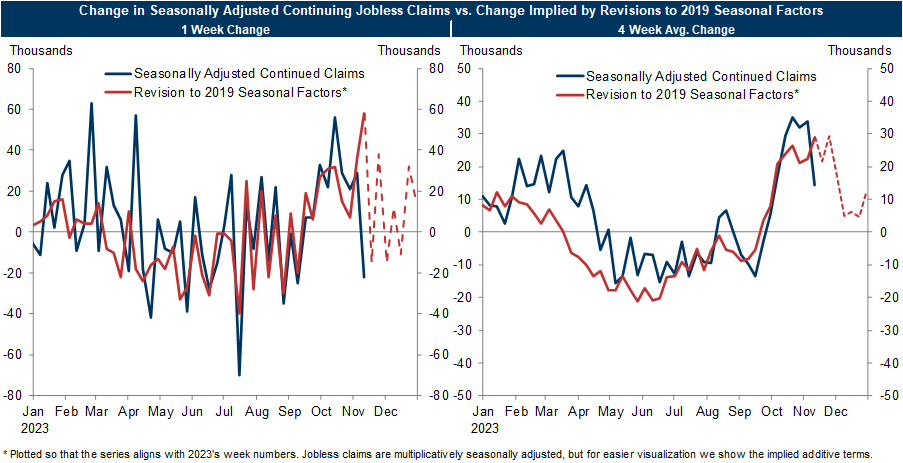
Exhibit 4: Seasonal Distortions Can Alter Our Perception of the State of the Economy: Continuing Claims Have Been Flat Over the Last Couple of Months if Properly Adjusted
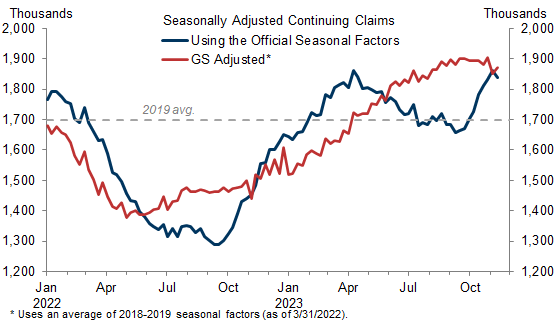
Exhibit 5: On Average, We Estimate That Residual Seasonality Boosts Seasonally-Adjusted Economic Indicators by 0.2 Standard Deviations in March-May and Lowers Them During the Rest of the Year
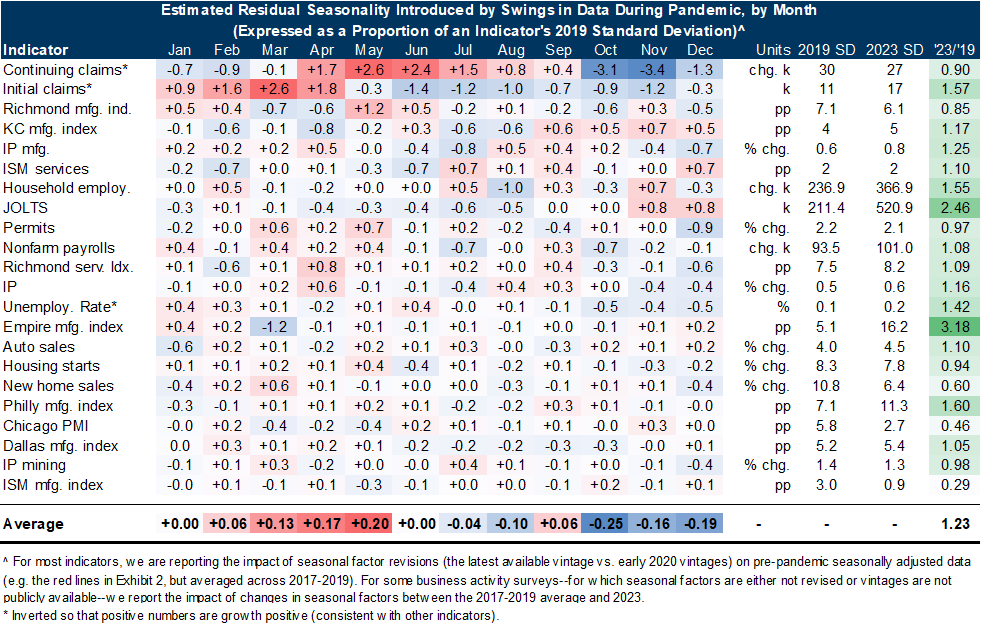
Exhibit 6: Our Estimates of the Impact of Residual Seasonality on Seasonally-Adjusted Economic Indicators Have Declined in Magnitude Relative to Last Year
Falling Response Rates: Would You Answer the Call?
Exhibit 7: The Pandemic Accelerated the Secular Decline in Response Rates to Economic Surveys
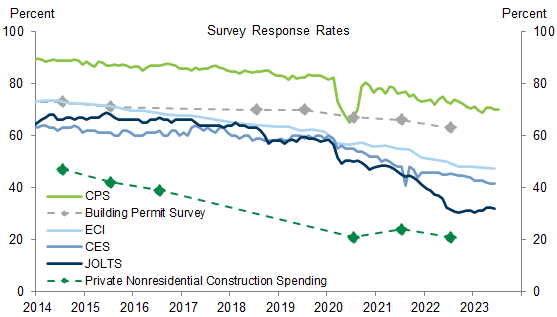
Exhibit 8: A Lower Response Rate Has Likely Pushed the Median Monthly Standard Error for the Job Openings Rate More Than 90% Higher Relative to 2002-2013
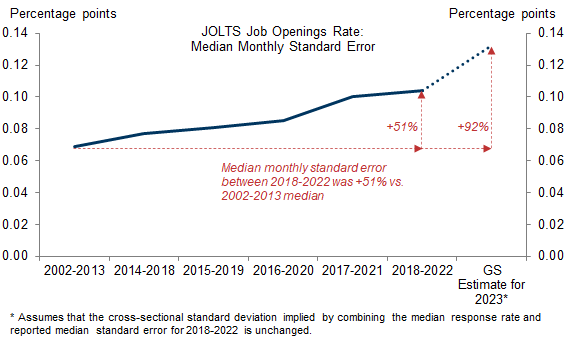
Exhibit 9: The Magnitude of Revisions to JOLTS Has Risen Meaningfully Over the Last Few Years
Ronnie Walker
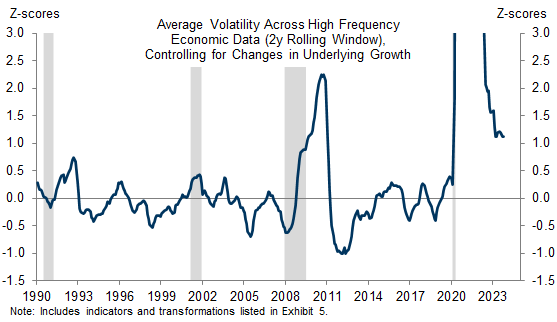
Economic Data Remains More Volatile vs. Pre-Pandemic—Even After Controlling for Changes in Growth—Potentially in Part Because of Lower Response Rates to Economic Surveys
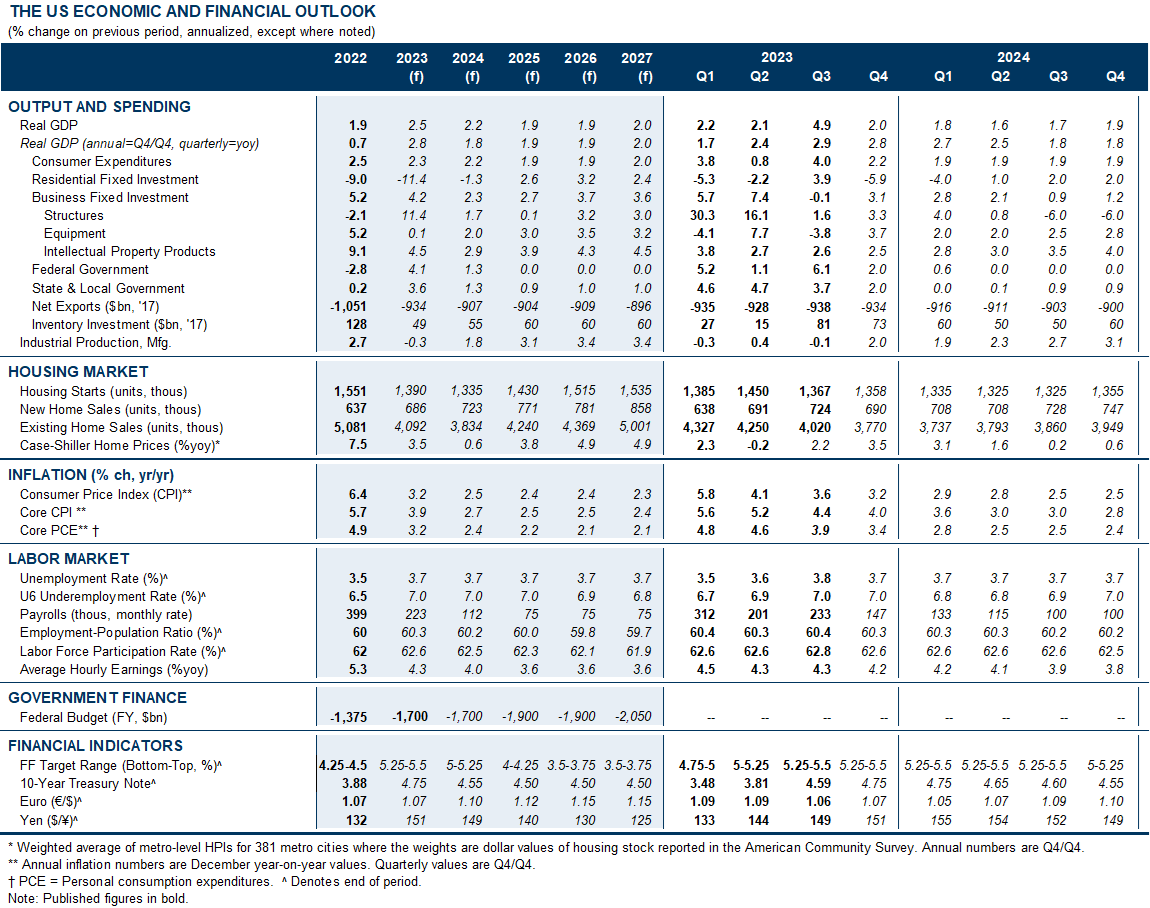
The US Economic and Financial Outlook
- 1 ^ Resulting from changes to the seasonal factors (as opposed to the underlying NSA series).
- 2 ^ For example, see Kristin Butcher, Lucas Cain, Camilo García-Jimeno, and Ryan Perry, “Immigration and the Labor Market in the Post-Pandemic Recovery,” Chicago Fed Working Paper, 2023 or Jonathan Rothbaum and Adam Bee, “Coronavirus Infects Surveys, Too: Survey Nonresponse Bias and the Coronavirus Pandemic,” Census Working Papers, 2021.
- 3 ^ We would note that a given decline in the response rate for JOLTS will have a larger impact on its estimated confidence interval than for the CES and NFP because of JOLTS’s relatively smaller sample size (the CES survey is 30-40x larger).
Investors should consider this report as only a single factor in making their investment decision. For Reg AC certification and other important disclosures, see the Disclosure Appendix, or go to www.gs.com/research/hedge.html.