The regional bank crisis this spring led to a further tightening in bank lending standards that threatened to amplify and prolong the tightening in market-based financial conditions kicked off by the Fed’s hiking cycle. At the time, we worried about risks to credit availability if banks faced unusually severe deposit flight in a cycle where the size and speed of rate hikes made the public more aware of the higher yields offered elsewhere and technology made it easier to move funds.
We are increasingly confident that the risk of a serious credit crunch has been avoided and the economy is through the worst of the credit tightening, for two reasons.
First, the stress on the banking system has not been as severe as feared. Bank-level data show that deposit outflows have remained modest across banks, that deposit betas are only somewhat higher than the historical average at this point in the hiking cycle, and that banks have been able to raise interest rates on loans enough to stabilize net interest margins at normal levels.
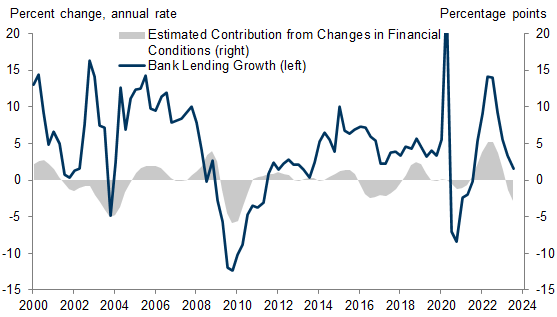
As a result, banks have not pulled back on lending to an unusual extent. The slowdown in bank lending growth from 8% last year to 2% this year has been only modestly larger than would normally be associated with the increase in interest rates since the Fed started hiking, despite the additional pressure from the regional bank stress, concern about regulatory tightening in response, and recession fears.
Second, nonbank lenders—which have come to play a larger role in US lending in recent decades—have reduced lending to businesses by only half as much as banks this year, softening the impact on total credit availability. This is partly because nonbank lenders are less sensitive to the recent pressures on bank lending—they face fewer regulatory constraints and their lending is less sensitive to interest rates because their business model is different, especially in the case of financing arms of companies that lend to clients who purchase their products.
In fact, we find that non-bank lenders tend to step up and provide more credit when banks pull back and have done so this year. Using data from Accutrend that summarize local records of business loans by bank and nonbank lenders, we find that nonbank lending increased the most in states where regional banks had provided a larger share of loans. The role of nonbank lenders helps to explain why companies, especially small businesses, have not reported a lack of access to credit in surveys even though banks reported a large tightening in lending standards.
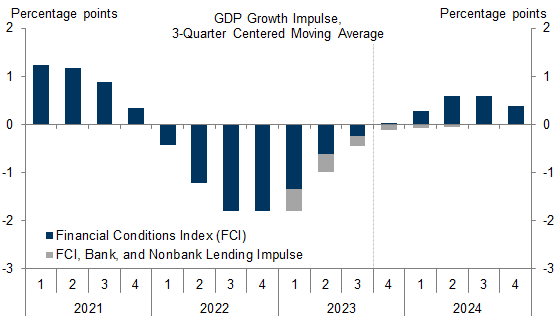
We expect credit availability to ease next year, supporting our above-consensus growth forecast. Falling interest rates should further reduce concerns about the unrealized losses on bank balance sheets that sparked the initial deposit flight, and we expect non-bank lenders to partly fill financing gaps that could emerge from tighter bank regulation. Using a version of our financial conditions index growth impulse model that also accounts for credit conditions, we estimate a turnaround from a 0.8pp drag on GDP growth in 2023 to a 0.4pp boost in 2024.
Credit Tightening: Through the Worst
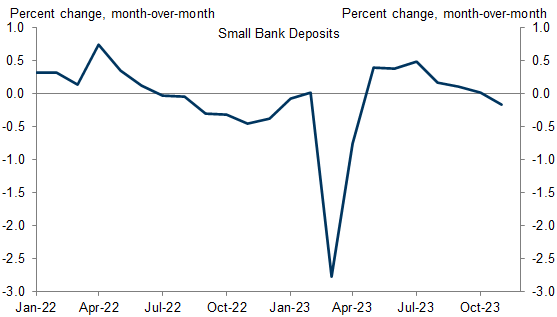
Exhibit 1: Rapid Deposit Outflows Earlier This Year Triggered Concerns Over the Banking System’s Ability to Provide Credit to the Economy
Banking turmoil: better than feared
Exhibit 2: Regional Bank Deposit Outflows Have Slowed Since the Bank Turmoil Subsided, Although Lending by These Banks Remains Depressed
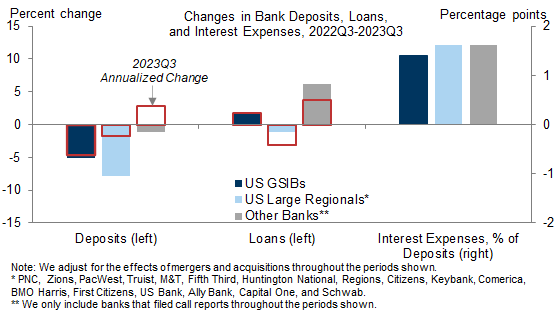
Exhibit 3: Deposit Betas Have Risen but Remain Within the Range of Historical Outcomes for Most Banks
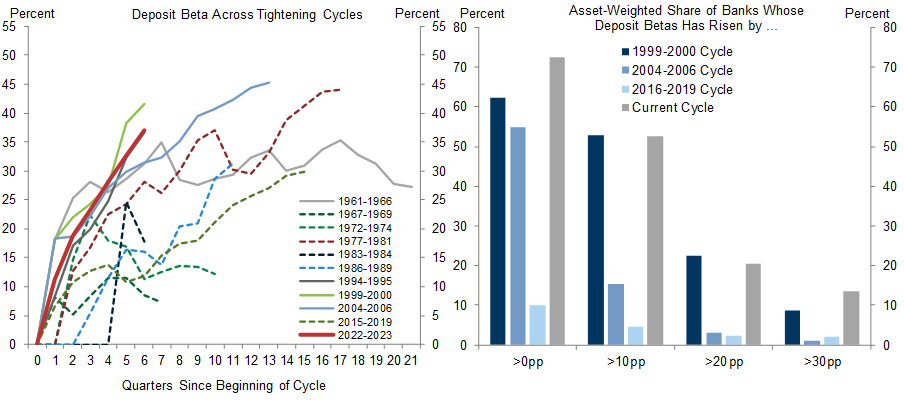
Exhibit 4: Bank Loan Rates Have Risen Alongside Deposit Rates, Keeping Net Interest Margins Around Their Pre-Pandemic Levels
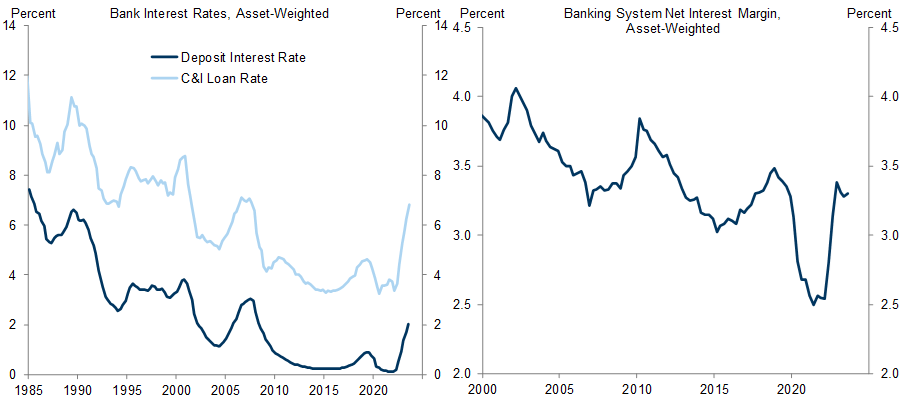
Exhibit 5: A Large Part of the Deceleration in Lending This Year Has Happened in Response to Tighter Financial Conditions
Nonbank lenders dampen the impact of tighter bank credit
Exhibit 6: New Nonbank Loans Have Declined by Half as Much as New Bank Loans Since the Hiking Cycle Began
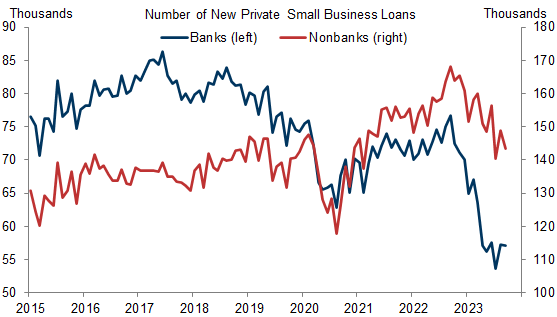
Exhibit 7: The Financial Arms of Large Corporates, Independent Finance Companies, and Fintech Are the Most Common Types of Nonbank Lenders
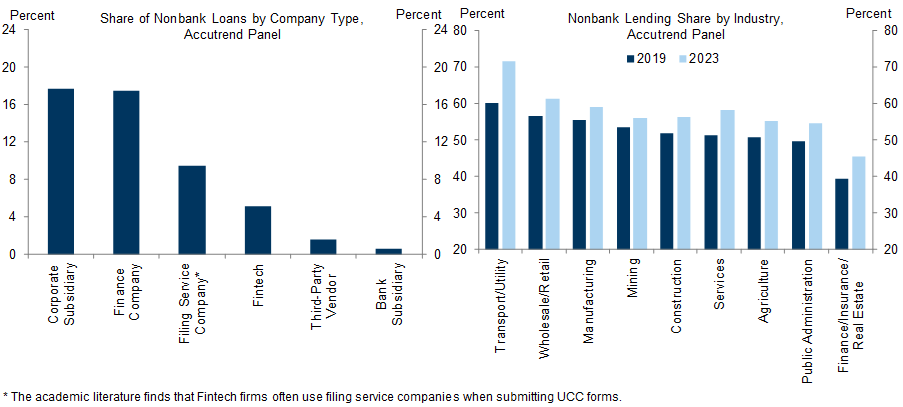
Exhibit 8: Nonbanks Have Been Able to Fill Some of the Financing Gap Left by the Regional Banks
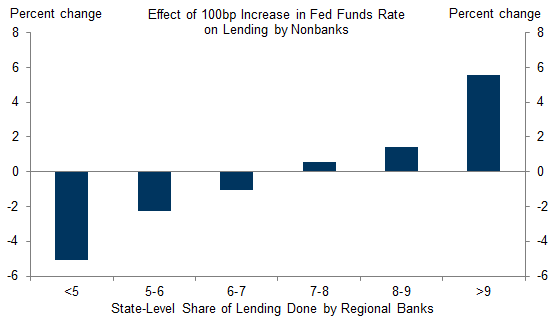
Exhibit 9: Nonbank Lenders Are More Specialized in Specific Industries Than Banks, Suggesting They May Have an Information Advantage That Makes Their Lending Less Sensitive to Changes in Interest Rates
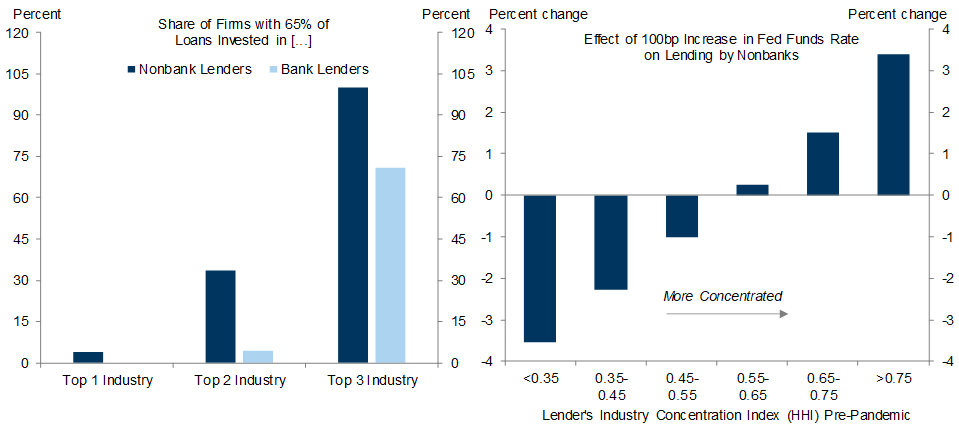
Exhibit 10: Nonbank Lenders Are More Likely to Lend to Somewhat Riskier Businesses Than Banks
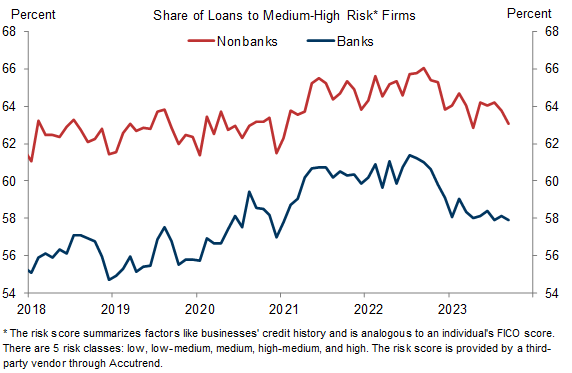
Exhibit 11: Academic Studies Find That an Increase in Bank Regulatory Requirements Increases Nonbank Lending Relative to Bank Lending
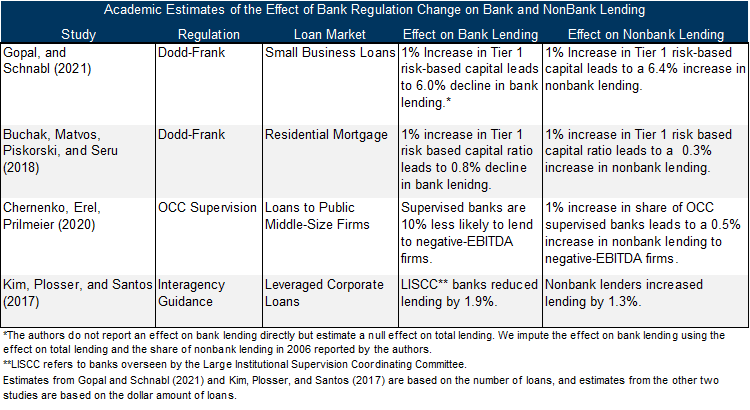
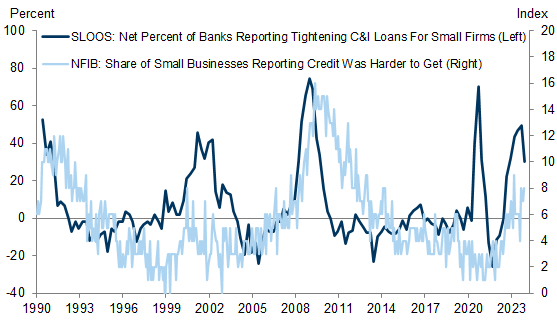
Exhibit 12: The Share of Small Businesses Reporting That Credit Is Harder to Get Is Low Compared to the Large Tightening in Bank Lending Standards, Suggesting That Nonbank Lending Has Filled Some of Gap
The growth drag from financial and credit conditions is set to fade in 2024
Exhibit 13: Our Combined Credit Impulse Suggests That Financial and Credit Conditions Are Likely to Turn From a 0.8pp Drag in 2023 to a 0.4pp Boost in 2024
Manuel Abecasis
Elsie Peng
David Mericle
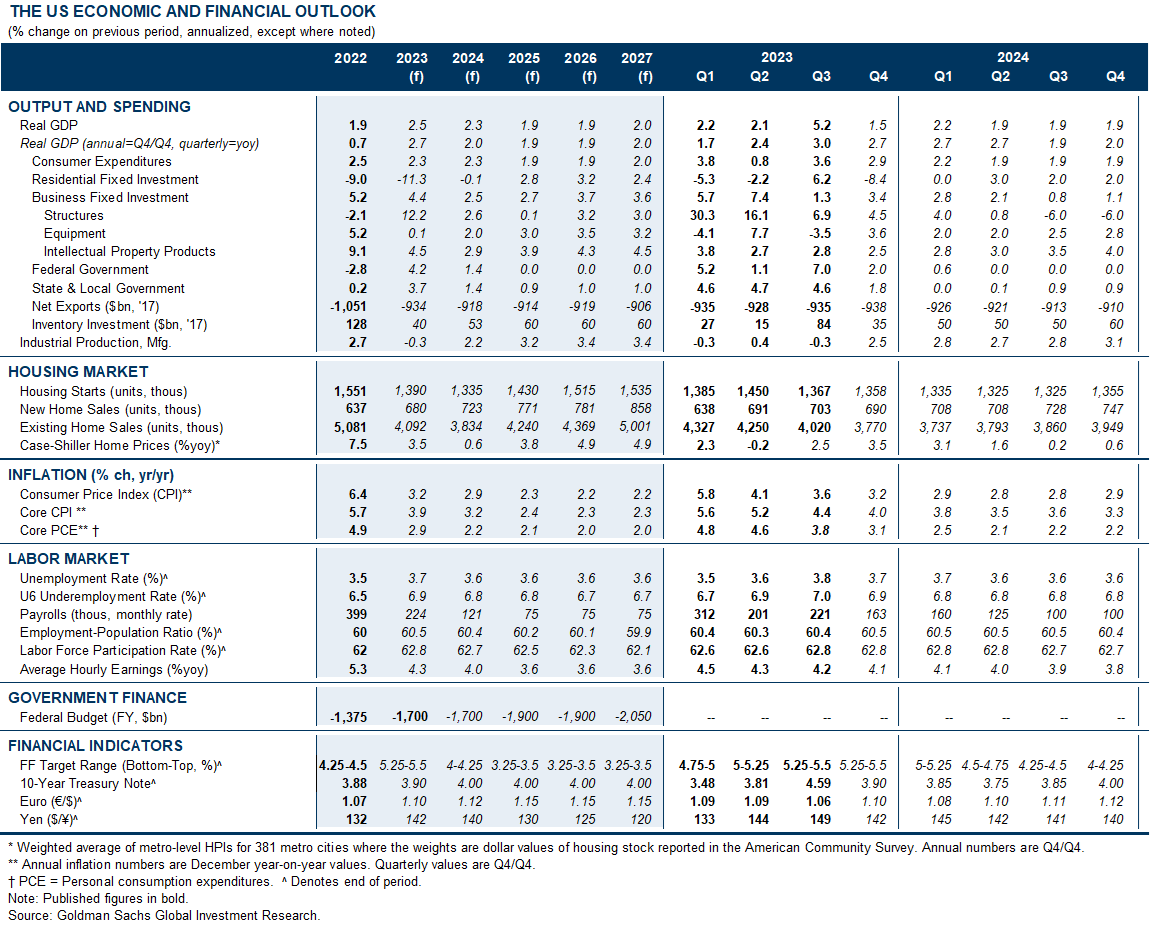
The US Economic and Financial Outlook
- 1 ^ Gopal, Manasa and Philipp Schnabl, 2022. “The Rise of Finance Companies and FinTech Lenders in Small Business Lending,” The Review of Financial Studies 35, 4859-4901.Buchak, Greg, Gregor Matvos, Tomasz Piskorski and Amit Seru, 2018. “Bank Balance Sheet Capacity and the Limits of Shadow Banks.”
- 2 ^ See Accutrend’s website here.
- 3 ^ We backcast nonbank lending before 2015, when the Accutrend data starts, using data on economywide loan growth from the Fed’s flow of funds accounts. We include data on the share of nonbank loans over time when estimating the vector autoregression model underlying our SLOOS-augmented FCI impulse.
Investors should consider this report as only a single factor in making their investment decision. For Reg AC certification and other important disclosures, see the Disclosure Appendix, or go to www.gs.com/research/hedge.html.