Goldman Sachs Research
US Economics Analyst
10 Questions for 2024 (Mericle / Phillips)
26 December 2023 | 11:35AM EST | Research | Economics| By Jan Hatzius and others
More
  • We wish all of our readers a happy, healthy, and prosperous 2024. In the last US Economics Analyst of the year, we discuss what we believe are the most important questions for 2024.

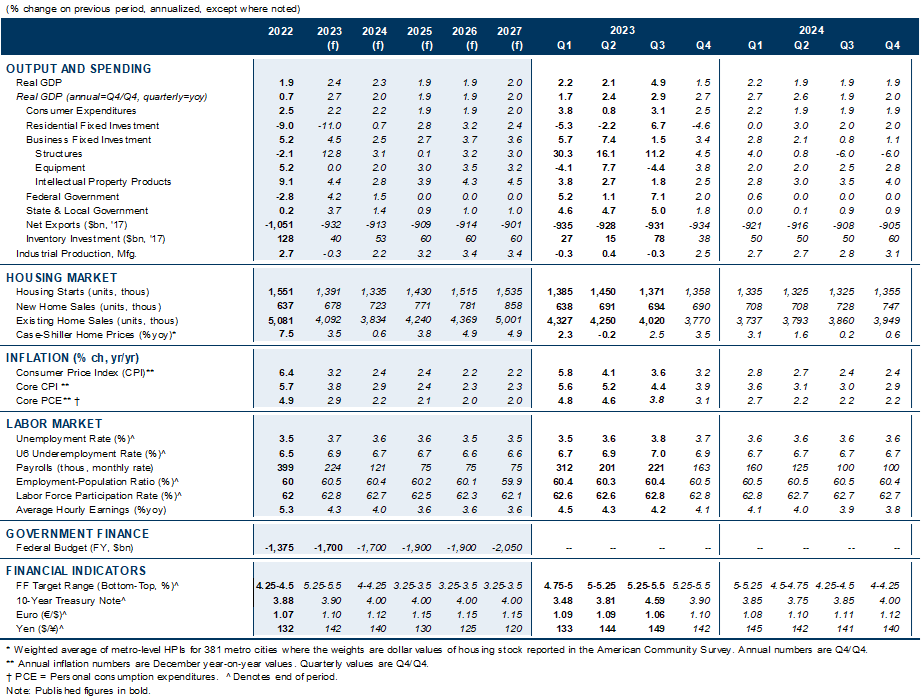
  • Our most out-of-consensus call for 2024 is our growth forecast. Our 2% forecast for 2024 Q4/Q4 GDP growth is well above consensus of 0.9% and the FOMC’s 1.4% forecast. This reflects our view that the growth impulses from changes in financial conditions and changes in fiscal policy should be modest and roughly neutral on net next year. It also reflects our forecast that consumer spending will easily beat expectations—we expect 2% growth vs. consensus of 1%—because real income should grow about 3% and household net worth is close to an all-time high.

  • Consistent with our growth view, we expect the labor market to remain strong. The healthy starting point of still-high job openings and a low layoff rate coupled with fading recession fears should support steady job gains in 2024 at a rate that gradually converges over the year to the current breakeven pace of about 100k. This should keep the unemployment rate low at around 3.6%.

  • Wage growth and inflation should fall to roughly target-compatible levels in 2024. The main drivers of high wage growth over the last two years—extreme labor market overheating and big inflation shocks that sparked demands for larger cost-of-living adjustments—are now behind us. As a result, wage growth should keep falling toward the 3.5% pace we estimate is compatible with 2% inflation. Core PCE inflation slowed sharply in 2023H2 and appears on track to fall into the low 2s on a year-on-year basis by spring. We expect further rebalancing in the auto and housing rental markets to leave the year-on-year rate at 2.2% at the end of 2024, undershooting the FOMC’s 2.4% forecast, and we see a reasonable chance that it could fall below 2%.

  • The rapid decline in inflation is likely to lead the FOMC to cut early and fast to reset the policy rate from a level that most participants will likely soon see as far offside. We expect three consecutive 25bp cuts in March, May, and June, followed by one cut per quarter until the funds rate reaches 3.25-3.5% in 2025Q3. Our forecast implies 5 cuts in 2024 and 3 more cuts in 2025. We also expect the Fed to slow balance sheet runoff in 2024Q4 and to end it fully in 2025Q1.

  • Fiscal policy is very unlikely to become more stimulative ahead of the election. In fact, we see downside risk to government spending from automatic spending cuts that will take effect in May if Congress continues to avoid government shutdowns by passing temporary extensions instead of full-year spending bills. The cuts would reduce funding by around 2% (0.4% of GDP).

10 Questions for 2024

For the last US Economics Analyst of 2023, we present our top 10 questions for the coming year.
1. Will GDP grow faster than consensus and the FOMC expect?
Yes. We expect the US economy to substantially outperform expectations again in 2024. Our 2% forecast for 2024 Q4/Q4 GDP growth is more than double the Bloomberg consensus forecast of 0.9% and solidly above the FOMC’s forecast of 1.4% as well (Exhibit 1). But it is not a particularly bullish forecast in an absolute sense because we estimate that the economy’s short-run potential growth rate is currently about 2%, boosted modestly by above-trend immigration that is driving faster labor force growth.

Exhibit 1: Our 2% Forecast for 2024 Q4/Q4 GDP Growth Is Well Above Consensus of 0.9% and the FOMC’s Forecast of 1.4%

1. Our 2% Forecast for 2024 Q4/Q4 GDP Growth Is Well Above Consensus of 0.9% and the FOMC’s Forecast of 1.4%. Data available on request.
Source: Goldman Sachs Global Investment Research, Bloomberg
A top-down explanation of why we expect GDP growth to be near potential next year is that the net effect of the impulses from changes in fiscal policy and changes in financial conditions is likely to be roughly neutral (Exhibit 2). This assessment is likely a key reason why we depart from consensus—many other forecasters still expect more lagged pain from higher interest rates than we do.

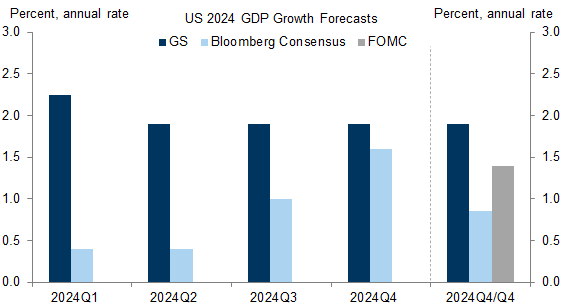
Exhibit 2: The Growth Hit from Fiscal and Monetary Policy Tightening Is Largely Behind Us, and the Net Impact of the Two on GDP Growth Should Be Roughly Neutral in 2024

2. The Growth Hit from Fiscal and Monetary Policy Tightening Is Largely Behind Us, and the Net Impact of the Two on GDP Growth Should Be Roughly Neutral in 2024. Data available on request.
Source: Goldman Sachs Global Investment Research
From a bottom-up perspective, we are more optimistic on growth next year for most components of GDP other than government spending (Exhibit 3). The most important disagreement is about consumer spending, discussed below, but we also expect business investment to benefit from reduced recession fears even as the incremental growth boost from semiconductor and green energy subsidies fades, and we expect residential investment to benefit from the recent decline in mortgage rates and the severe shortage of single-family housing, which has muted the impact of reduced affordability so far.

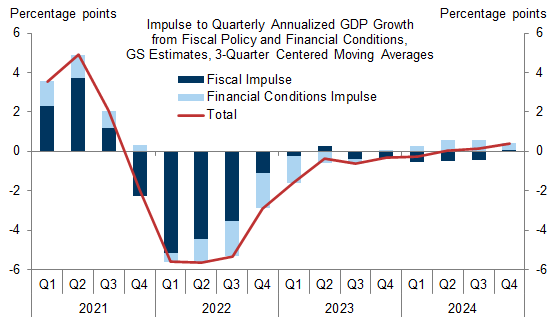
Exhibit 3: We Are More Optimistic Than Consensus on Consumption, Business and Residential Investment, and Trade

3. We Are More Optimistic Than Consensus on Consumption, Business and Residential Investment, and Trade. Data available on request.
Source: Goldman Sachs Global Investment Research, Bloomberg
2. Will consumer spending beat consensus expectations?
Yes. Our forecast for consumer spending in 2024 is essentially a watered-down version of the 2023 story. We expect real disposable income to grow robustly again, though likely closer to 3% next year rather than this year’s 4%+ (Exhibit 4). Most of this comes from labor income gains—largely reflecting mundane potential growth in an economy with a growing labor force and rising productivity that tends to lift real wages—that should translate roughly one-for-one to higher consumer spending. The still-high level of job openings (Exhibit 8 below) implies that continued strong hiring is the default path and that expecting a virtuous cycle of income and consumption growth is not just circular reasoning.
Interest income will also likely rise meaningfully next year but should have a more modest per-dollar impact on spending because it accrues mostly to upper-income households. In part for this reason, we expect the saving rate to rise about 1pp, meaning that roughly 3% income growth should translate to roughly 2% consumption growth, well above consensus expectations of 1% growth.

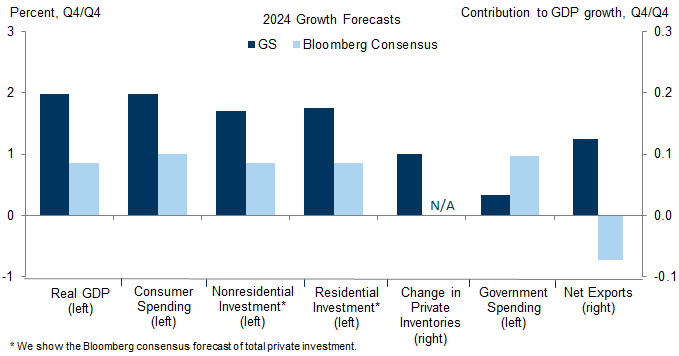
Exhibit 4: We Expect Positive Real Wage Gains, Solid Job Gains, and Higher Interest Income to Fuel Real Disposable Income Growth of Around 3% and Consumption Growth of Around 2% in 2024

4. We Expect Positive Real Wage Gains, Solid Job Gains, and Higher Interest Income to Fuel Real Disposable Income Growth of Around 3% and Consumption Growth of Around 2% in 2024. Data available on request.
Source: Goldman Sachs Global Investment Research
More pessimistic forecasters highlight potential risks from more aggressive mean reversion of the saving rate from its low current level or from the exhaustion of excess savings. These concerns worry us less.
The saving rate is low by historical standards at 4.1%, but it should be low because both precautionary and retirement motives for saving are currently weak. The layoff rate is historically low, and the ratio of household net worth to income is historically high. In that context, the low level of the saving rate is not that puzzling (Exhibit 5), though again our forecast does embed a modest increase next year.
Fears about the exhaustion of excess savings also look overblown. Pandemic savings likely provided key support for consumer spending in 2022, but because of two unusual circumstances that have not been true for a while—real income was falling, which meant that many families needed to tap their savings to sustain their real spending, and low-income households who usually do not have appreciable savings had some. Real income has instead risen in 2023 and the Fed’s Survey of Consumer Finances shows that the lowest-income families’ liquid financial assets had already fallen back to normal levels by the end of 2022. At this point, the remaining excess savings are a modest increment to the wealth of middle- and upper-income consumers that amount to about 1% of net worth and deserve less attention than they receive.

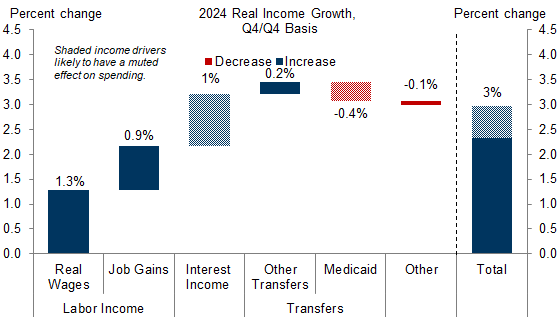
Exhibit 5: The Near-Record Level of Household Net Worth Should Continue to Support Spending and Implies That the Saving Rate Should Remain Low by Historical Standards

5. The Near-Record Level of Household Net Worth Should Continue to Support Spending and Implies That the Saving Rate Should Remain Low by Historical Standards. Data available on request.
Source: Goldman Sachs Global Investment Research, Federal Reserve Board, Department of Commerce
3. Will the gap between real goods and services consumption narrow back to the pre-pandemic trend?
No. Remote work appears likely to be the most persistent economic legacy of the pandemic. The share of US workers working from home at least part of the week has stabilized at around 20-25%, below its peak of 47% at the start of the pandemic but well above the pre-pandemic average of 2-3% (Exhibit 6).

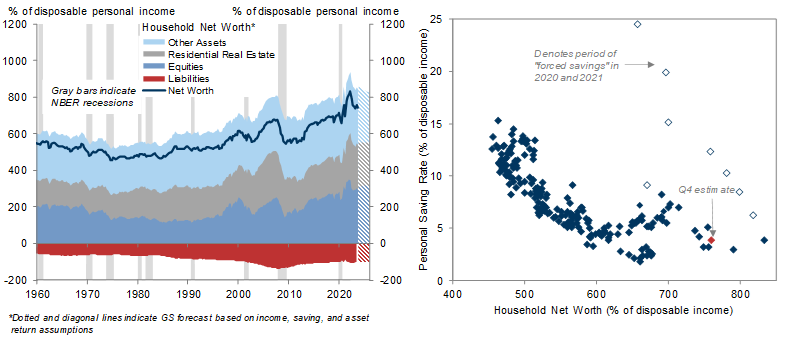
Exhibit 6: Remote Work Is Likely to Be the Most Enduring Economic Legacy of the Pandemic Years

6. Remote Work Is Likely to Be the Most Enduring Economic Legacy of the Pandemic Years. Data available on request.
Source: Goldman Sachs Global Investment Research, WFH Research, IPSOS, Department of Commerce
This shift to working from home is likely the key driver of the large gap between goods and services consumption that has persisted even as virus fears have diminished. Real goods consumption was already growing more quickly in the pre-pandemic years and is now about 7% above trend, while real services consumption is still about 1% below trend (Exhibit 7). Metro-level credit card data show that remote workers spend less on office-adjacent services such as transportation and more on home office and recreation goods. This suggests that much of the shift in consumption patterns is likely to last.

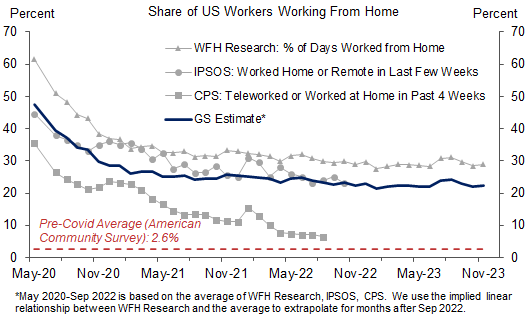
Exhibit 7: Remote Work Is Likely the Main Driver of the Large and Persistent Gap Between Real Goods Spending and Real Services Spending, Which Appears Likely to Last

7. Remote Work Is Likely the Main Driver of the Large and Persistent Gap Between Real Goods Spending and Real Services Spending, Which Appears Likely to Last. Data available on request.
Source: Goldman Sachs Global Investment Research, Department of Commerce
4. Will bank lending reaccelerate?
Yes. The regional bank stress this spring provided the biggest growth scare of the year. Banks have reported a significant tightening in lending standards, and bank lending growth has slowed from 8% last year to just 2% this year. Some analysts worry that banks will face further pain from losses on commercial real estate (CRE) lending that could lead to a credit crunch next year.
We are less concerned and instead see room for bank lending to pick up. Our bank and credit analysts emphasize that much of the risk from CRE has already been priced into public debt markets and that banks’ limited exposure to office real estate should be manageable. And reassuringly, the most severe risks from the spring have been avoided—deposit outflows have remained modest, deposit betas remain within the range seen in past cycles, and net interest margins have held up. Now that interest rates are falling, the fears about unrealized losses on bank balance sheets that drove the initial panic should diminish further. Coupled with a brighter economic outlook for 2024 than the recession fears that dominated 2023, this should cause bank lending to pick back up.
Nonbank lenders cut back on new loans to businesses by less than banks this year, softening the impact on total credit availability, and should also be emboldened to lend more as recession fears fade.
We estimate that the impact of changes in financial conditions and credit conditions on GDP growth will swing from a 0.8pp drag in 2023 to a 0.4pp boost in 2024 (Exhibit 8), supporting our above-consensus growth forecast.

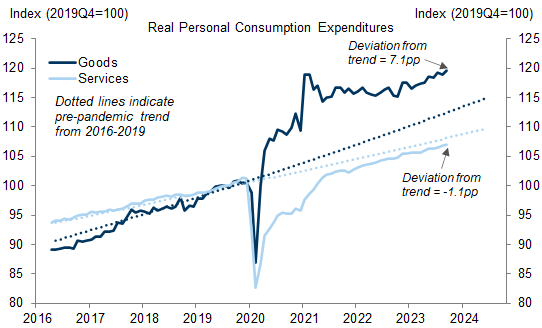
Exhibit 8: Financial and Credit Conditions Are Likely to Turn From a Drag on Growth in 2023 to a Boost in 2024, Supporting Our Above-Consensus Growth Forecast

8. Financial and Credit Conditions Are Likely to Turn From a Drag on Growth in 2023 to a Boost in 2024, Supporting Our Above-Consensus Growth Forecast. Data available on request.
Source: Goldman Sachs Global Investment Research
5. Will the unemployment rate remain below 4%?
Yes. After a brief scare this fall, the unemployment rate ticked down to 3.7% in November. We have downplayed the modest uptick since the spring because other labor market data remain very strong: job openings remain high in aggregate and across nearly every industry (Exhibit 8, left), and layoffs and initial jobless claims remain very low (Exhibit 8, right).

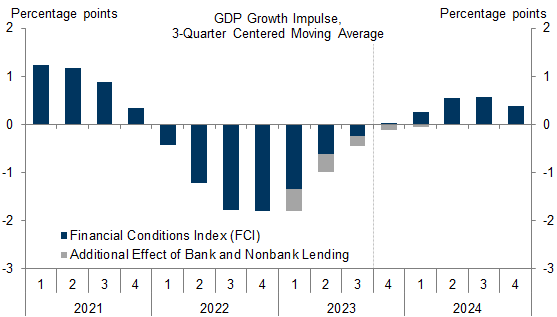
Exhibit 9: Job Openings Remain High and Layoffs Remain Low

9. Job Openings Remain High and Layoffs Remain Low. Data available on request.
Source: Goldman Sachs Global Investment Research, Department of Labor
This healthy starting point coupled with solid final demand growth and reduced recession fears should continue to support steady job gains in 2024 at a rate that only gradually converges later in the year to the breakeven pace, which we put at around 100k for now to incorporate an extra boost from elevated immigration. This should keep the unemployment rate fairly stable at around 3.6% (Exhibit 9).

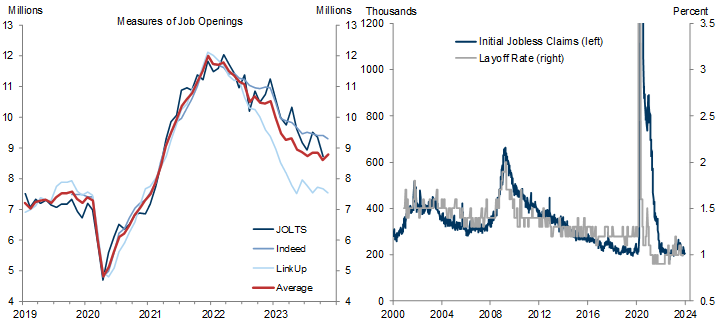
Exhibit 10: We Expect Job Gains to Gradually Slow to Roughly Their Breakeven Pace of About 100k per Month and the Unemployment Rate to Remain Stable at 3.6% in 2024

10. We Expect Job Gains to Gradually Slow to Roughly Their Breakeven Pace of About 100k per Month and the Unemployment Rate to Remain Stable at 3.6% in 2024. Data available on request.
Source: Goldman Sachs Global Investment Research, Department of Labor
6. Will wage growth fall below 4%?
Yes. The two main contributors to high wage growth over the last two years were a historically tight labor market in which our jobs-workers gap peaked at nearly 6 million, and large inflation shocks that raised near-term inflation expectations and sparked demands for much larger than usual cost-of-living adjustments. Both are now largely behind us. Measures of labor market tightness have returned to pre-pandemic levels, on average (Exhibit 10, left), and near-term inflation expectations have returned to levels that were consistent with 2% inflation in the years before the pandemic (Exhibit 10, right).

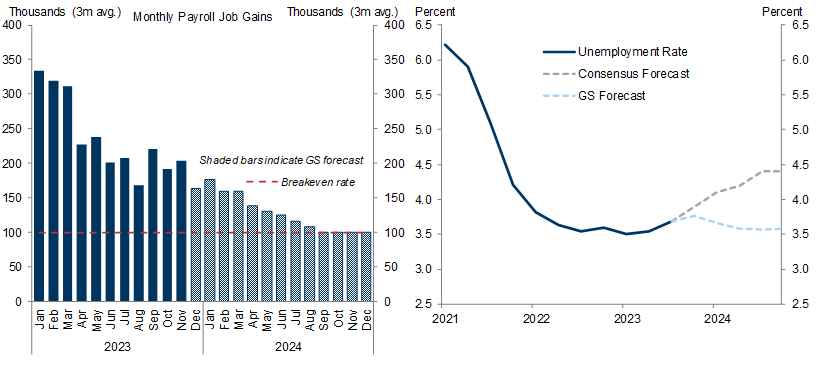
Exhibit 11: The Main Drivers of Strong Wage Growth, a Very Tight Labor Market and High Inflation Expectations, Have Now Normalized

11. The Main Drivers of Strong Wage Growth, a Very Tight Labor Market and High Inflation Expectations, Have Now Normalized. Data available on request.
Source: Goldman Sachs Global Investment Research, Department of Labor, NFIB, The Conference Board, University of Michigan, Federal Reserve Bank of New York
As a result, we expect wage growth to continue to fall with a bit of a lag. Our wage growth tracker has already slowed from a 5.5-6% peak pace to 4-4.5%, and business surveys that ask companies about their expectations for wage increases over the next year point to further deceleration to roughly the 3.5% rate that we estimate would be compatible with 2% inflation (Exhibit 11). Wage growth is the one piece of the broad inflation data set that is not yet quite where Fed officials would ideally like it to be before they start lowering interest rates. But it is close, and we suspect it remains elevated mainly because of the usual lags, which have been particularly visible in recent wage negotiations by union members, whose longer contracts have delayed the opportunity for some to win catch-up raises until this year.

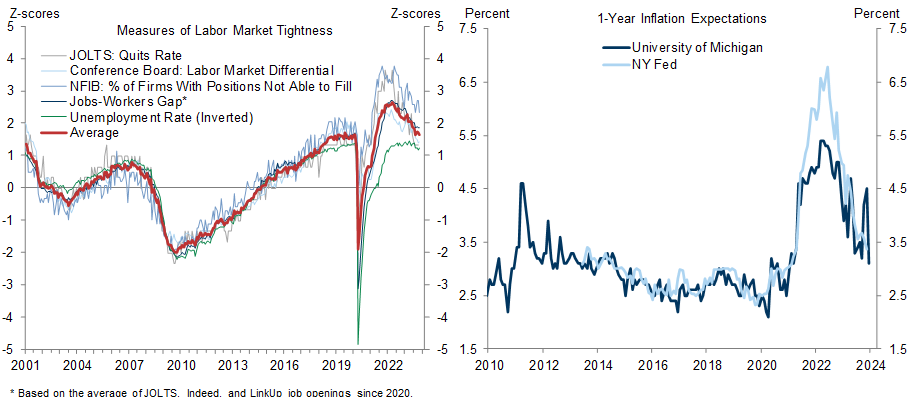
Exhibit 12: Wage Growth Has Slowed from 5.5-6% to 4-4.5%, and Business Surveys Point to Further Deceleration Next Year Toward the 3.5% Rate Compatible with 2% Inflation

12. Wage Growth Has Slowed from 5.5-6% to 4-4.5%, and Business Surveys Point to Further Deceleration Next Year Toward the 3.5% Rate Compatible with 2% Inflation. Data available on request.
Source: Goldman Sachs Global Investment Research, Department of Labor, Federal Reserve Bank of Atlanta, Indeed
7. Will core PCE inflation undershoot the FOMC’s forecast of 2.4% Q4/Q4?
Yes. Core PCE inflation has surprised to the downside recently and is on track for a striking slowdown from a 4% annualized pace in the first half of 2023 to a 2% pace in the second half. Our inflation forecast has fallen meaningfully as we have incorporated the good news (Exhibit 12). Similar patterns have also played out globally, which strengthens our conviction that the rapid decline in US inflation is not just brief good luck—the “last mile” of the inflation fight is turning out not to be so hard after all.

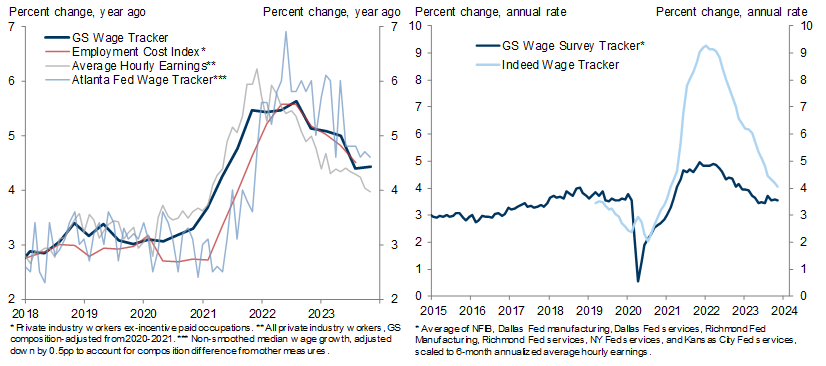
Exhibit 13: Core PCE Inflation Has Already Slowed Abruptly to a 2% Trend Pace and Now Appears Likely to Fall to the Low 2s on a Year-on-Year Basis Much Earlier Than We Previously Expected

13. Core PCE Inflation Has Already Slowed Abruptly to a 2% Trend Pace and Now Appears Likely to Fall to the Low 2s on a Year-on-Year Basis Much Earlier Than We Previously Expected. Data available on request.
Source: Goldman Sachs Global Investment Research, Department of Commerce
We are confident that year-on-year core PCE inflation will fall substantially next year from its current 3.2% rate because there is plenty of disinflation still in the pipeline from rebalancing in the labor, auto, and housing rental markets. With the auto strikes now over, inventory levels should continue to rebound quickly, which should further increase competition and reduce prices (Exhibit 13, left). We expect shelter inflation to remain firmer than some forecasters at 3.8% next year because while market rents have grown just 1-2% this year (Exhibit 13, right), we estimate that continuing-tenant rents still have to close a roughly 2% gap with market rates. But even this would be a big drop in a large category.

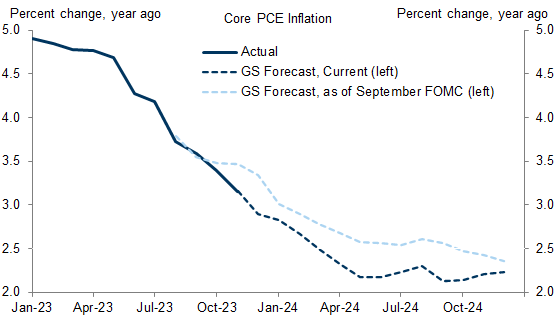
Exhibit 14: We Are Confident That Further Disinflation Is in the Pipeline as Auto Inventories Recover and the Official Shelter Inflation Data Gradually Catch Down to Leading Indicators of Market Rent Inflation

14. We Are Confident That Further Disinflation Is in the Pipeline as Auto Inventories Recover and the Official Shelter Inflation Data Gradually Catch Down to Leading Indicators of Market Rent Inflation. Data available on request.
Source: Goldman Sachs Global Investment Research, Department of Commerce, CoStar, Zillow, Yardi, Department of Labor
We expect core PCE inflation to fall 1pp from 3.2% to 2.2% by December 2024, reflecting a 1.1pp decline in core goods inflation to -1% and a 0.9pp decline in core services inflation to 3.4% (Exhibit 14).
But we also see a few downside risks that could push inflation below 2% next year. First, price levels for many goods that experienced shortages remain well above their pre-pandemic trends to a degree that cannot be explained by increases in production costs, signaling room for sharper declines next year. Second, labor-intensive consumer services inflation has surprised to the downside recently—partly reversing overshoots in 2021 and 2022—and could continue to. Third, we are assuming that healthcare inflation will rise next year as providers locked into multi-year contracts finally get the chance to raise prices enough to match recent cost increases, but this has not happened yet and might not next year either.

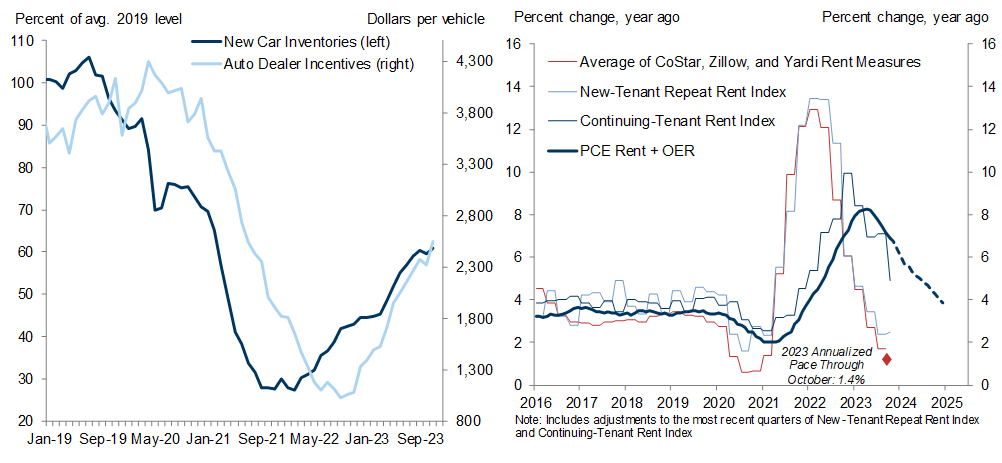
Exhibit 15: We Expect Further Deceleration Across Most Categories to Bring Core PCE Inflation Down to 2.2% Year-on-Year by December 2024 and We See a Meaningful Risk That It Falls Below 2%

15. We Expect Further Deceleration Across Most Categories to Bring Core PCE Inflation Down to 2.2% Year-on-Year by December 2024 and We See a Meaningful Risk That It Falls Below 2%. Data available on request.
Source: Goldman Sachs Global Investment Research, Department of Commerce
8. Will the Fed cut at least four times?
Yes. Because inflation is returning to target surprisingly quickly and by some measures is already trending near 2%, we expect the FOMC to cut early and fast to reset the policy rate from a level that most of the FOMC will likely soon see as far offside. We expect three consecutive 25bp cuts in March, May, and June, followed by one cut per quarter (or every other meeting) until the funds rate reaches a terminal rate of 3.25-3.5% in 2025Q3. Our forecast implies 5 cuts in 2024 and 3 more cuts in 2025.

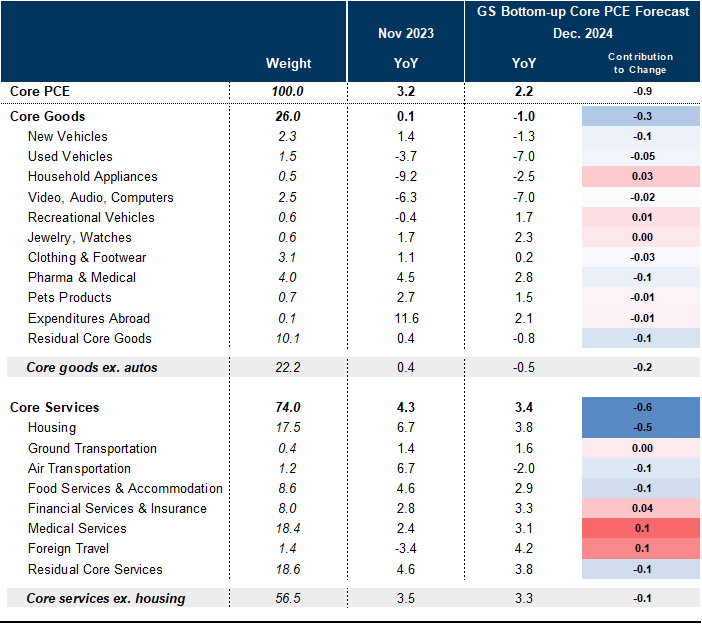
Exhibit 16: We Expect the FOMC to Deliver Three Consecutive Cuts in March, May, and June, Before Slowing to a Quarterly Pace in Q3 and Q4, for a Total of 5 Cuts in 2024

16. We Expect the FOMC to Deliver Three Consecutive Cuts in March, May, and June, Before Slowing to a Quarterly Pace in Q3 and Q4, for a Total of 5 Cuts in 2024. Data available on request.
Source: Goldman Sachs Global Investment Research, Federal Reserve
We are quite uncertain about the pace and extent of rate cuts, for three reasons.
First, small differences in inflation outcomes could have a large effect on policy decisions. For example, the FOMC might deliver a longer string of consecutive cuts if inflation falls below 2%.
Second, the pace will depend on how financial conditions respond. The bond market is already pricing more cuts than we expect next year, but we nonetheless see some risk that moving too fast could provoke too much enthusiasm in asset markets. If so, the FOMC might slow down.
Third, for the first time in a while, our perspective on the economic outlook and its implications for monetary policy is different in some important ways from the Fed leadership’s view. Our financial conditions index growth impulse model implies that the hit from higher rates is already behind us and that rate cuts are therefore optional next year, whereas Chair Powell said in December that the FOMC is “very focused” on the risk of staying too high for too long. We are also skeptical the neutral funds rate is as low as the FOMC thinks. But we are forecasting what the FOMC is likely to do, not what they “should” do, and its perspective on these issues implies that large cuts are more clearly urgent and appropriate than our analysis suggests.
9. Will the Fed stop balance sheet reduction by Q3?
No. The FOMC will aim to stop balance sheet normalization when bank reserves go from “abundant” to “ample”—that is, when changes in the supply of reserves have a real but modest effect on short-term interest rates. We recently summarized a variety of indicators that can serve as warning signs that this point is approaching, and they still suggest that the end of runoff is a way off.
We expect the FOMC to start considering changes to the speed of runoff in 2024Q3, to slow the pace in 2024Q4, and to stop runoff in 2025Q1. At that point, we expect bank reserves to be around 12-13% of bank assets and the Fed’s balance sheet to be around 22% of GDP, versus 18% in 2019, a peak of almost 36%, and 28% currently. The main risk is that the increased supply of debt that we expect in 2024 could cause intermediation bottlenecks in the Treasury market that could lead the Fed to stop runoff earlier.

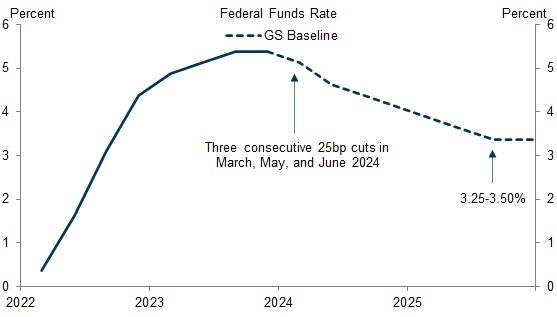
Exhibit 17: We Expect the FOMC to Slow the Pace of Balance Sheet Runoff in 2024Q4 and Stop Runoff in 2025Q1

17. We Expect the FOMC to Slow the Pace of Balance Sheet Runoff in 2024Q4 and Stop Runoff in 2025Q1. Data available on request.
Source: Goldman Sachs Global Investment Research, Federal Reserve
10. Will fiscal policy become more stimulative ahead of the election?
No. While fiscal policy has become somewhat more expansionary in presidential election years, on average, we do not expect this to be the case in 2024. This pattern is driven in part by the fiscal response to major downturns in some recent election years (e.g. 2008 and 2020) and we do not expect any substantial fiscal policy measures to be enacted in 2024.

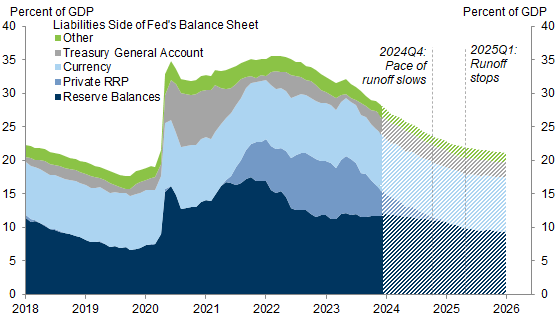
Exhibit 18: Fiscal Policy Has Become Somewhat More Expansionary in Presidential Election Years, on Average

18. Fiscal Policy Has Become Somewhat More Expansionary in Presidential Election Years, on Average. Data available on request.
Source: Goldman Sachs Global Investment Research, Congressional Budget Office
Instead, we see some downside risk to government spending from automatic spending cuts that will take effect in May if Congress continues to avoid government shutdowns by passing temporary extensions instead of full-year spending bills. This is a serious risk because there is still a $120bn gap between House Republicans and the Senate on proposed spending levels.
If the automatic cuts do take effect, they would cause a 1% cut to “discretionary” funding (0.2% of GDP) and, within that lower total, a reallocation of $33bn from defense to non-defense. Since this cut would be implemented in May 2024, it would be concentrated in the second half of the fiscal year, resulting in a step-down in funding of around 2% (0.4% of GDP).

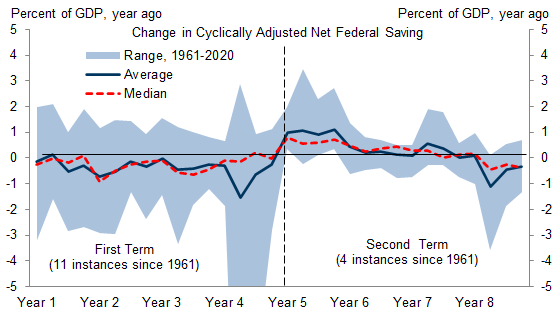
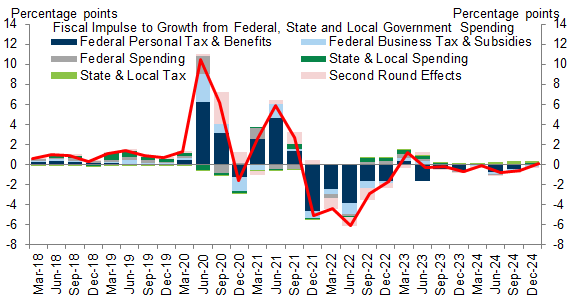
Exhibit 19: We Do Not Expect Any Major New Fiscal Policy Changes Next Year, Though We See Some Downside Risk from Potential Automatic Spending Cuts If Congress Cannot Pass Full-Year Spending Bills

19. We Do Not Expect Any Major New Fiscal Policy Changes Next Year, Though We See Some Downside Risk from Potential Automatic Spending Cuts If Congress Cannot Pass Full-Year Spending Bills. Data available on request.
Source: Goldman Sachs Global Investment Research

David Mericle

Alec Phillips

The US Economic and Financial Outlook

Data available on request.
Source: Goldman Sachs Global Investment Research

Investors should consider this report as only a single factor in making their investment decision. For Reg AC certification and other important disclosures, see the Disclosure Appendix, or go to www.gs.com/research/hedge.html.