In our final Analyst of the year, we review the economic data surprises of 2023, our ability to forecast them, and lessons learned along the way.
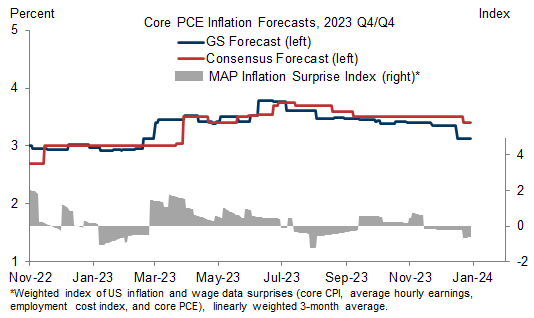
GDP surprised to the upside in 2023, validating our out-of-consensus view that the US economy would avoid recession. While instability in the banking system led us to lower our GDP growth forecast in March, bank deposits subsequently stabilized, the credit drag proved manageable, and activity data continued to surprise to the upside on net. A second key macro theme of 2023 was the progress on disinflation that occurred despite strong growth and auto supply issues related to China’s covid wave. Our 2023 inflation forecast led consensus higher during the spring auto supply disruptions, then led it lower in the back half of the year as services-led disinflation took hold.
In terms of economic indicators, our forecast hit rates averaged 68% directionally correct vs. consensus across top-tier indicators—up from 62% in 2022—with particularly strong performance for the GDP report (100%, 3 out of 3), core PCE (91%), core CPI (82%), average hourly earnings (75%), and the employment cost index (67%). Additionally, our 67% hit rate for the unemployment rate benefitted from our team’s soft landing call. We underperformed consensus for 2 of these 13 indicators: Philly Fed (42%) and ADP (44%). On the latter, ADP’s negative correlation with nonfarm payrolls suggests that forecasts of ADP should perhaps orient around predicting the noise as opposed to the signal.
Our hit rate for nonfarm payrolls was 55%. Our forecasts generally benefitted from Big Data indicating low layoffs and continued job growth, however we were whipsawed by seasonal labor supply constraints in May and June.
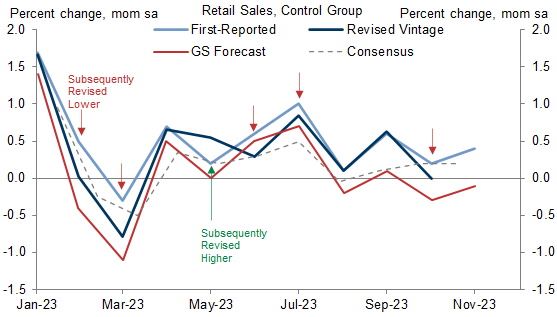
Retail sales was a second indicator for which performance was solid but nonetheless lagged prior years (57% in 2023 vs. 92% in 2022). Reviewing our track record, we find that our forecasts were more predictive of the eventual revised values and that the initial vintages suffered from an upward bias worth -0.15pp on average. These sizeable and fairly consistent downward revisions underscore the importance of monitoring alternative measures of economic activity as a crosscheck on the official data.
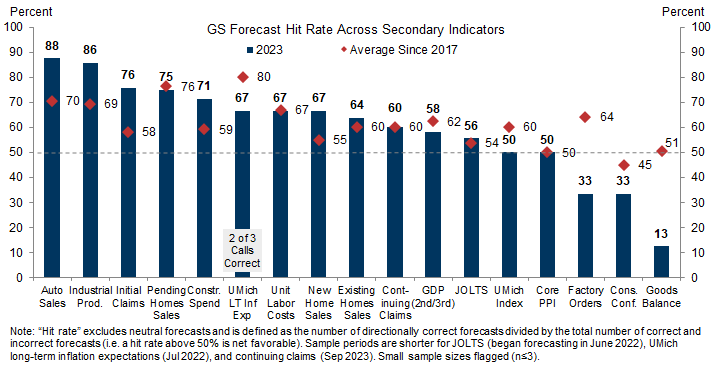
Our 2023 hit rate averaged 60% across second-tier indicators, with particularly strong performance for Auto sales (88%), industrial production (86%), and jobless claims (76% initial, 60% continuing), the latter benefitting from our views on residual seasonality and our soft landing call. Our key underperformer was foreign trade (13%), where we were wrong-footed repeatedly by excessive optimism around China’s reopening and the related rebound in global trade.
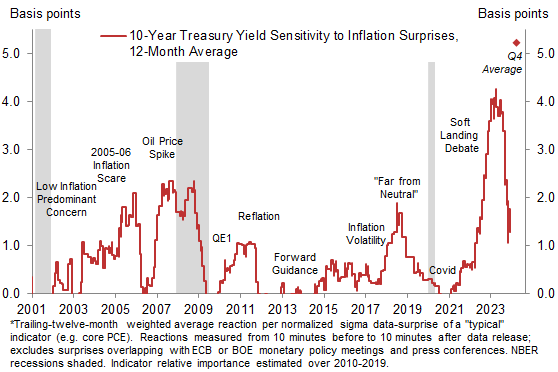
Markets reacted strongly to data surprises in 2023, in particular to inflation surprises, for which sensitivity was 3.5x normal for stocks and 3.0x normal for bonds (10 minutes before and after the report, GS estimates). Treasury market sensitivity to growth data was also elevated—we estimate at 40% above normal—reflecting the intensity of the “recession vs. soft landing” debate and the Fed’s data-dependent policy. We also find that the equity market has re-embraced the “bad is good” narrative, with stocks once again rallying in response to weak growth data.
Nowcasting the Soft Landing: A Look Back at Our 2023 Forecasts
Exhibit 1: Growth Exceeded Even Our Optimistic Expectations in 2023
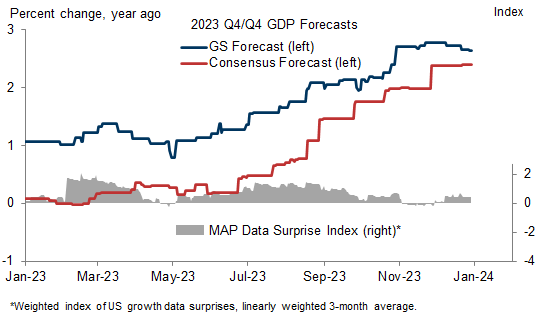
Exhibit 2: GS Quarterly GDP Tracking, Versus Consensus and Atlanta Fed GDPNow
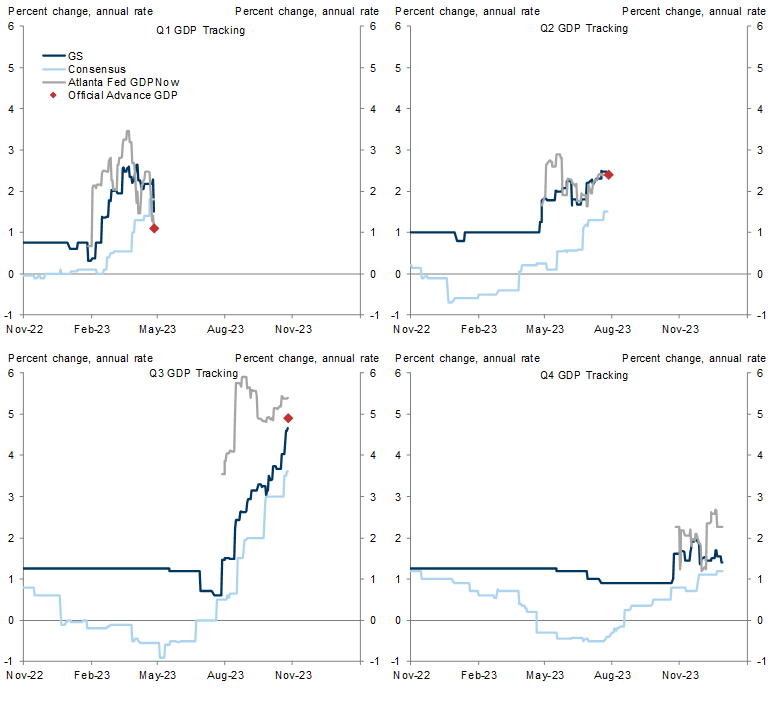
Exhibit 3: Inflation Surprised to the Downside in H2 After Upside Surprises Earlier in the Year
Indicator Forecast Performance
Exhibit 4: What Worked in 2023? GS Forecast Accuracy for Key Market-Moving Indicators
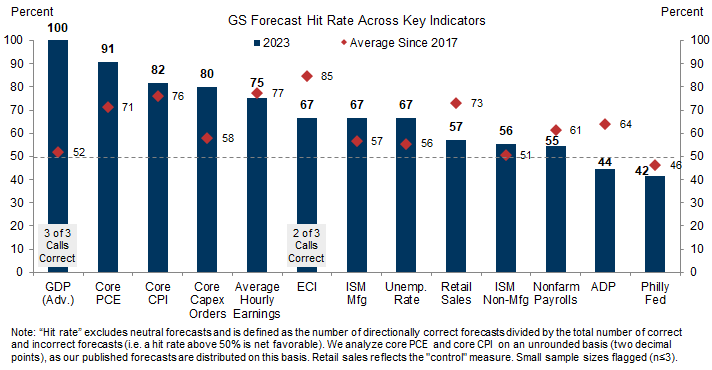
Exhibit 5: Retail Sales Data Were Consistently Revised Lower In 2023
Forecast Accuracy Across Second-Tier Data
Exhibit 6: Second-Tier Indicator Forecast Accuracy
Market Reactions to Economic Data
Exhibit 7: Treasury Yields Remain Highly Sensitive to US Growth Data, Even in Q4
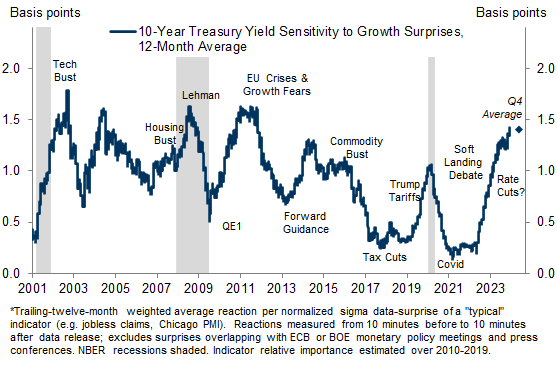
Exhibit 8: “Bad News Is Good News” in the Stock Market
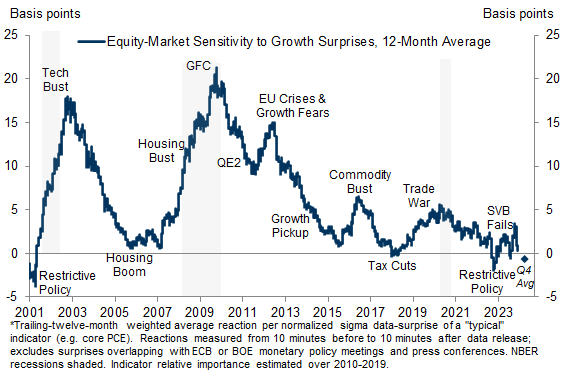
Exhibit 9: Rates Remain Sensitive to Inflation Data Even As Overheating and Recession Concerns Have Diminished
Spencer Hill
Manuel Abecasis
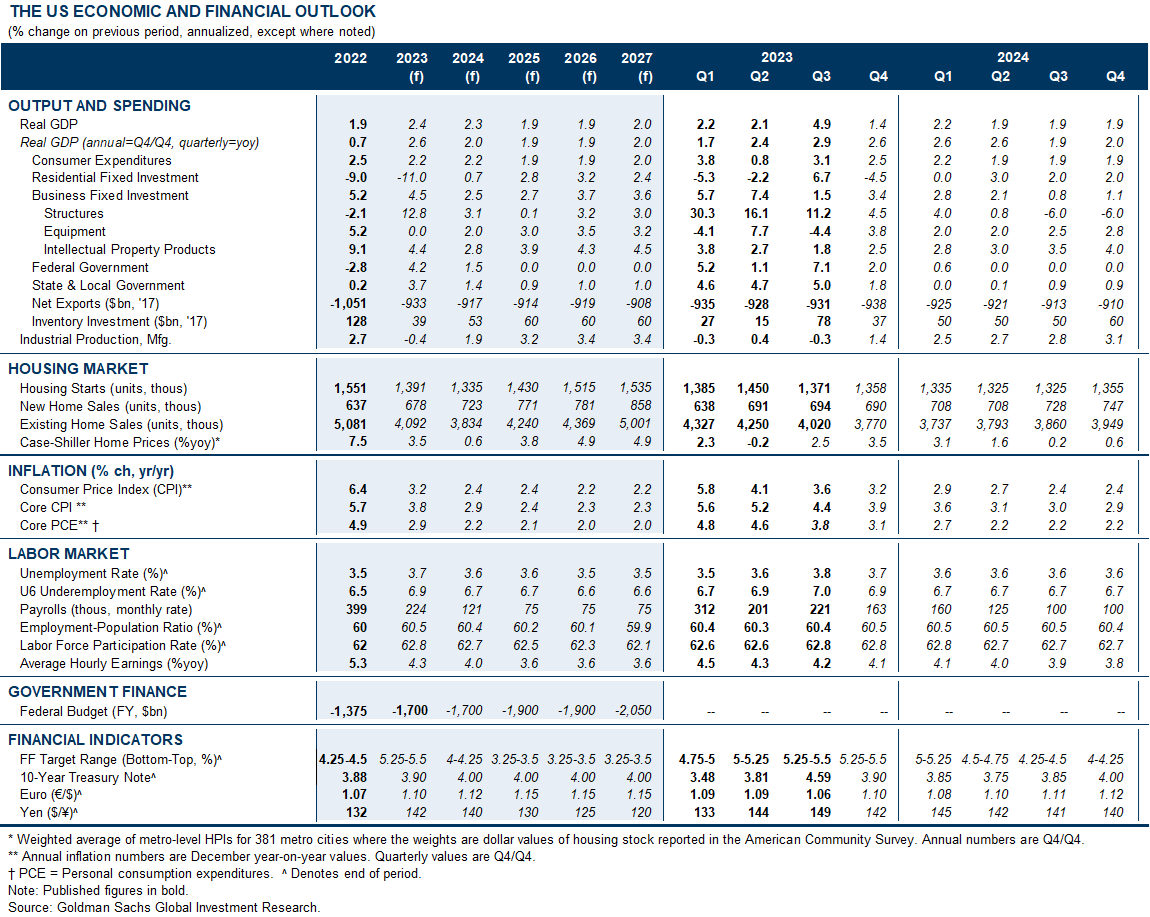
The US Economic and Financial Outlook
- 1 ^ Nonbank lenders also filled some of the financing gap left by banks, further dampening the growth drag from tighter bank lending standards.
- 2 ^ GDP was particularly strong in Q3, at +4.9% annualized. The Atlanta Fed’s GDPNow tool was correctly well above both our and consensus expectations for most of that quarter, and as in Q1, the volatile inventories component explained all of the difference between our forecast and the official print (and most of the difference in our forecast relative to GDPNow). For Q4, we currently estimate GDP rose +1.4% annualized, above consensus of +1.2% currently and well above its projected decline as of late-summer. With a Q4 government shutdown averted and a limited impact on auto production from the autoworkers strike, the growth headwinds we assumed now appear milder.
- 3 ^ In the first half of the year, we raised our core inflation forecast several times as progress on core goods prices and shelter inflation proved slower than we expected. But since then, core services prices have decelerated by more than we anticipated, driven in part by the continued rebalancing of the labor market. As a result, we now expect core PCE inflation to end the year at +3.1% in Q4 and 2.9% in December, roughly in line with our forecasts as of one year ago.
- 4 ^ Excluding exactly-in-line readings and based on first-reported actuals on the Bloomberg ECO screen. We ignore observations that are exactly in line. In other words, the hit rate is the number of directionally-correct forecasts divided by the number of correct and incorrect forecasts. This construction also allows the interpretation of >50% hit rates as “net favorable” and <50% hit rates as “net unfavorable.”
- 5 ^ Because we forecast monthly core CPI and PCE on an unrounded basis (e.g. 0.23%), comparing our forecast to rounded median consensus (e.g. 0.2% or 0.3%) is not a perfect benchmark. When evaluated on a rounded basis—a smaller sample—our core CPI hit rate rises from 82% to 100% (2 out of 2 correct calls) and our core PCE hit rate rises from 91% to 100% (4 out of 4 correct calls).
- 6 ^ Control measure (ex-auto, gas, building materials, mom sa).
- 7 ^ Our hit rate would rise 10pp to 67% if evaluated using revised data, even if November remains an incorrect forecast on this basis.
- 8 ^ More generally, this serves as a reminder that contemporaneous seasonal adjustment tends to absorb some of the data surprise, which in turn argues for attenuating our forecasts of the initial vintages (particularly when the forecasting models themselves are estimated on revised data).
- 9 ^ “We’re getting now back to the point where both mandates are important—they’re more in balance.”--Chairman Powell, December FOMC press conference.
- 10 ^ The limited number of inflation releases limits the reliability of these parameter estimates over shorter windows, as they can be influenced by outliers such as the outsized -11bp reaction to the -0.07pp surprise in the October core CPI (+0.23% mom sa vs. consensus of +0.3%). Accordingly, we believe inflation sensitivity in the Treasury market is currently somewhere in between, perhaps around 3bps per standardized inflation surprise).
- 11 ^ A key example is the euphoric reaction to the October CPI report on November 14, which generated a 1.0% rally in S&P 500 futures in the 10 minutes around the release.
Investors should consider this report as only a single factor in making their investment decision. For Reg AC certification and other important disclosures, see the Disclosure Appendix, or go to www.gs.com/research/hedge.html.