Goldman Sachs Research
Global Markets Analyst
Shorter WAM Optimal for Gilts
Table of Contents
28 February 2024 | 12:41PM GMT | Research | Economics| By George Cole and others
More
  • The maturity of UK debt is the highest in the G10, but has been falling in recent years. With the UK Debt Management Office aiming to minimize the interest expense paid on debt, but also to lower the volatility of interest expense, we build an optimal issuance model to help explain this reduction in WAM.

  • Our results show that, overall, the 3-10y maturities offer the best trade-off between low cost and acceptable volatility. In addition, our model shows the DMO should skew towards longer maturities when long-term rates are low and shorter maturities when rates are high and the curve is inverted, as observed in recent years.

  • This suggests to us that the DMO will continue to skew issuance towards shorter maturities more than in the past – a point reinforced by the lower domestic demand for duration in the UK curve. This points to ongoing pressure on Gilts vs swaps in the belly of the UK curve.

Shorter WAM Optimal for Gilts

The UK sovereign debt market has one of the longest average maturities globally (Exhibit 1). Since the pandemic, though, the weighted average maturity (WAM) of the outstanding stock of Gilts has been declining as the DMO skews issuance away from longer maturities (Exhibit 2). This is partly due to the use of shorter-maturity instruments during 2020 when issuance needs increased dramatically. Part of it is also likely due to a shift in investor behaviour, particularly given the reduction in leveraged LDI strategies that increased duration demand in the previous decade. However, as we argue below, the fall in WAM is consistent with the current high interest rate environment, given the objectives of the UK Debt Management Office (DMO), the agency of the UK Treasury responsible for debt issuance.

Exhibit 1: The UK has a significantly higher WAM than peers

Weighted average maturity of G10 government bonds
1. The UK has a significantly higher WAM than peers. Data available on request.
Source: Bloomberg, Goldman Sachs Global Investment Research

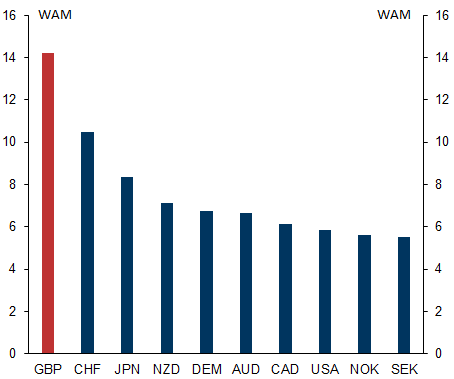
Exhibit 2: UK issuance has recently skewed to shorter maturities

Share of conventional Gilt issuance in 3-7y, 7-20y, and 20y+ maturities
2. UK issuance has recently skewed to shorter maturities. Data available on request.
Source: Goldman Sachs Global Investment Research, Bloomberg
The optimal issuance problem: funding costs vs volatility
The UK DMO seeks to "minimise financing costs over the long term, taking into account risk, and to minimise the cost of offsetting the Government's net cash flows over time". This encapsulates the general challenge for DMOs more broadly, which want to balance low funding costs, to free up resources for primary expenditure, and low funding volatility and risk, which helps medium-term budgetary planning. These objectives generally result in a trade-off between cost and volatility. This is because short-term rates are typically lower than long-end rates – as yield curves are usually (although not always) upward sloping – and thus offer more attractive funding costs. However, front-end rates are also (generally) more volatile, implying large swings in the interest expense if the DMO were to solely rely on short-term funding. Longer-maturity instruments fluctuate by less, and the volatility curve is typically (but, again, not always) downward-sloping (Exhibit 3).

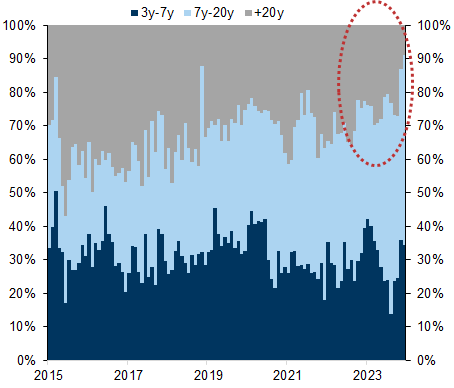
Exhibit 3: While the yield curve is usually upward-sloping, the volatility curve is downward-sloping

Gilt yields, 1999-today.
3. While the yield curve is usually upward-sloping, the volatility curve is downward-sloping. Data available on request.
Source: Bloomberg, Goldman Sachs Global Investment Research

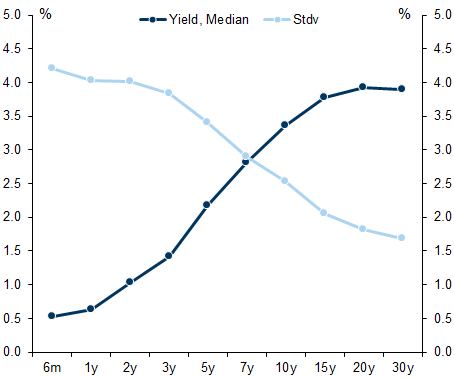
Exhibit 4: Current account deficits associated with higher WAM, but UK an outlier

Current account balance, % of GDP vs Weighted average maturity of debt stock outstanding
4. Current account deficits associated with higher WAM, but UK an outlier. Data available on request.
Source: Goldman Sachs Global Investment Research
To mitigate rollover risk, DMOs, including in the UK, generally want to avoid single years with abnormally large potential redemptions. This risk grows with the debt stock, as the rollover needs at any point are larger, and so may make longer-maturity bonds more desirable for sovereign issuers. This suggests that economies with higher debt levels should rely on longer-maturity instruments if market conditions allow, despite their higher costs presuming an upward-sloping yield curve. This was true following the Euro area sovereign debt crisis, where rollover risk was a driver of credit spreads, and helps explain the rise in WAM when low yields permitted following ECB interventions from 2012 onwards. The relationship between funding needs (proxied by debt levels and the current account deficit) and WAM generally holds across DM economies; however, here the UK remains an outlier with much longer-maturity debt than peers (Exhibit 4). This points to particular duration needs in the UK economy, a point to which we will return. But the general relationship points to higher WAMs when rates are low, which is clearly the case for the UK (Exhibit 5).
There are, of course, other considerations for debt issuance agencies such as the UK DMO. For example, the function of sovereign debt as risk-free benchmarks in the economy means that Gilts earn a liquidity premium if their supply is sizeable, stable, and predictable. A well-populated yield curve with a minimum supply at any given point is therefore desirable for a sovereign issuer, even if this temporarily implies slightly higher funding costs at a particular point on the curve. And other objectives, for example, inflation stabilisation and inflation-linked issuance, or facilitation of retail participation in the sovereign bond market, also motivate the UK DMO. A high share of inflation-linked debt was the main reason why the UK, despite a high WAM on its debt, did experience a substantial rise in funding costs in recent years as inflation increased (Exhibit 6). However, for the following exercise, we analyse the optimal maturity of debt, and leave these other motivations for future research.

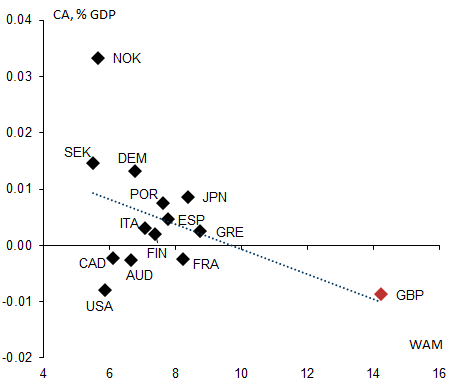
Exhibit 5: WAM has an inverse relationship to yields

WAM, debt outstanding vs 10y Gilt yields, inverted
5. WAM has an inverse relationship to yields. Data available on request.
Source: Debt Management Office, Goldman Sachs Global Investment Research

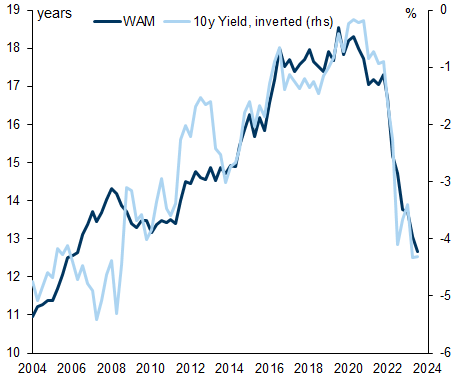
Exhibit 6: Inflation-linked debt drove up UK interest costs despite high WAM

Interest costs as a share of GDP
6. Inflation-linked debt drove up UK interest costs despite high WAM. Data available on request.
Source: Goldman Sachs Global Investment Research
Modelling optimal issuance
To understand how a DMO could approach the optimal issuance problem, we built a model based on one developed and used by the US TBAC committee. The model determines the optimal issuance mix across maturities, by attempting to minimize both interest expense and volatility – the primary objectives of the DMO. To form expectations about future rate paths and volatility, our model simulates a macroeconomy that is modelled on the UK and includes business cycle fluctuations that help us benchmark optimal issuance over time.
Further detail on the model is included in the Appendix but, as a brief description, the macroeconomy in our model is subject to macroeconomic stochastic shocks that cause deviation from its potential growth rate, resulting in a time-varying output gap. From that, we find the unemployment gap, inflation, and, via a stylized Taylor rule framework, the policy rate. We endogenize term premia and find market rates as the sum of the average expected Bank Rate until maturity, the term premium and a stochastic shock term. Financing needs in the economy arise due to the rollover need from maturing bonds, the interest expense and the primary deficit, which is a function of the unemployment rate gap.
At each point in the simulation, we forecast the economy 20 years ahead, and find the optimal issuance, assuming no further shocks to the system. This simulates a rational debt agency making forecasts to the best of their ability at each step. We then optimally choose the issuance strategy for the current period across maturity buckets by minimizing the interest expense. Volatility is penalized through a penalty function that constrains changes in issuance across maturities from the optimal issuance of the one time step to another if those changes in the issuance buckets cause deviations from a simulated median funding cost over future time periods.[1]
3-10y issuance offers best mix of low cost and low volatility
To illustrate the results of our model, and the tension between the funding cost and volatility minimization objectives, we show the optimal issuance path for different maturities when the objective is solely to reduce funding costs, and then when the volatility constraint is also imposed (Exhibit 8 and Exhibit 7). The optimal results – with both constraints imposed – suggest that the share of long-end issuance should be held broadly stable over time, no matter the level of rates and state of the economy. Instead, front-end rates should be used to buffer different financing needs at different stages of the business cycle. We find that the optimal WAM is low, around 5 years (this is well below the current WAM, although comes from a stylized model that is not directly comparable to actual issuance).[2] That is because the higher interest cost of longer-maturity bonds outweighs the benefit of lower volatility.

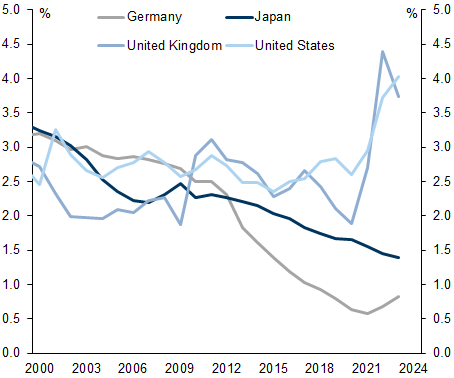
Exhibit 7: When the volatility penalty is low, issuance abruptly skews to short maturities

Optimization in simulated economy with small vol penalization
7. When the volatility penalty is low, issuance abruptly skews to short maturities. Data available on request.
Source: Goldman Sachs Global Investment Research

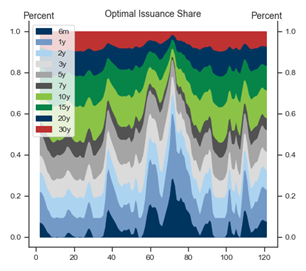
Exhibit 8: With a larger volatility penalty, issuance is more stable across maturities

Optimization in simulated economy with large vol penalization.
8. With a larger volatility penalty, issuance is more stable across maturities. Data available on request.
Source: Goldman Sachs Global Investment Research
During "normal" times, with an upward-sloping yield curve, the model suggests that a strong skew to the belly is optimal. Instead, when the yield curve is inverted or low and flat, the model suggests skewing issuance away from the belly (Exhibit 9) – if the level of rates is high, the skew should be towards the front end, so as not to lock in high rates for longer, and to the long end when the level of rates is below historic averages and the curve is flat, in order to benefit from the low interest rates for longer. The initial reaction to shocks that result in abrupt changes in yields, however, are mostly buffered through the front end, before the framework has time to rebalance itself and optimize. We see this behaviour by DMOs around the world: that is, when unexpected financing needs arise, issuance initially relies heavily on the front end, before being "termed out". This is due not just to lower rates at the front end but because of the absorption capacity and liquidity of short-maturity instruments such as bills.
Our results are consistent with the findings of the TBAC model and, although our model is calibrated to the UK economy, they are generally applicable to other DMOs as well. These results contrast somewhat with the DMO's own findings, which suggest that issuance strategies skewed towards the long end have the best cost-risk trade-off. Their analysis, however, does not rely on a macro model that drives a yield curve, but is contingent on a downward-sloping yield curve. In contrast, our model allows for the dynamic evolution of the yield curve through time, which in turn allows for a forward-looking issuance strategy. Most importantly, our results are consistent with recent behaviour of the UK DMO, where WAM increased during the period of low and flat curves following the GFC, and then has been falling recently as rates increased and curves inverted.
More Gilts in the belly
Our model suggests that it is optimal for the UK DMO to continue to skew issuance short given the elevated levels of long-term rates – even if an inverted curve points to higher funding costs at very short maturities. Note that our model suggests this without resorting to arguments about duration demand. When we consider the shifting investor base for Gilts, it is likely that duration demand will be structurally lower following the reduction of leverage in LDI strategies. This reinforces our findings that the DMO should optimally skew towards a lower WAM at issuance – and as a result we expect limited changes to issuance buckets at the next DMO remit following next week's Spring Budget statement. The current remit intends around 37% of issuance in 3-7y, 29% in 7-20y, 22% in 20y+ and 12% in inflation-linked bonds. Of course, should we see more appetite for UK duration emerge, this can keep the issuance across longer maturities high. But we see upside risks to belly issuance, and as a result we expect the cheapening of Gilts across the curve, but especially in the 2y, 5y and 10y sector, to continue (Exhibit 10). Reinforcing this is the potential for a further skew in BoE quantitative tightening away from the long end towards shorter maturities.
There may be other reasons to keep issuance maturity high. Credit ratings agencies, for example, have pointed out that the UK's long debt maturity insulates it against rollover risk. In addition, as mentioned above, this analysis tells us nothing about the optimal share of inflation-linked issuance, as our sole focus here is maturity, not instrument type – we plan to address optimal linker share in future research. But on the question of optimal WAM, we expect issuance WAM for Gilts will remain lower than in previous years.

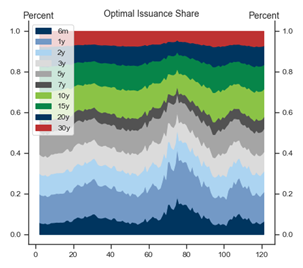
Exhibit 9: Optimal issuance points to lower WAM despite high front-end rates

Model snapshot of simulated yield curves
9. Optimal issuance points to lower WAM despite high front-end rates. Data available on request.
Source: Goldman Sachs Global Investment Research

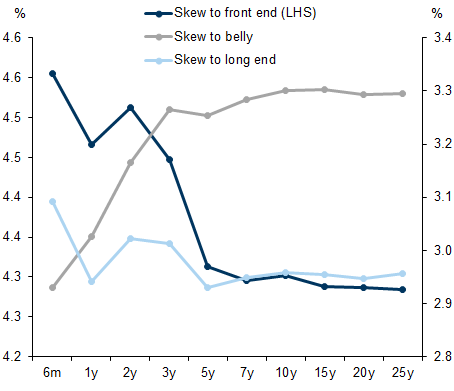
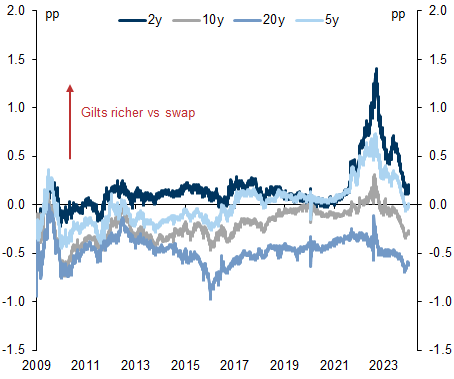
Exhibit 10: Swap spread tightening to continue at 2y, 5y and 10y

OIS - CMT Gilt yields
10. Swap spread tightening to continue at 2y, 5y and 10y. Data available on request.
Source: Goldman Sachs Global Investment Research
George Cole and Friedrich Schaper*
*Friedrich is an intern on the Global Markets team.

Appendix

  • The model is based on a model developed by members of the TBAC committee, which has featured in multiple TBAC presentations. It consists of a macro model that simulates the economy, a rates model that, given the state of the economy, derives the yield curve, and a debt dynamics block, which keeps track of all instruments outstanding, to facilitate the rollover of maturing instruments.

  • The macro model is estimated using our economists' estimates for the unemployment gap, potential growth and a stylized Taylor rule. Potential growth evolves stochastically, driving the neutral rate r* and real growth. From this, we derive the unemployment gap and inflation – we use CPI rather than RPI – and Bank Rate.

  • At each step of the simulation, we roll our estimates 20y forward, to get an expected policy rate path. For the rates model, we build the yield curve by using the average expected Bank Rate until maturity, plus the term premium for each maturity. We endogenize the 2- and 10-year term premium as a function of inflation and the unemployment gap – in a "booming economy" the term premia will cause the yield curve to be upward-sloping, whereas a recessionary state causes the yield curve to invert. All other term premia are non-linearly interpolated by fitting a polynomial.

  • Using the yield curve, we optimally choose the issuance, fulfilling the financing needs that arise due to the interest expense, the refinancing need of maturing debt, and the primary surplus, which is a function of the unemployment gap. At each step, bonds are issued at each bucket, keeping track of each issuance to note the future refinancing needs and the WAM of outstanding debt.

  • The optimization relies on a parameter reduction: instead of choosing freely the total issuance per bucket, we define four "kernels", vectors that define the issuance across the buckets. The first kernel is a vector of percentages across the buckets, which thus sums to one and reflects a reasonable historic distribution among the buckets. Each of the other kernels sums to zero and reflects a skew towards the front, belly, or long end, respectively. We attach weights to these kernels, which are the free parameters to be chosen, except for the base-weight, which equals the financing need in that period. This guarantees that the full financing condition is met and that issuance equals the deficit, as the base kernel comprises shares that sum to one, while the remaining kernels represent the 'tilt' towards short, medium or long maturities and sum to zero.

  • At each step of the simulation, we simultaneously estimate the macro model, the rates and the fiscal block. Taking the financing need and the yield curve, we optimally choose the weights on the three kernels, imposing the full financing condition. A penalty function on volatility penalizes deviations in current period interest expense from a 20y-forward looking median interest expense path. This penalty, which can be set arbitrarily, not only reduces the volatility in interest expense, but also ensures a smooth issuance profile from period to period, and guarantees a minimum issuance at each period at each bucket.

  1. 1 ^ In practice, liquidity considerations are important - when issuance needs increase suddenly, it is common to see substantial increases in short-maturity issuance, including Bills. This may often coincide with low front-end rates.
  2. 2 ^ This is not directly comparable given our model does not consider bond maturities beyond 30 years. As a result, we just highlight the indicative message here that the model skews shorter than observed behaviour, rather than a literal comparison.

Investors should consider this report as only a single factor in making their investment decision. For Reg AC certification and other important disclosures, see the Disclosure Appendix, or go to www.gs.com/research/hedge.html.