The perceived pace of economic growth is critical for financial markets. Changes in expected GDP growth have historically been the most important driver of equity prices, exchange rates, and forward interest rates over 1-2 quarters.
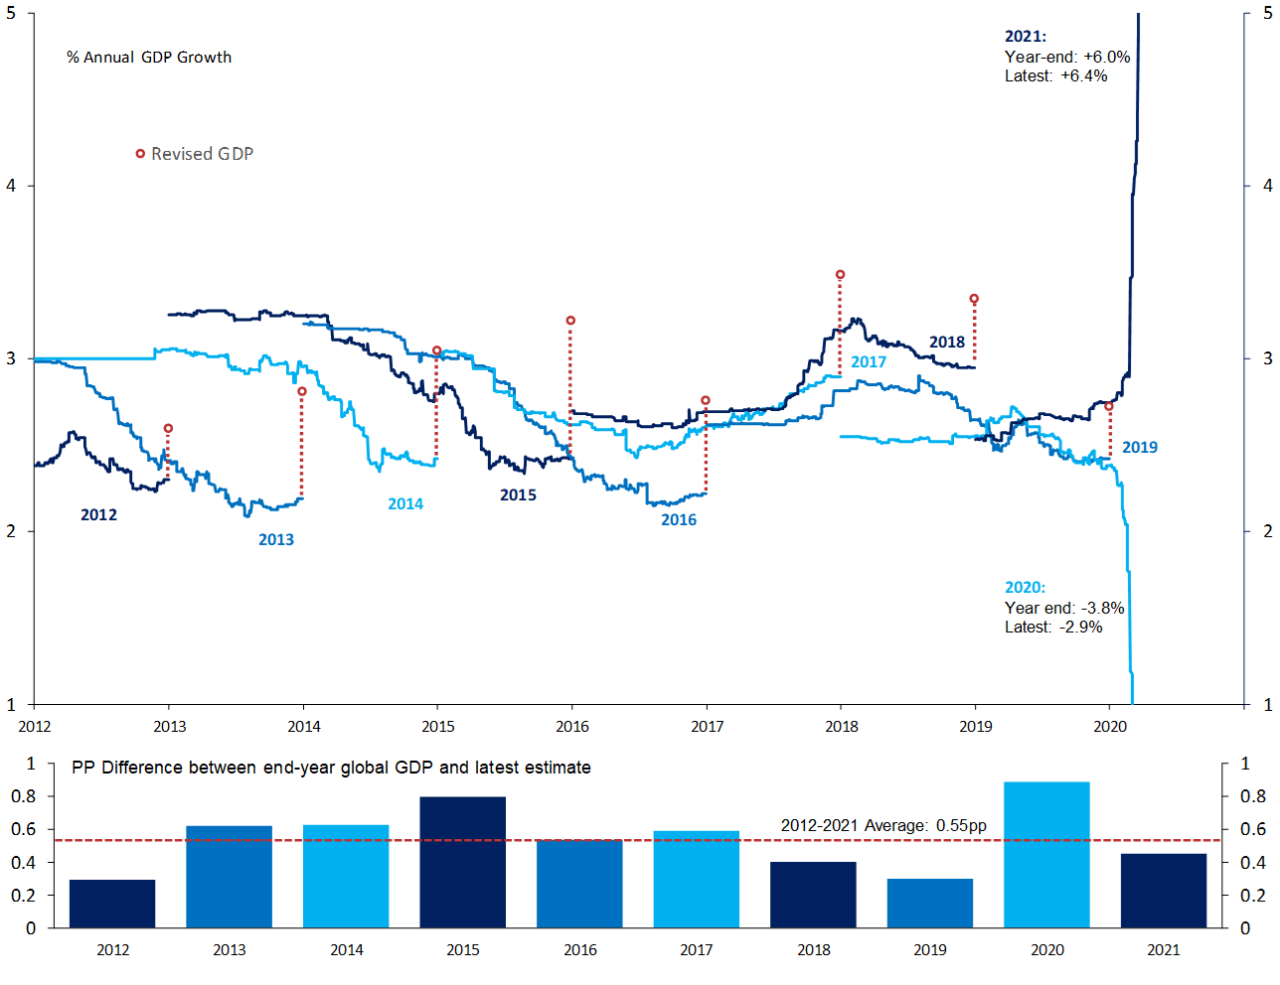
But what happens to GDP growth after the year has ended and the market’s focus has moved on? Quite a lot, actually. Over the past 10 years, we find that revisions to estimated global GDP growth after the year has ended have been broadly comparable in size to the within-year forecast changes that play a dominant role in driving asset prices. Initial estimates of GDP growth are also biased downwards – over the past 10 years, global GDP growth has been revised upwards for every single year, by an average of +0.5 percentage points.
We provide a detailed analysis of GDP revisions for each of the major economies. We find that the downward bias to early GDP estimates is a common feature of all major economies. Over the past 10 years, the average revision to initial quarterly GDP releases has been +0.4pp annualised for the US, +0.5pp for the Euro area, +1.0pp for the UK, +0.2pp for China, and +0.3pp for Japan. Revisions tend to be cyclical – so the bias is smaller when growth is weak – and the largest revisions typically take place more than six months after the first estimate is released.
There are various reasons why revisions are biased and occur long after the initial release. First, measurement techniques are constantly playing catch-up with technology-driven changes in output. Second, statistical agencies appear inherently conservative in their initial assumptions about GDP (even in the absence of methodological changes, the regular processes of benchmarking and re-balancing GDP estimates mostly result in upward revisions to growth).
The fact that GDP growth is routinely revised higher, long after the period has ended, has the effect of making the latest growth performance appear poor by comparison. We currently estimate that the global economy grew by +2.7%yoy in 2023, making it an average year for global growth. However, if the historical pattern of GDP revisions persists, that growth rate is likely to be revised to +3.2%yoy over time, making 2023 an unusually strong year for the world. Last year was pretty good – we just don’t know it yet.
Getting Better All the Time — The Ex Post Story of GDP Growth
Lies, Damned Lies, and GDP Data
GDP revisions tend to be large. The average change in estimated global GDP after the year has ended is comparable in size to the within-year forecast changes that financial markets obsessively monitor.
Early GDP estimates are biased downwards and revised significantly higher over time. This downward bias is a common feature across all major economies, but the largest upward revisions have historically been observed in the UK and Euro area.
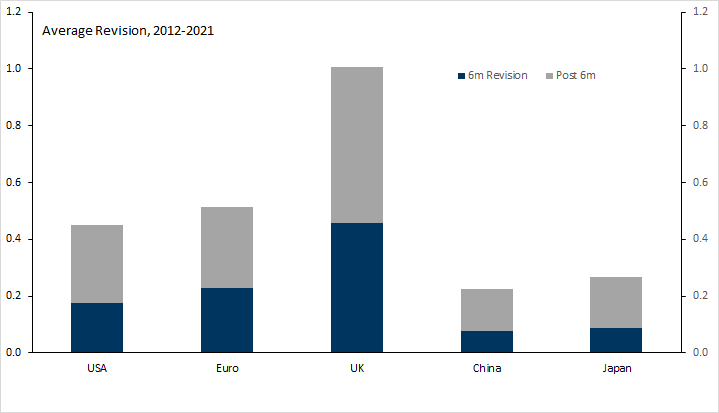
The largest revisions to GDP typically take place more than 6 months after the initial release (i.e., long after the market’s attention has moved on).
Revisions to GDP are cyclical: for most economies, revisions tend to be more strongly positive when GDP growth is strong.
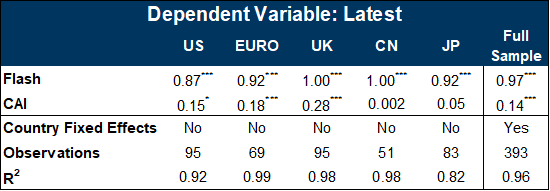
Broader activity indicators – such as our Current Activity Indicators (CAIs) – provide useful additional, real-time information on the ‘true’ strength of economic growth.
Historical Revisionism — Ex Post Changes to Global GDP Growth
Exhibit 1: Global Estimates of GDP Tend to Be Revised Upwards
GDP Tends to be Revised Higher in All Major Economies
Exhibit 2: Early GDP Estimates Have Tended to Underestimate Growth in All Major Economies
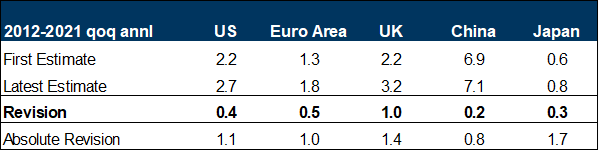
Exhibit 3: The Largest Revisions to GDP Typically Occur More than 6 Months After the Initial Estimate
Accounting for GDP Revisions
Changes in methodology to reflect new types of output. Technological progress results in changes in the type of output produced in an economy and it can take time for statisticians’ measurement techniques to catch up. This issue is a habitual problem in the measurement of tech-related output.[6] The inclusion of new types of output results in changes to past data and these changes almost always result in GDP for recent years being revised higher. It is reasonable to expect that these types of revisions will continue: much as it took statistical agencies several years to catch up with past technologies, there are technologies we are using today that will be incorporated in future estimates of GDP.
New information from tax returns/annual surveys. Some of the most accurate information on GDP comes from annual tax returns and annual business surveys. This information is often not available for a couple of years after the year in which it applies (company tax returns can be submitted 1-2 years after the year to which they apply). This information can result in substantial changes to estimated output for the whole year, with corresponding adjustments being made to the quarterly path.
Re-balancing output, expenditure, and income estimates. The output, income and expenditure of an economy are equivalent, by definition, but the estimates of GDP derived through each of these three routes can differ because of measurement error. How one reconciles these measures differs from country to country but, in many countries, early GDP estimates are based entirely on one measure that the statistical agency considers to be most accurate (and discrepancies with other measures are often incorporated in inventories). Significant revisions can then arise when the three measures of GDP are fully reconciled with each other.
Revisions Are Cyclical and Can Be Predicted by Broader Activity Indicators
Exhibit 4: GDP Revisions Tend to Be Cyclical
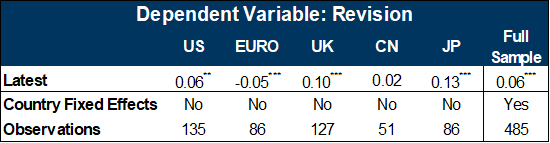
Exhibit 5: The CAIs Contain Statistically Significant Additional Information About 'True' GDP Growth
A World of Perpetual Disappointment
A Review of Past Revision Episodes
UK (October 2011): Real GDP growth raised cumulatively by 3pp over the previous 10 years. The revisions to the level of GDP reflected a combination of methodological changes (to the GDP deflator) and the annual benchmarking/re-balancing exercise. The upward revisions to growth were concentrated in the latter years (post-2007) and these primarily reflected the annual re-balancing/benchmarking exercise (specifically, the incorporation of better-than-expected annual tax returns data).
US (July 2013): The level of GDP was raised by 3pp and the revised data showed a shallower recession in 2009 and a stronger recovery through the first half of 2012, but greater cyclical weakness in the first half of 2013 (although growth in 2013H1 was revised higher in subsequent releases). The revisions reflected a combination of methodological changes (the inclusion of new subcategories of intellectual property products) and the standard benchmarking/re-balancing exercise.
Euro area/EU (Summer 2014): The five-yearly benchmark revisions raised the level of EU real GDP by 4pp (methodological changes = +2.3pp; statistical improvements = +1.4pp), but with limited effects on GDP growth rates.
UK (September 2014): The revisions implied that the 2009 recession was shallower than previously thought, and the subsequent recovery (2010 to 2012) was stronger. The changes were introduced as part of the annual benchmarking/re-balancing exercise, without any major methodological changes.
US (July 2015): Average GDP growth for 2012Q1-2015Q1 was revised down from 2.2% to 2.0% annl. (it has since been revised up to 2.5%). The changes were predominantly due to the annual benchmarking/re-balancing exercise, with minor methodological changes.
US (December 2016): The re-classification of research and development (R&D) expenditures from intermediate inputs to part of fixed investment resulted in a 4pp upward revision to the level of GDP. The effects on GDP growth rates were more moderate but slightly positive.
Turkey (November 2017): The implementation of new calculation and collection methods, combined with an implementation of SNA 2008/ESA 2010 standards, resulted in the level of GDP being revised 20% higher and average GDP growth for 2010-2015 being revised 2pp higher.
Euro area/EU (Summer 2019): The five-yearly benchmark revisions implied limited changes to both the level and growth rates of Euro area GDP.
UK (September 2023): Significant upward revisions to growth both during and after Covid recovery (the change in real GDP between 2019Q4 and 2021Q4 was raised by 2pp). The revisions were announced as part of the annual benchmarking/re-balancing exercise, with relatively minor methodological changes (the introduction of improved estimates of the impact of global supply chains).
Euro area/EU (forthcoming, Summer 2024): The five-yearly benchmark revisions will be implemented across Europe this summer.
Appendix
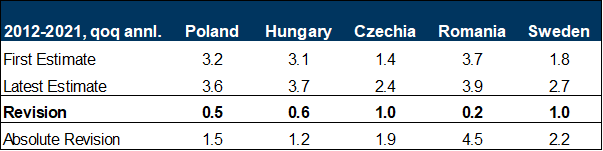
(i) Smaller Economies Also Display Revisions Bias
Exhibit 6: GDP Revisions Are Also Positive on Average in Poland, Hungary, Czechia, Romania, and Sweden
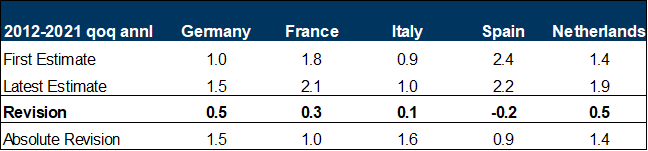
(ii) Downward Bias to Early Euro Area GDP Estimates Driven by Germany, the Netherlands, and Smaller Member States
Exhibit 7: Large Upward Revisions to German and Dutch GDP Data
(iii) Long-Run Biases in US, Euro area, and UK GDP Data Are Similar to Past 10 Years
Exhibit 8: US GDP Data (qoq annl.), First and Latest
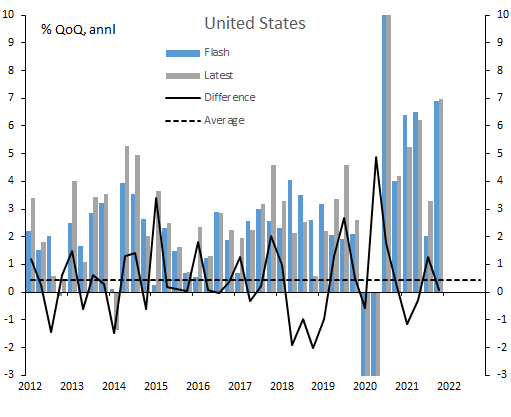
Exhibit 9: Comparing US GDP Revisions Over a Longer Time Frame
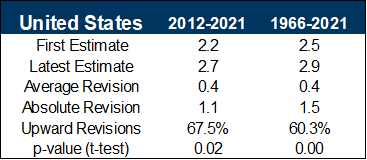
Exhibit 10: Euro area GDP Data (qoq annl.), First and Latest
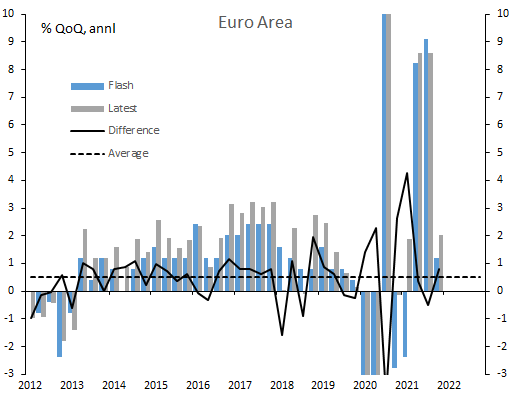
Exhibit 11: Comparing Euro Area GDP Revisions Over a Longer Time Frame
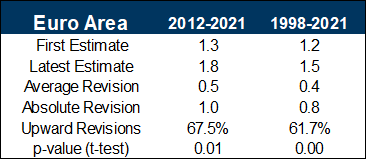
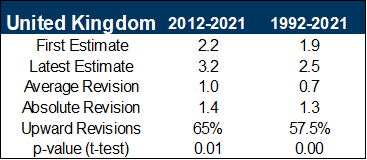
Exhibit 12: UK GDP Data (qoq annl.), First and Latest
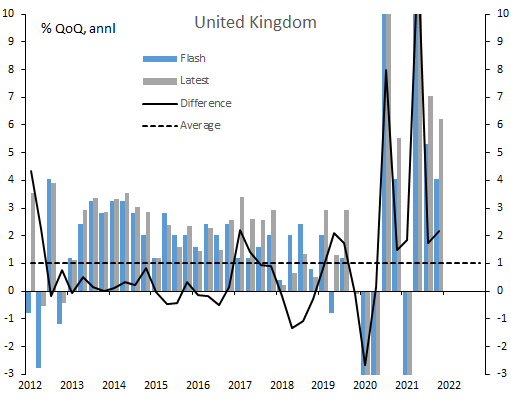
Exhibit 13: Comparing UK GDP Revisions Over a Longer Time Frame
- 1 ^ Our estimates of global GDP growth at year-end still contain an element of forecast, as Q4 GDP data have yet to be released. Nevertheless, we use year-end as a cut-off point because annual growth tracking moves on by one year at this point. Moreover, estimates of Q4 GDP are reasonably accurate at this stage, as they are based predominantly on reported data.
- 2 ^ We have excluded the Covid year of 2020 from this comparison, on the basis that the -7.3pp within-year forecast revision was atypical.
- 3 ^ Our China economics colleagues have previously analysed Chinese GDP revisions (see here and here) and provided us with the data that we use in our analysis.
- 4 ^ The average revisions over the longer time frames are similar to the averages over the past 10 years. For the US, where we have revisions data back to 1966, the average revision over the entire database has also been +0.4pp annl. For the Euro area (data back to 1998), the average revision has been +0.4pp annl. For the UK (data back to 1992), the average revision over the entire data base has been +0.7pp annl.
- 5 ^ We use six months as a cut-off point for this comparison, as all the information from high-frequency indicators will be available at this stage, while the longer-term drivers of revisions (i.e., the inclusion of annual data sources, supply-use rebalancing, and methodological changes) will yet take effect. If we extend the revision horizon from six months to one year, the share of total revisions rises to around one-half on average.
- 6 ^ For instance, for many years statistical agencies did not include the contribution of computer software to output, in part because it took them some time to agree on a common framework of measurement.
- 7 ^ We also tested whether revisions varied with changes in economic growth but found that these were not significant.
- 8 ^ For the full sample, the Euro area and UK, this result is signficant at the 1% level. For the US, it is significant at a 10% level.
- 9 ^ Of course, this doesn't imply that GDP is likely to be revised higher in every economy. For the US, the discrepancy between GDP and GDI (Gross Domestic Income) in 2023 increases the likelihood of downward revisions to US GDP.
Investors should consider this report as only a single factor in making their investment decision. For Reg AC certification and other important disclosures, see the Disclosure Appendix, or go to www.gs.com/research/hedge.html.