Goldman Sachs Research
Global Strategy Paper
The Concentration Conundrum; What to do about market dominance
11 March 2024 | 5:01AM GMT | Research | Portfolio Strategy| By Peter Oppenheimer and others
More
  • Stock market concentration has increased dramatically and has taken three broad forms: the rise in the share of the US equity market in the world, the rise in the share of the technology sector, and the rise in the dominance of the biggest companies in most regions.

  • But, does it really matter for investors that markets have become more concentrated and what, if anything, can they do about it? In this piece we look at each of these areas of increased market concentration, place them in historical context, and look at the implications and possible investment strategies to hedge concentration risk.

  • Market dominance is not unprecedented and is only a problem if it is not supported by fundamentals. That said, at the stock level in particular, dominant companies rarely stay the best performers over long periods of time. We therefore examine strategies to diversify. We recommend a more diversified geographical exposure. We identify a group of Global Ex Technology Compounders (the ETCs) and selected value compounders.

Concentration Consternation

In recent years there has been significant growth in equity market concentration; this theme has taken three forms:
  1. At the market level: the rise in the weight of the US in global stock markets.

  2. At the sector level: the rise in the weight of the technology sector within the US, in particular.

  3. At the stock level: the increased dominance of the so-called Magnificent 7 in the US, the GRANOLAS in Europe, and the top 30 stocks in Japan.

The question for investors is: does it really matter that markets have become more concentrated and what, if anything, can they do about it? In this piece we look at each of these areas of increased market concentration, place them in historical context, and look at the implications and possible investment strategies.

1. Market concentration by country: US equity market hegemony

The US equity market has seen an extraordinary rise in value since the global financial crisis (GFC), strongly outpacing that of other major markets, and taking its share of the global equity market to 50%. This is high by historical standards, although not unique. The equity market had a higher share in the global markets in the early 1970s, although the drivers were very different. In that period, the seven largest companies belonged to the oil sector (Exxon and Mobil), the autos sector (Ford, GM and Chrysler) together with General Electric and IBM.
Over the following 50 years, the US equity market has consistently been the world's biggest, although it briefly fell to less than 30% of the world in the late 1980s, when it was overtaken by Japan. At the peak of its bubble in 1989, the Nikkei hit 38,915 – a level that it has recently finally surpassed over nearly 35 years later. The four biggest companies in the world in 1989 were all Japanese banks (Industrial Bank of Japan, Sumitomo Bank, Fuji Bank and Dai-Ichi Kangyo Bank). Six of the 10 biggest companies in the world were Japanese. In the aftermath of the collapse of the Japanese market, the US once again resumed its leadership in the global equity market.

Exhibit 1: US equity market hegemony

Share of Global Market Cap
1. US equity market hegemony. Data available on request.
Source: Datastream, Worldscope, Goldman Sachs Global Investment Research
The longer-term rise in the relative size of the US equity market has reflected the dominance of the US economy. Nonetheless, it is interesting that the US equity market's domination of the world market has accelerated dramatically in recent years – particularly since the global financial crisis – and its gains have outstripped those of other regions (Exhibit 2).

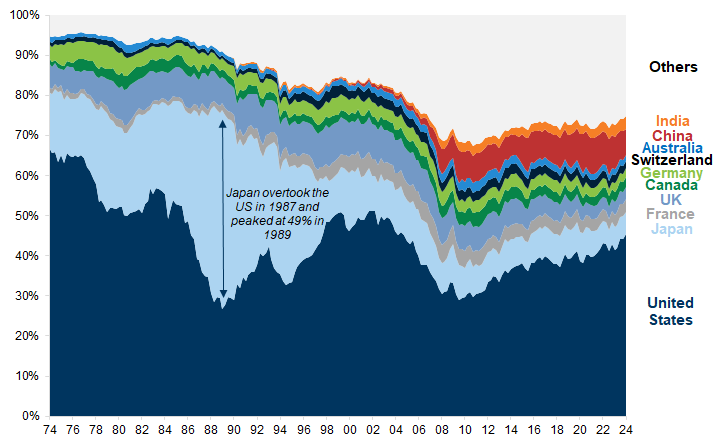
Exhibit 2: The longer-term rise in the relative size of the US equity market has reflected the dominance of the US economy

Market Cap ($ trillion). Asia incl. Japan
2. The longer-term rise in the relative size of the US equity market has reflected the dominance of the US economy. Data available on request.
Source: Datastream, Worldscope, Goldman Sachs Global Investment Research
Similarly, while the US economy has been the biggest global economy over the past 50 years, the share of equity market capitalisation relative to GDP has risen steadily in the US, although not so in the rest of the world (Exhibit 3). Some of this, however, reflects the fact that many non-US companies now reside within the US stock market.

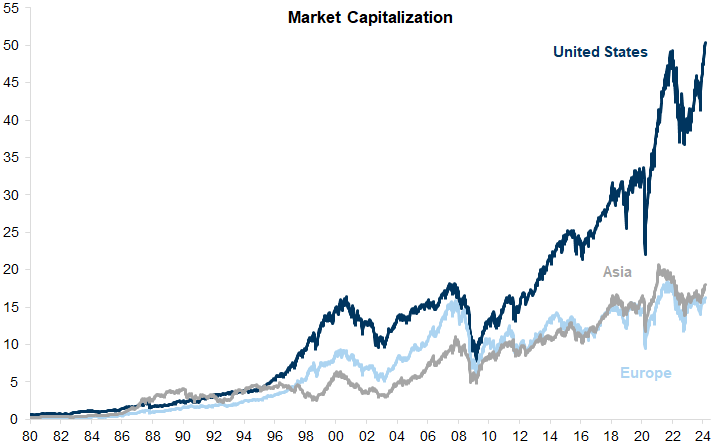
Exhibit 3: The share of equity market capitalisation relative to GDP has risen steadily in the US, although not so in the rest of the world

3. The share of equity market capitalisation relative to GDP has risen steadily in the US, although not so in the rest of the world. Data available on request.
Source: Bloomberg, Datastream, Worldscope, Goldman Sachs Global Investment Research
Only Switzerland and Denmark (much smaller economies) have stock market values that are bigger on a relative basis as a share of the economy (Exhibit 4). In Denmark's case, this mainly reflects the size of Novo Nordisk, whose stock market value alone is bigger than the annual GDP of the Danish economy.

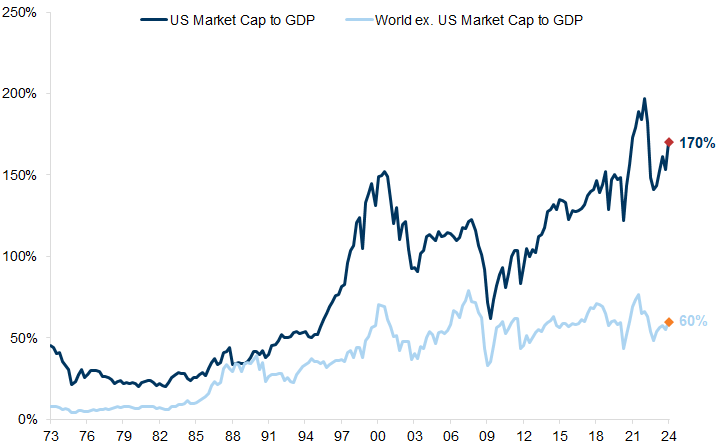
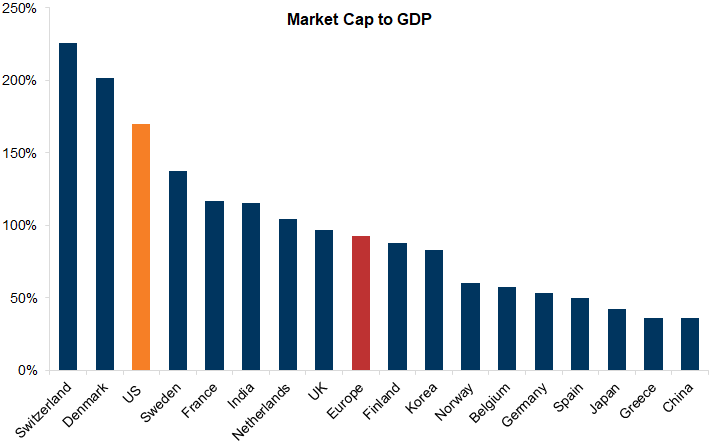
Exhibit 4: Most countries have Market Cap to GDP below the US

4. Most countries have Market Cap to GDP below the US. Data available on request.
Source: Datastream, Worldscope, Haver Analytics, Goldman Sachs Global Investment Research

Why has the US outperformed, and is this a problem?

There are very good reasons why the US equity market has outperformed and become more dominant. First, as Exhibit 5 shows, over the period since the GFC the US stock market has simply outgrown others in terms of earnings growth.

Exhibit 5: US stock market has simply outgrown others in terms of earnings growth

Price Return and NTM EPS in local currency. Indexed in Jan-2014
5. US stock market has simply outgrown others in terms of earnings growth. Data available on request.
Source: Datastream, STOXX, Goldman Sachs Global Investment Research
Second, over the same period, the 'Growth' factor has consistently outperformed the 'Value' factor as interest rates continued to fall, thereby pushing up the relative valuation of longer-duration assets. This briefly reversed during the early phase of rising interest rates in 2022, but has since continued (Exhibit 6).

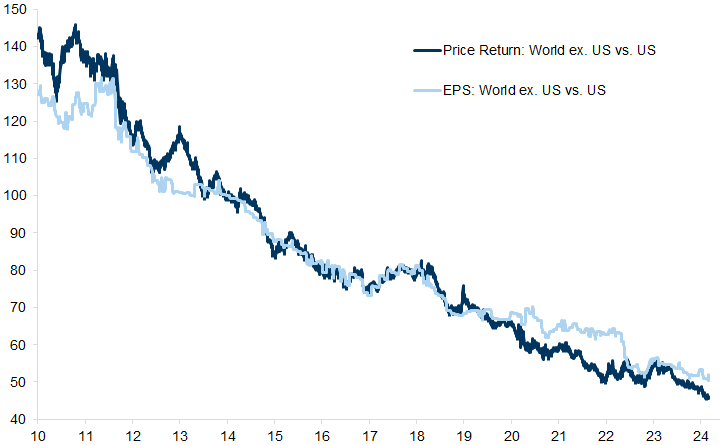
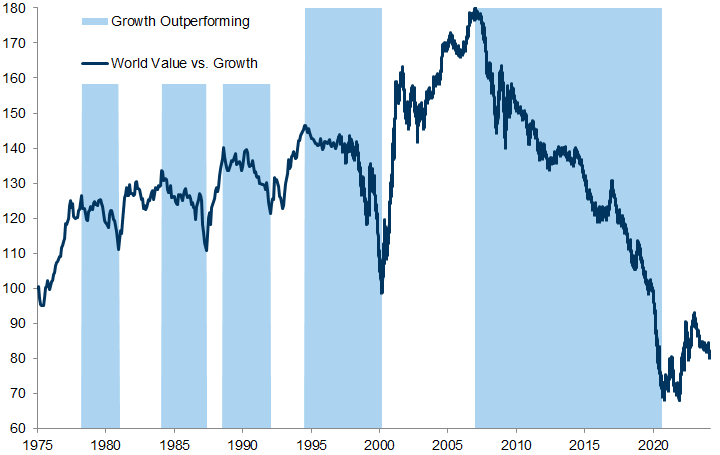
Exhibit 6: Growth has consistently outperformed Value since the GFC

Relative Price Performance (in USD). MSCI Indices
6. Growth has consistently outperformed Value since the GFC. Data available on request.
Source: Datastream, Goldman Sachs Global Investment Research
The outperformance of the US equity market since the GFC has mapped the outperformance of the ‘Growth’ factor, particularly relative to the rest of the world. Put another way, the US stock market has more exposure to faster growing industries than the rest of the world, and less exposure to slow growing companies. Many mature, value-orientated sectors faced specific headwinds after the financial crisis. Banks needed to recapitalise and cut dividends, while commodity-related companies suffered from falling prices as end-demand was weak. There are other explanations of US outperformance:
  • The reinvestment rate of companies in the US stock market is higher than in most other markets. The ability and willingness to reinvest at a high rate in companies that are growing is contributing to the relative lead of the US market. This is particularly so in the technology sector. The US also benefits, relative to other markets, from having comprehensive and unique support ecosystems, including collaboration with universities and the government, incubator and accelerator funds, VC and PE funds.

  • The liquidity of the US stock market is much higher than for other markets, helping to reduce the risk premium. The US equity market is increasing its depth relative to other markets. Geopolitical concerns and government involvement has reduced global appetite in some emerging markets, and in particular in China. Meanwhile, Europe has much poorer liquidity than the US. The US has also attracted investment and companies as a result of government incentives, tariffs on imports and the Inflation Reduction Act (IRA).

  • The US economy is bigger and stronger than others and the growing trend towards US listings by foreign-based companies has added to this effect; it means that a growing part of the value of foreign-originated companies are represented in the US market. Furthermore, even if not listed in the US, many European and other companies have generally increased their exposure (and assets) in the US (Exhibit 7).

Exhibit 7: Many European companies have increased their exposure to the US

Foreign sales exposure (%)
7. Many European companies have increased their exposure to the US. Data available on request.
Source: FactSet, Goldman Sachs Global Investment Research
That said, while fundamentals have driven the ascent of the US, its equity market has also become increasingly expensive relative to the rest of the world, even when taking into account the differences in sector weights (Exhibit 8).

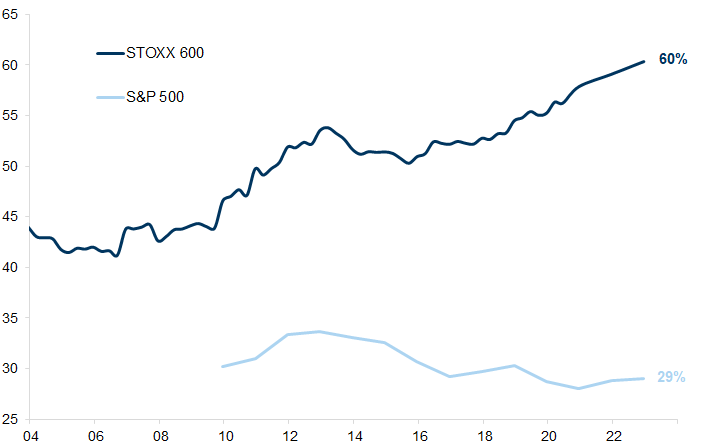
Exhibit 8: US equities have become increasingly expensive relative to the rest of the world

24m fwd P/E with Global Equities Weights
8. US equities have become increasingly expensive relative to the rest of the world. Data available on request.
Source: FactSet, Goldman Sachs Global Investment Research
Nevertheless, ths premium remains justified by superior rates of return on capital and the US valuation premium is not extreme when adjusting for its higher level of profitability and returns on equity (Exhibit 9).

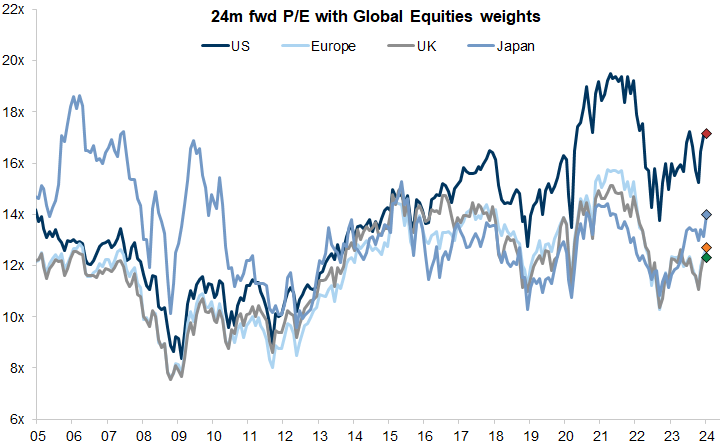
Exhibit 9: The US valuation premium is not extreme when adjusting for its higher profitability

S&P 500 and MSCI Europe. 12m fwd Price to Book Value and ROE
9. The US valuation premium is not extreme when adjusting for its higher profitability. Data available on request.
Source: Datastream, FactSet, Goldman Sachs Global Investment Research

What should Investors do about it?

Our view is that the size of the US equity market relative to others does not matter as long as it is supported by the fundamentals. In addition, when considering the size of the US market we also need to consider that other markets are highly correlated with the US. So, the value of diversification is not always as high as people think, particularly in Europe (Exhibit 10).
The best diversification opportunity in DM is Japan, which we view primarily as a restructuring opportunity, which we like and are overweight. We see the best diversification opportunities overall, however, in emerging markets. In our view, India, in particular, which we like, is a good Growth opportunity; China offers good diversification and is a Value opportunity (our Strategy team in Asia are overweight); and the Middle East also offers good diversification characteristics although our view here is more mixed – see EM in Focus: The "One Chart-er".
On balance, while we like the US market and believe its relative growth is based on strong fundamentals, we also believe that increased geographical diversification is justified. Put another way, we believe that there are many companies outside of the US that should be considered as part of a global diversified portfolio and should not be ignored simply because their base and listing location is outside of the US. Many quality growth companies exist in other regions that have globally diversified revenue streams and could be useful diversifiers in a US-dominated portfolio.

Exhibit 10: Some markets are highly correlated with the US, so the value of diversification is not always as high as people think

Correlation with the US Market (Weekly changes, in USD)
10. Some markets are highly correlated with the US, so the value of diversification is not always as high as people think. Data available on request.
Source: Datastream, Worldscope, Goldman Sachs Global Investment Research

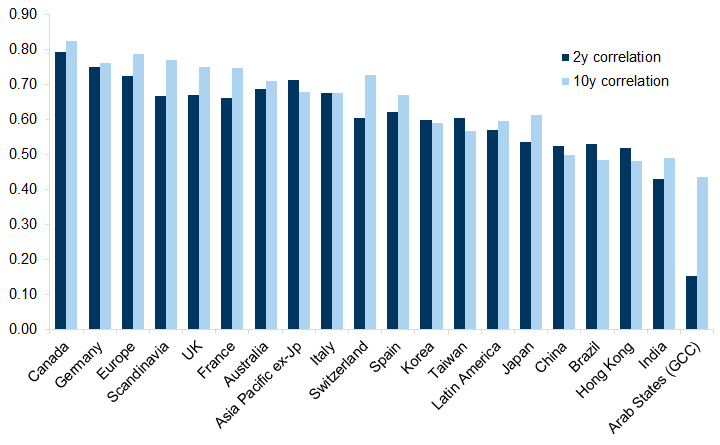
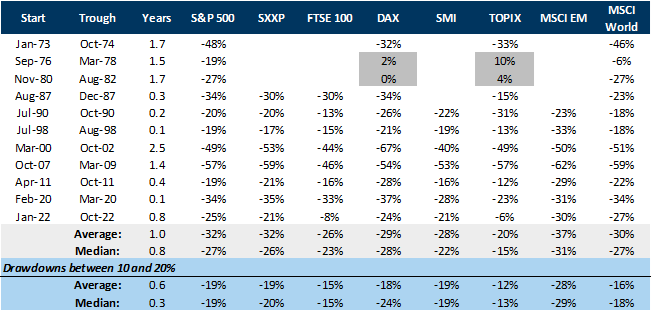
Exhibit 11: S&P 500 corrections – contagion to other markets

Price return during S&P 500 drawdowns in local currency (MSCI EM and World in USD)
11. S&P 500 corrections – contagion to other markets. Data available on request.
Source: Datastream, Goldman Sachs Global Investment Research

2. Market concentration by sector; the rise of Technology

Another form of market concentration that has emerged in markets over recent years is at the sector level, particularly with the rise of the technology sector. Once again, this is more obvious in the US than in other markets, but it has become a feature of many other markets too, particularly in Asia.

Exhibit 12: The rise of the technology sector

Weight of Technology, Media & Telecom (TMT) as % of Index
12. The rise of the technology sector. Data available on request.
Source: Datastream, Worldscope, Goldman Sachs Global Investment Research
This relative growth is not of concern, in our view, because it is reflective of relative fundamental earnings growth. Exhibit 13 shows that, while global technology profits have surged since the financial crisis, other sectors in aggregate have made virtually no progress. The differential continued in the pandemic recession as social distancing further supported demand for technology relative to other parts of the economy. While the rise in interest rates over the past couple of years dented the relative earnings growth of the technology sector, its superior growth rate has resumed over the past year and many of the biggest technology companies, which are already profitable and have significant cash piles, have actually benefited from higher interest rates and a significant focus on cost reduction. They have sufficient cash to reinvest at a very high rate without being impacted by higher borrowing rates.

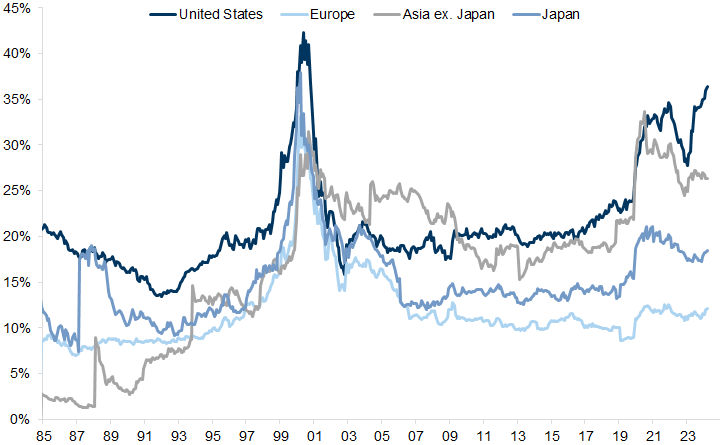
Exhibit 13: Tech earnings have outstripped those of the global market

12m Trailing EPS (USD). Indexed too 100 on Jan-2009
13. Tech earnings have outstripped those of the global market. Data available on request.
Source: Datastream, Worldscope, Goldman Sachs Global Investment Research
It is also worth remembering that the current dominance of the technology sector, even in the US equity market, is not unprecedented relative to other dominant sectors in the past. Exhibit 14 shows the biggest sector in the US equity market over time. The Information Technology and Communications industry is the biggest but this is by no means exceptional. Over the past 200 years, the biggest industry represented in the stock market at each point in time has reflected the major driver of economic growth. The Technology sector is about the same size as the Energy sector was at its height in the mid-1950s. It remains smaller in the index than both Transport (which dominated in the 20th century) or finance and real estate which drove the dominant part of the equity market in the 19th century.

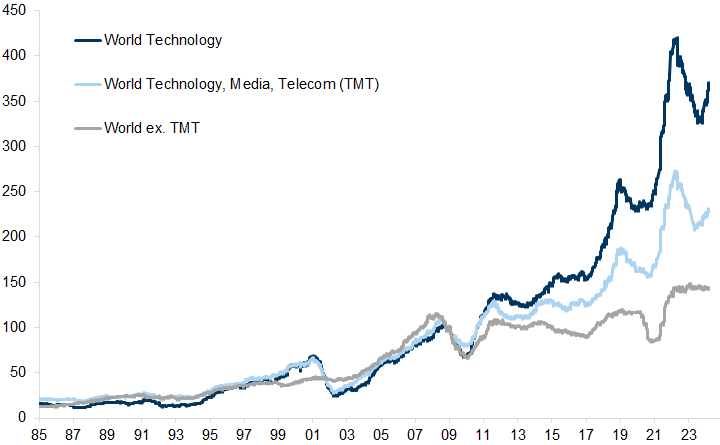
Exhibit 14: The technology sector is about the same size as the energy sector was at its height in the 1950s

14. The technology sector is about the same size as the energy sector was at its height in the 1950s. Data available on request.
Source: Datastream, Goldman Sachs Global Investment Research
The very rapid growth rates in companies associated with AI has fuelled a further rise in the relative exposure of this sector, but it is about the same size as the energy sector on a relative basis at its peak in the 1950s.

What should Investors do about it?

While we like technology and are overweight in all regions, we think there are good opportunities to hedge technology dominance by:
1. Diversifying technology exposure with selected ‘growth’ that is cheaper.
One way to diversify from technology is to supplement it with other growth exposures. Healthcare is a sector that we overweight in all regions (except Japan). It remains relatively cheap but also has high prospective growth. Furthermore, in time, we see this sector as being a beneficiary of AI technologies.

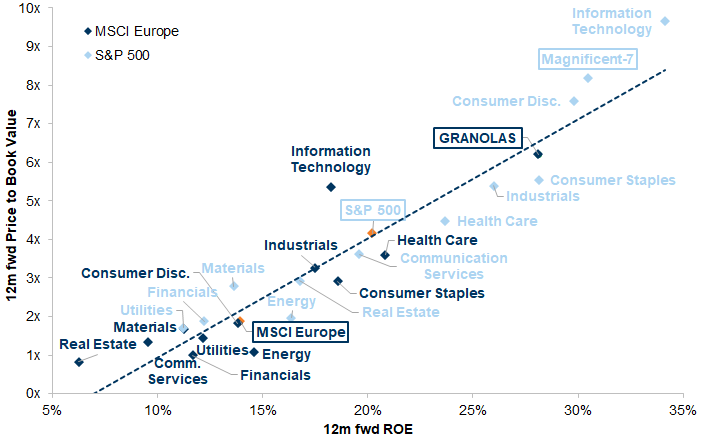
Exhibit 15: One way to diversify from technology is to supplement it with other defensive growth exposures

15. One way to diversify from technology is to supplement it with other defensive growth exposures. Data available on request.
Source: FactSet, Goldman Sachs Global Investment Research
Another growth diversifier is the European GRANOLAS, 11 of the largest companies in the STOXX 600. These stocks trade at a lower valuation (around 20x P/E) than the Magnificent 7 and have performed well. They share some similar characteristics to the technology leaders; they have strong balance sheets, are reporting high profits, and have similarly high and stable margins. And, like healthcare and the Magnificent 7, they are reinvesting at a high rate, allowing them to compound earnings over time.

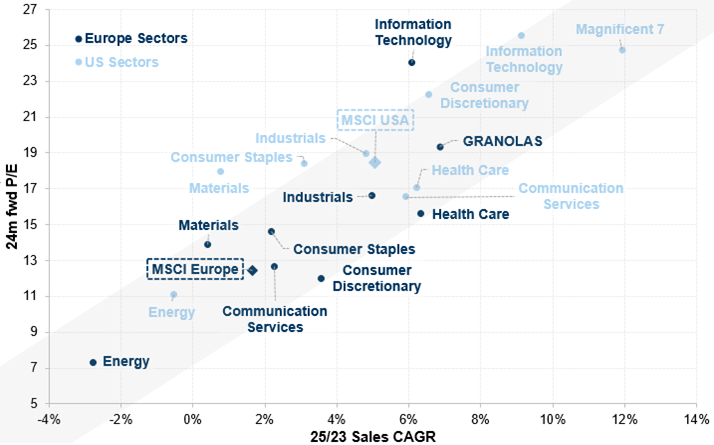
Exhibit 16: The GRANOLAS are reinvesting at a high rate, allowing them to compound earnings over time

Last 5y Growth Investment Ratio ((Growth CAPEX + R&D / CFO). MSCI AC World Sectors
16. The GRANOLAS are reinvesting at a high rate, allowing them to compound earnings over time. Data available on request.
Source: Datastream, FactSet, Goldman Sachs Global Investment Research
They also are one of the least correlated of the groups to the S&P 500 (Exhibit 17).

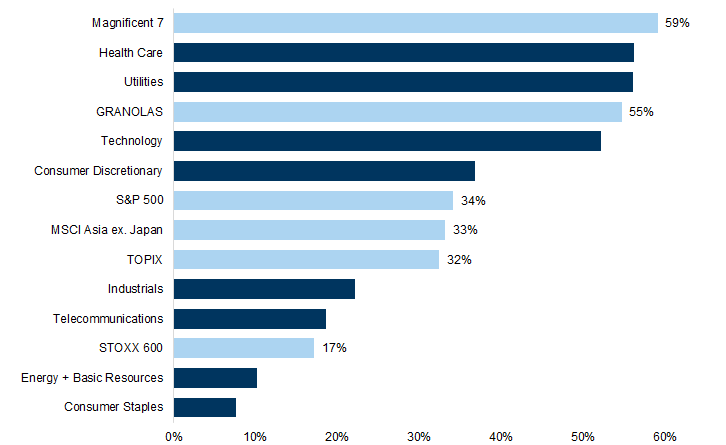
Exhibit 17: GRANOLAS are among the least correlated slices with the S&P 500

Correlation with the S&P 500 (Weekly changes, in USD); Global Sectors
17. GRANOLAS are among the least correlated slices with the S&P 500. Data available on request.
Source: Datastream, Goldman Sachs Global Investment Research
2. Diversify into the Ex Tech Compounders (the ETCs)
Related to point 1 above, we think there are many 'quality compounders' outside of the technology sector that look attractive. We call these the Ex Tech Compounders, or ETCs.
We have put together a list of global ETCs, which can be found in the Appendix. The list looks for companies that have market caps above $10bn and have high margins (EBITDA > 14%, EBIT > 12%, Net Income > 10%), high profitability (ROE > 10%), strong balance sheets (ND/Equity < 75%, ND/EBITDA < 2x), low volatility (Vol < 50), strong growth prospects (sales > 4% and earnings > 8%) and have consistently grown their earnings over the past decade.
As Exhibit 18 shows, both the GRANOLAS in Europe and the ETCs have outperformed the global market over the past year and have kept pace with the performance of the Magnificent 7. The valuation of our global ETCs list is in line with its average since 2016 and the list trades at the lowest premium to the world stock market since 2018.

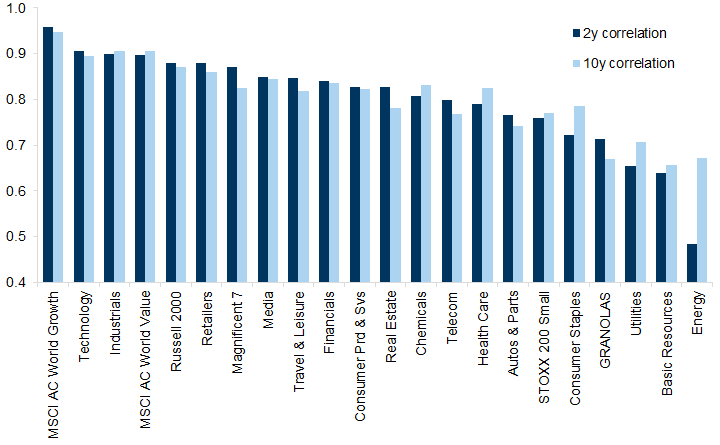
Exhibit 18: The Global Ex Tech Compounders (ETCs) have outperformed the global market over the past year...

Total Return Performance
18. The Global Ex Tech Compounders (ETCs) have outperformed the global market over the past year.... Data available on request.
Source: Datastream, Goldman Sachs Global Investment Research

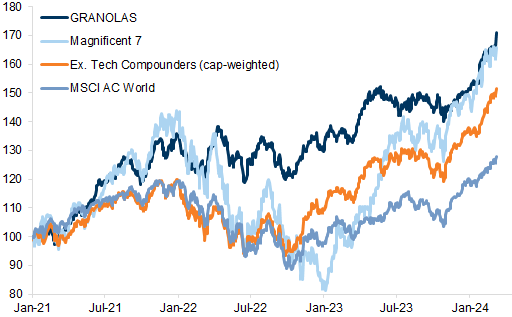
Exhibit 19: ...and since 2015

Ex. Tech Compounders (ECTs). Relative total return performance
19. ...and since 2015. Data available on request.
Source: Datastream, Goldman Sachs Global Investment Research

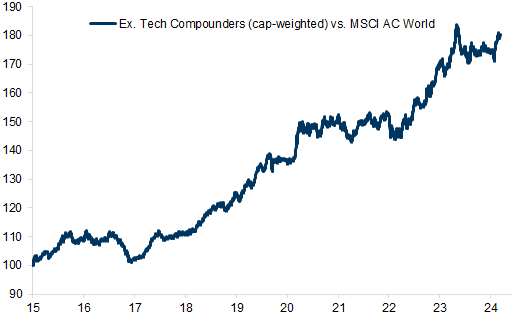
Exhibit 20: The valuation of our global ETCs list is in line with its average since 2016...

12m fwd P/E
20. The valuation of our global ETCs list is in line with its average since 2016.... Data available on request.
Source: Datastream, Goldman Sachs Global Investment Research

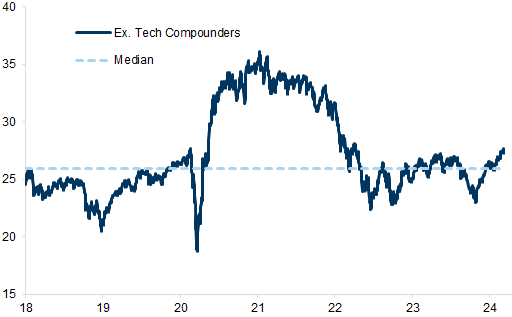
Exhibit 21: ...and the list trades at the lowest premium to the world stock market since 2018

12m fwd P/E premium
21. ...and the list trades at the lowest premium to the world stock market since 2018 . Data available on request.
Source: Datastream, Goldman Sachs Global Investment Research

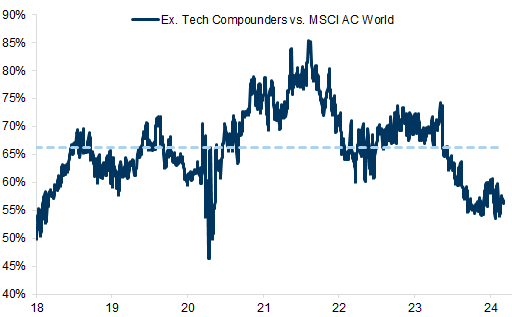
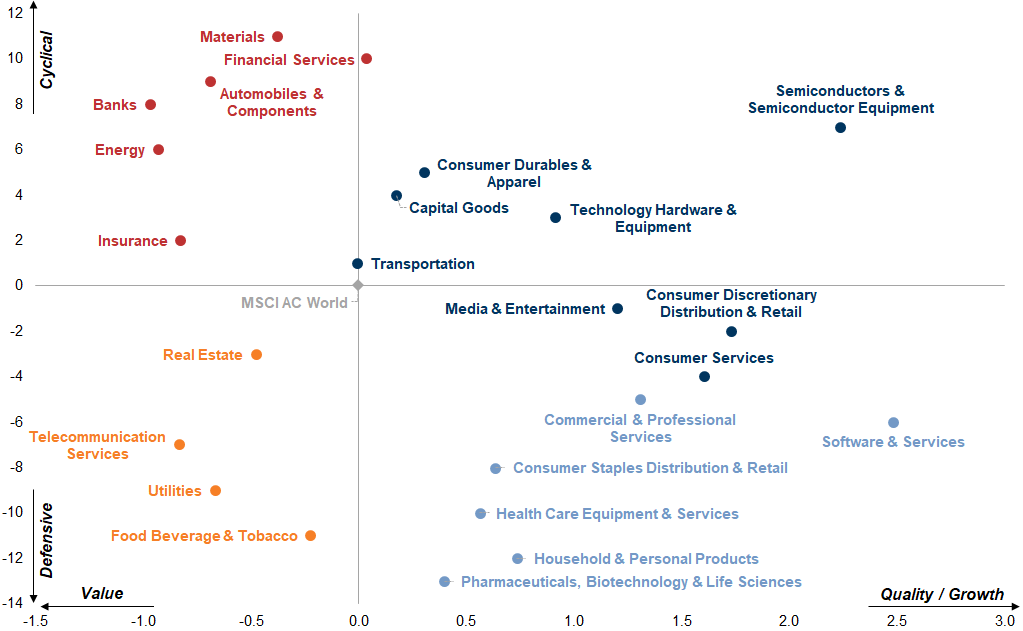
Exhibit 22: MSCI AC World exposure to Value/Growth/Cyclical/Defensive

MSCI AC World
22. MSCI AC World exposure to Value/Growth/Cyclical/Defensive. Data available on request.
The x-axis is a Value score. It is the average z-score of three valuation metrics: earnings yield (E/P), dividend yield (D/P), and the inverse of price-to-book (B/P). The y-axis is a Cyclical/Defensive rank. It is based on the sensitivity of each sector to the market, macro surprises and global activity.
Source: FactSet, Goldman Sachs Global Investment Research
3. Complement Quality Growth with some Value.
i) In the US, we have an overweight on energy and financials.
ii) In Europe, we all have an overweight on consumer cyclicals (with activity rebounding/high savings/real wage growth).
iii) In Asia, we recommend selected Value, including Cash Returns, which the market is rewarding: High Dividend Yield with Growth (GSSZDIVG) together with a Value Focus, especially given the focus on value unlocks in Japan and Korea: Value Basket (GSSZVALU).

3. Concentration by stock; the growth of the Magnificent 7 and GRANOLAS

The issue of stock concentration is perhaps the one that attracts the most attention. This is understandable because in many cases active managers cannot gain sufficient exposure to the largest stocks to benefit from their performance given restrictions on stock concentration within portfolios. In the US, the 10 largest companies have reached over 30% of the market value of the S&P 500, the highest level since 1980. Our US colleagues have explored the implications in detail in: US Equity Views - 100 years of US equity market concentration and momentum.

Exhibit 23: The 10 largest companies have reached over 30% of the market value of the S&P500, the highest level since 1980

23. The 10 largest companies have reached over 30% of the market value of the S&amp;P500, the highest level since 1980. Data available on request.
Shadow = NBER US Recession Period
Source: Goldman Sachs Global Investment Research
While the focus is predominantly on the US, there has been a similar pattern to varying degrees in many other markets. Europe has the highest concentration since the GFC, and is approaching the record levels of concentration seen during the technology bubble. In particular, the group of GRANOLAS stocks account for nearly one quarter of the value of the 600 biggest companies in Europe. That said, these companies are more diversified by industry with representation across technology, healthcare, luxury and consumer staples.

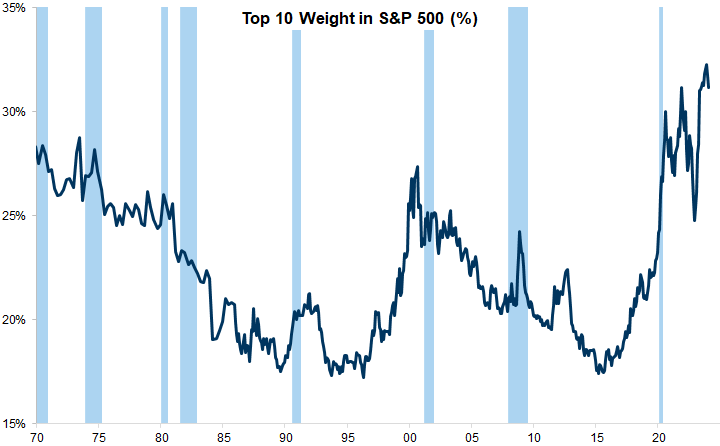
Exhibit 24: While the focus is predominantly on the US, there has been a similar pattern to varying degrees in many other markets

Weight of Top 10 Stocks by Market Cap
24. While the focus is predominantly on the US, there has been a similar pattern to varying degrees in many other markets. Data available on request.
Source: Datastream, STOXX, Goldman Sachs Global Investment Research
Indeed, the Magnificent 7 and the GRANOLAS have generated over half of their respective market returns over the past couple of years.

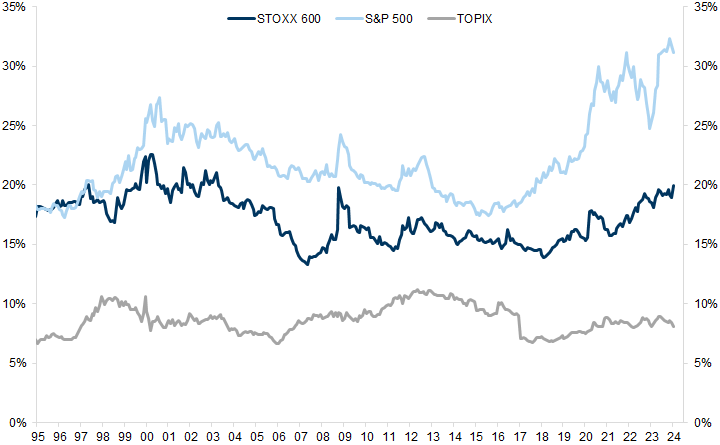
Exhibit 25: The contribution of the Magnificent 7 and the GRANOLAS to aggregate index returns is very high

25. The contribution of the Magnificent 7 and the GRANOLAS to aggregate index returns is very high. Data available on request.
Source: Bloomberg, Datastream, Goldman Sachs Global Investment Research
Similarly, although the Japanese market appears to be less concentrated, the comparison is unfair since the Topix has nearly 2000 companies; the 30 largest companies in the Topix have increased their relative size to the 97th percentile since 1995, making their share as a proportion of the market very similar to the concentration of the Magnificent 7 relative to the 500 companies in the S&P composite index (Exhibit 26).

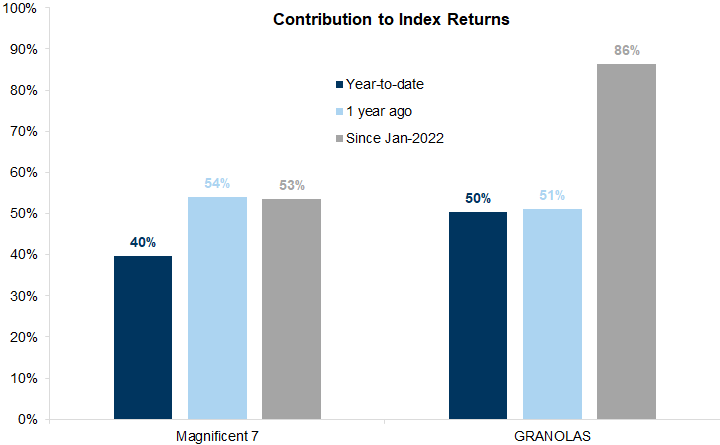
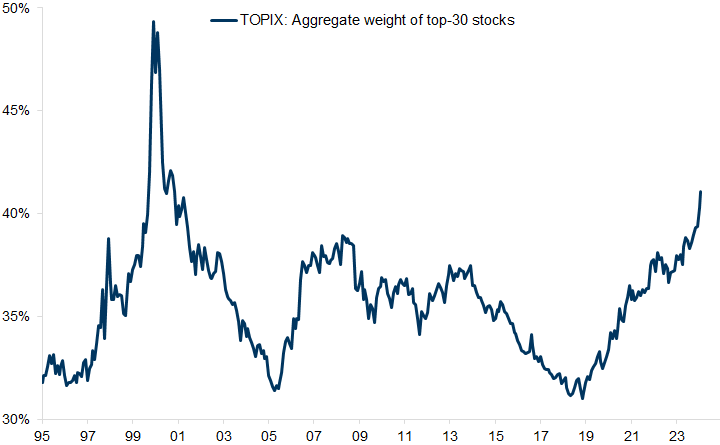
Exhibit 26: The aggregate weight of the top 30 stocks in the TOPIX continues to rise

Weight of Top-30 stocks
26. The aggregate weight of the top 30 stocks in the TOPIX continues to rise. Data available on request.
Source: Goldman Sachs Global Investment Research

Does high stock market concentration reflect a bubble?

While high stock market concentration may be a sign of a bubble, it does not necessarily mean there is one. For example, when Japan’s stock market briefly became the world's largest, and reached a P/E of 67x, the biggest companies in the index were banks, but the market was not particularly concentrated.
Furthermore, while the biggest stocks in the US equity market are much bigger today as a share of the market compared with the stock market bubble of 2000, current valuations are much lower than have been typical in other recent bubble periods, stretching back to the Nifty 50 era of the early 1970s, the Japanese bubble in the late 1980s, and indeed the technology bubble in 2000 (Exhibit 27).

Exhibit 27: Dominant companies today are not as expensive as those in previous ‘bubble’ periods in history

27. Dominant companies today are not as expensive as those in previous ‘bubble’ periods in history. Data available on request.
*Actual (LTM) P/E and EV/Sales data from 02/01/1973 for Nifty 50. **LTM P/E data and EV/Sales from 27/12/1989 for Japan Financial Bubble. ***24m fwd P/E and EV/Sales data from 24/03/2000 for Tech Bubble.
Source: Datastream, FactSet, Goldman Sachs Global Investment Research
Perhaps more importantly, however, the current dominant companies are much more profitable and have stronger balance sheets than those that dominated during the tech bubble (Exhibit 28).

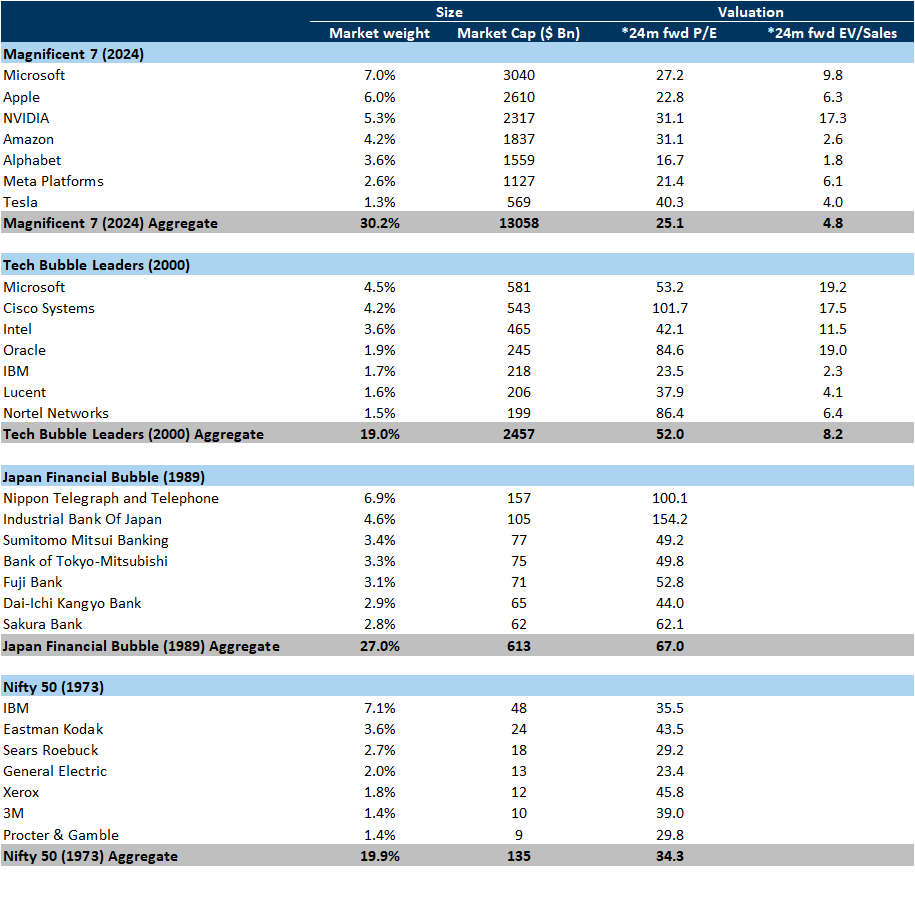
Exhibit 28: The current dominant companies are much more profitable and have stronger balance sheets than those that dominated during the tech bubble

Next twelve month estimate for Big Tech & last twelve months for Tech Bubble
28. The current dominant companies are much more profitable and have stronger balance sheets than those that dominated during the tech bubble. Data available on request.
Source: Datastream, FactSet, Goldman Sachs Global Investment Research
Furthermore, high stock concentration is not unusual. As Exhibit 29 shows for the US equity market, the biggest company over time has often been bigger than the biggest company today.

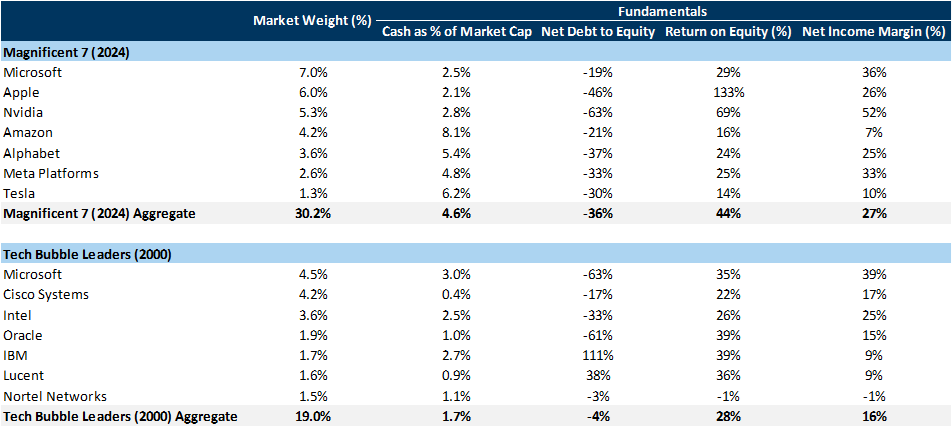
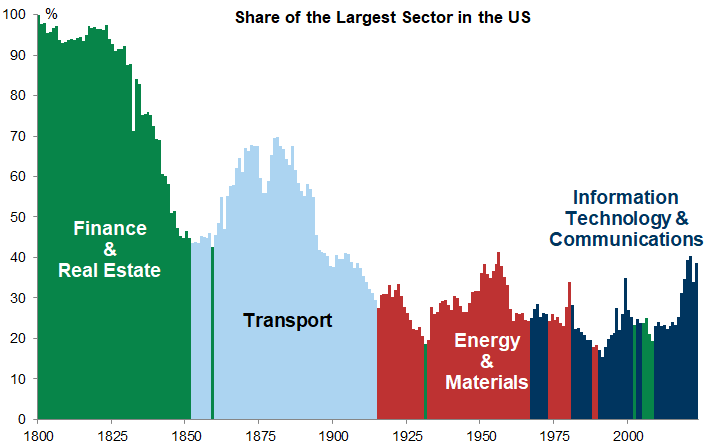
Exhibit 29: The largest company in the index has historically belonged to the dominant sector

% of S&P 500 market cap and % of S&P net income before 1974
29. The largest company in the index has historically belonged to the dominant sector. Data available on request.
Source: Datastream, Goldman Sachs Global Investment Research
The power of the dominant companies to generate shareholder returns and compound over time is a feature that has been recognised in much of the literature on the subject. Bessembinder[1], for example, conducted a study of all 26,168 companies in the US that had publicly listed equity since 1929 and found that, over time, while aggregate wealth creation had been $47.4 trillion, the majority reduced shareholder wealth. He also found that the extent to which stock market wealth creation is concentrated in a few companies has increased over time. One of the reasons for this may be the growing issue of scale required in dominant technology platforms, particularly when it comes to compute power and R&D spending. Another factor, which might exacerbate these fundamentals, is the growth of passive relative to active investment (Exhibit 30). This can make 'Momentum' an important factor as the 'winners' get bigger over time as more investment backs these companies.

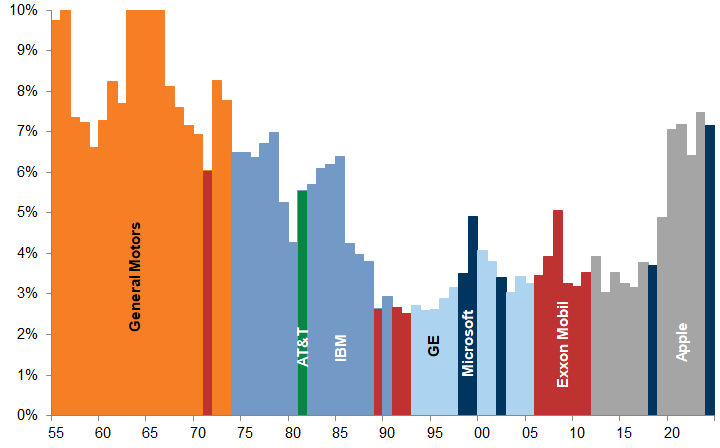
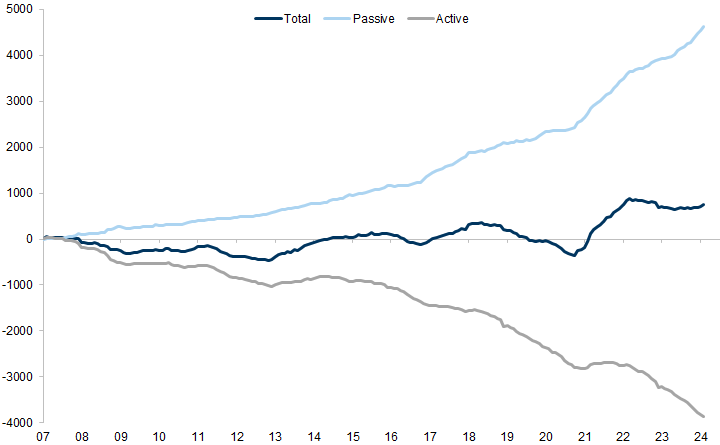
Exhibit 30: Cumulative flows into equity from global investors

Active and Passive funds. Monthly flows, USD bn. EPFR Country Flows (weekly data for current month).
30. Cumulative flows into equity from global investors. Data available on request.
Source: EPFR, Goldman Sachs Global Investment Research

Is high stock concentration a big risk?

Historically, with new entrants emerging, few companies remain unscathed as competition either forces companies to disappear, merge or be acquired. From this perspective, a market that becomes dominated by a few stocks becomes increasingly vulnerable to either disruption or anti-trust regulation.
There are, for example, only 52 companies that have appeared every year in the Fortune 500 since 1955. In other words, just over 10% of the Fortune 500 companies in 1955 have remained on the list during the 69 years through this year[2]. Based on this history, it would appear reasonable to assume that when the Fortune 500 list is released 70 years from now in the 2090s, almost all of today’s top companies will no longer exist as currently configured and will be replaced by new companies in new, emerging industries that we can’t even imagine today.

Exhibit 31: Only 52 companies have remained in the Fortune 500 list since 1955

31. Only 52 companies have remained in the Fortune 500 list since 1955. Data available on request.
Source: American Enterprise Institute, Data compiled by Goldman Sachs Global Investment Research
Innovation tends to generate new technologies, products and markets; alongside these, stockmarket leadership also tends to change. This process sometimes accelerates or slows down but since 1980, for example, more than 35% of S&P 500 constituents have turned over during the average 10-year period, largely reflecting innovation.
Survivor bias means the index is continually reconstituted as less successful companies are replaced by new firms with better growth prospects. The last 20 years in particular have seen the emergence of a group of companies that have come to dominate the technology and related industries in a surprisingly rapid transformation of the business landscape. Of the current top 50 companies in the US, only half of them were in the top 50 a decade ago, and many companies did not even exist before the 1990s (NVIDIA (1993), Amazon (1994), Netflix (1997), PayPal (1998), Alphabet (1998), Salesforce (1999), Tesla (2003) and Facebook (2004)).
As a result of changes in leadership and, by implication, growth, history would suggest that buying dominant companies generates lower returns over time. For example, Exhibit 32 shows the total return on average since 1980 that would have been achieved by buying and holding the top 10 stocks over different time horizons (from 1 year out to 10 years), while Exhibit 33 shows the same in relative returns (compared with the S&P 500). These data suggest that, while absolute returns remain good for the dominant companies, these strong returns fade over time. Importantly, however, the returns are generally negative for dominant companies if an investor buys and holds them as other faster-growing companies come along and outperform them.
Nevertheless, this does not mean that these companies would necessarily be poor investments. They may well remain good compounders, be more defensive and enjoy lower volatility and higher risk-adjusted returns.

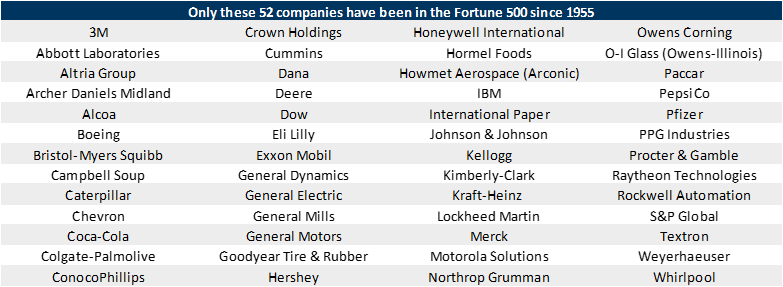
Exhibit 32: Absolute returns remain good for dominant companies...

Average forward realised absolute return (US Top 10 companies). Since 1980
32. Absolute returns remain good for dominant companies.... Data available on request.
Source: Datastream, Goldman Sachs Global Investment Research

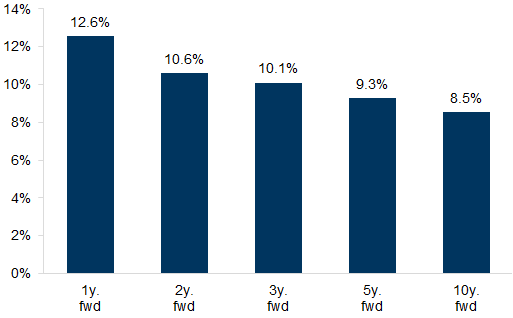
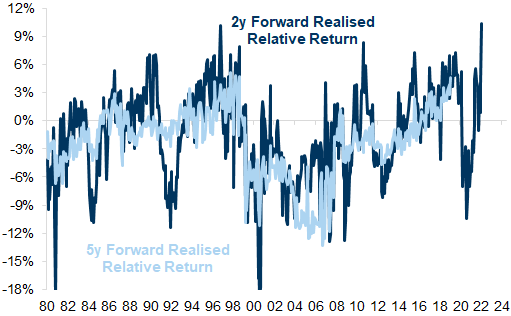
Exhibit 33: ...but they generally underperform (over the long run)

Average forward realised relative return (US Top 10 companies). Since 1980
33. ...but they generally underperform (over the long run). Data available on request.
Source: Datastream, Goldman Sachs Global Investment Research

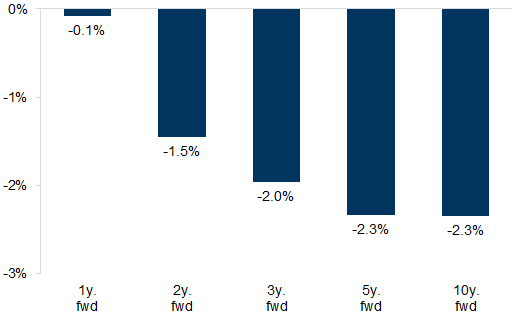
Exhibit 34: The current dominant group of companies has performed well in absolute terms

Average forward realised absolute return (US Top 10 companies)
34. The current dominant group of companies has performed well in absolute terms. Data available on request.
Source: Datastream, Goldman Sachs Global Investment Research

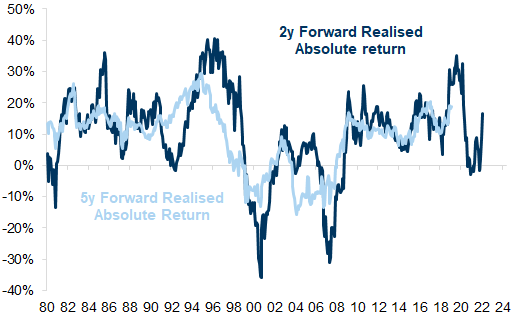
Exhibit 35: The current dominant group of companies has performed better in relative terms compared with dominant companies in the past

Average forward realised relative return (US Top 10 companies)
35. The current dominant group of companies has performed better in relative terms compared with dominant companies in the past. Data available on request.
Source: Datastream, Goldman Sachs Global Investment Research
Exhibit 34 and Exhibit 35 show that the current dominant group of companies has performed better in absolute and relative terms compared with dominant companies in the past. Again, none of this suggests that the current dominant companies will perform poorly or will not be good investments, but it does suggest that investors should look elsewhere for the next group of high-growth companies.

What should Investors do about it?

Investors face a flatter trajectory for equity markets over the next few years as a higher cost of capital and less globalisation mean lower returns (see our Global Strategy Paper on the Post Modern Cycle). Under these conditions, we think investors should employ a barbell approach:
  1. Defensive, strong balance sheet growth companies that are reinvesting and able to compound superior earnings growth - like the ETCs.

  2. Mature companies that are cash-generative and are able to buy back shares and pay dividends.

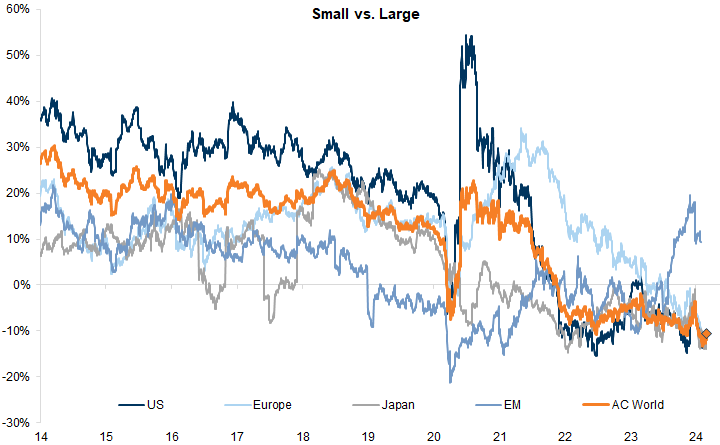
  3. Smaller cap companies with lower valuations (see, for example, US Macroscope: Low valuations and a healthy growth outlook signal more upside for small-caps).

Exhibit 36: Small vs. Large

12m fwd P/E Premium (or Discount)
36. Small vs. Large. Data available on request.
Source: FactSet, Goldman Sachs Global Investment Research

Appendix

Criteria for Global Ex. Tech Compounders:
  • Constituents of MSCI AC World

  • Excludes GS Sell-rated companies

  • Large cap (Mkt Cap > $10bn)

  • High margins (EBITDA > 14%, EBIT > 12%, Net Income > 10%)

  • High profitability (ROE > 10%)

  • Strong balance sheets (ND/Equity < 75%, ND/EBITDA < 2x)

  • Volatility (5y Realized Vol < 50)

  • Growth prospects (sales > 4% and earnings > 8% 2y forward CAGR) and consistently grown their earnings over the past decade

  • Based on consensus estimates

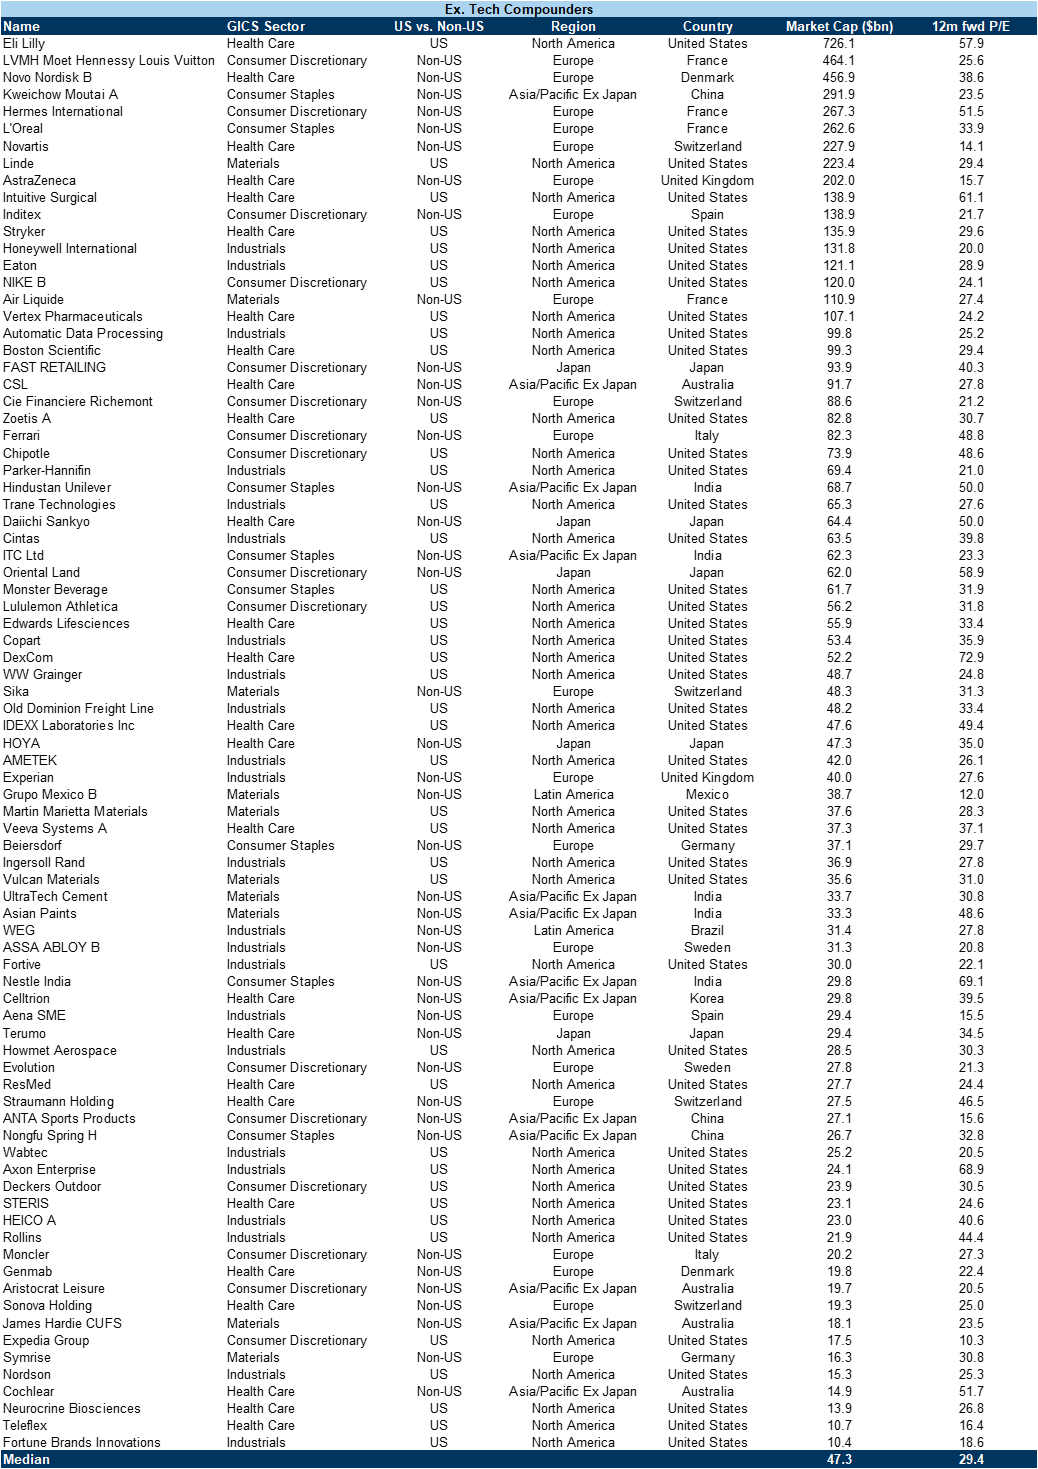
Exhibit 37: Ex. Tech Compounders

37. Ex. Tech Compounders. Data available on request.
Source: Datastream, FactSet, Goldman Sachs Global Investment Research
  1. 1 ^ Bessembinder, Hendrik (Hank), Wealth Creation in the U.S. Public Stock Markets 1926 to 2019 (February 13, 2020). Available at SSRN:https://ssrn.com/abstract=3537838 or http://dx.doi.org/10.2139/ssrn.3537838
  2. 2 ^ https://www.aei.org/carpe-diem/only-52-us-companies-have-been-on-the-fortune-500-since-1955-thanks-to-the-creative-destruction-that-fuels-economic-prosperity-2/

Investors should consider this report as only a single factor in making their investment decision. For Reg AC certification and other important disclosures, see the Disclosure Appendix, or go to www.gs.com/research/hedge.html.