Global Views: Cutting Through the Noise
1. After plummeting through most of 2023, the sequential pace of US core inflation has rebounded recently. With the CPI and PPI in hand, we estimate that month-on-month core PCE inflation in February ran at 0.29%—below the 0.45% we now estimate for January, but well above the 0.13% average of the fourth quarter. This has brought our year-on-year core PCE forecast for 2024Q4 back to 2.4%, roughly where it stood last fall. This is equal to the FOMC’s median projection as of December, which we expect to remain unchanged in Wednesday's update. We also expect the FOMC's projection of three 25bp cuts this year to remain unchanged and have shaved our own forecast from four to three cuts (June, September, and December).
Exhibit 1: A Roundtrip for Our Core PCE Forecast
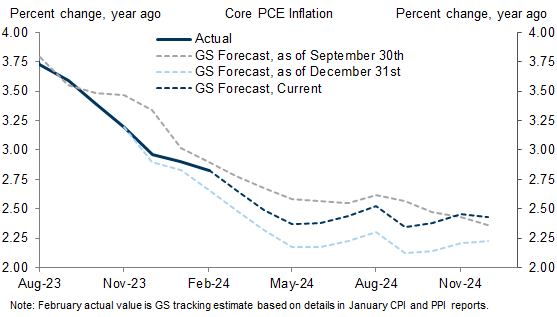
Source: Department of Commerce, Haver Analytics, Goldman Sachs Global Investment Research
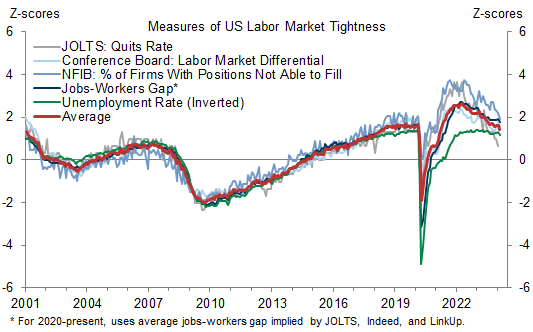
2. Despite this setback, the US economy is still on track for a soft landing, defined as a return of inflation to 2% without a recession. The recent growth and employment numbers have reinforced our view that the supply-demand imbalances in the economy are abating. First, after another weaker-than-expected retail sales report, Q1 GDP growth is tracking at 1.6%, down from 4% in 2023H2. Second, while nonfarm payrolls in February grew a preliminary 275k, part of the increase was due to favorable weather and January was revised down from 353k to 229k. Third, the unemployment rate rose from 3.7% to 3.9%. And fourth, broader measures of labor market slack such as the quits rate and our jobs-workers gap have continued to ease in recent months, so that a composite measure of labor market pressure has returned to where it stood in February 2020.
Exhibit 2: Labor Market Tightness Is Back to February 2020 Levels
Source: Haver Analytics, Goldman Sachs Global Investment Research
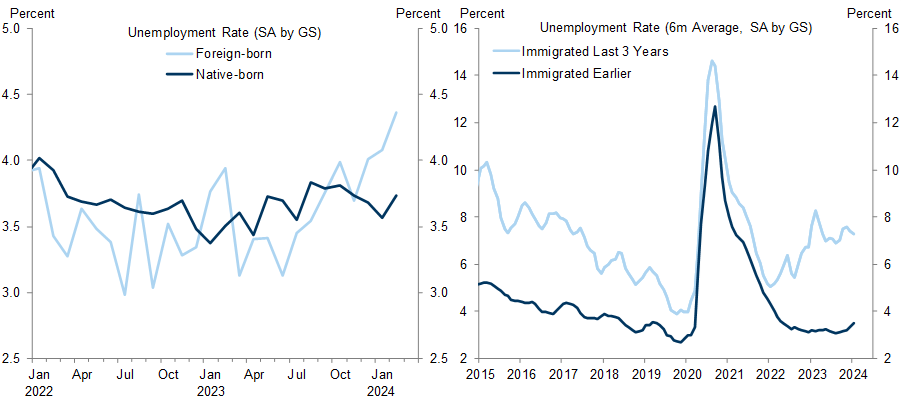
3. A key reason for the smooth labor market rebalancing despite strong GDP growth and rapid payroll gains has been the immigration surge. Based on work by Wendy Edelberg and Tara Watson as well as the Congressional Budget Office, we estimate that net immigration totaled 2.5 million last year, 1.5 million above the long-term trend. Even assuming that the inflow slows this year, we expect it to keep the "breakeven" pace of payroll gains—the pace necessary to keep the unemployment rate stable—at 125k this year, 50k above the long-term trend. The inflow has also led us to raise both our potential and actual GDP growth forecast this year by 0.3pp, and we now expect 2.4% growth on a Q4/Q4 basis. Finally, the inflow provides important context for the rise in the unemployment rate from 3.4% in April 2023 to 3.9% in February 2024. It has mainly occurred among (recent) immigrants and probably largely reflects lags between their labor market entry and job-finding. Such a supply-driven increase in unemployment is a fundamentally more benign development than a demand-driven increase that involves laying off existing workers, although it should still help bring aggregate wage growth down to more sustainable levels.
Exhibit 3: The Uptick in the Unemployment Rate Is Concentrated Among (Recent) Immigrants
Source: Department of Labor, Department of Commerce, Goldman Sachs Global Investment Research
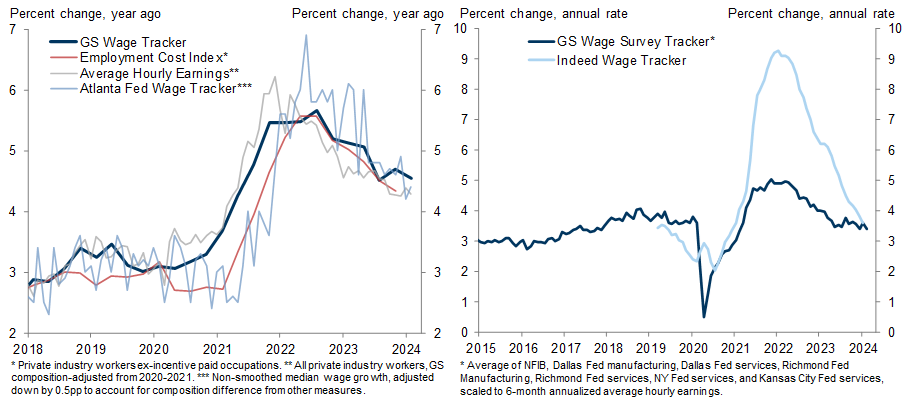
4. The ongoing slowdown in wage growth fits well into this picture. It is visible across all three of the major wage measures. The employment cost index continued to slow meaningfully in Q4 (although Q1 won't be available until April 30). Average hourly earnings grew just 0.1% in February while January was revised down to 0.5%, keeping the downward trend in the year-on-year rate intact. And over the past two months, the Atlanta Fed wage growth tracker—which measures year-on-year changes in individual wages in the household survey—ran at the lowest rate since 2021. Moreover, forward-looking measures suggest that the slowdown has further to run. Both our wage survey tracker and the Indeed wage tracker—which is based on posted wages in job ads—are already consistent with a slowdown to 3½%, our estimate of sustainable wage growth at 2% inflation and 1½% productivity growth.
Exhibit 4: Wage Growth Is Slowing Steadily
Source: Haver Analytics, Goldman Sachs Global Investment Research
5. The wage deceleration suggests that the recent rebound in CPI/PCE core services inflation excluding rent/OER—sometimes labeled the “supercore”—is likely to reverse. We also have strong conviction that rent and OER inflation will trend down further because alternative indicators of asking rents remain weak and the catch-up of existing to new rents is largely complete. And we expect renewed declines in core goods prices after a 0.1% increase in February. The broad reason is that price levels and profit margins in the manufactured goods sector look ripe for further correction. More specifically, we note that a) February’s increase in the used car CPI is at odds with the continued slide in used car auction prices and b) the increase in global shipping costs related to the attacks in the Red Sea has started to reverse in recent weeks.
Exhibit 5: Good News Coming on OER and Used Cars
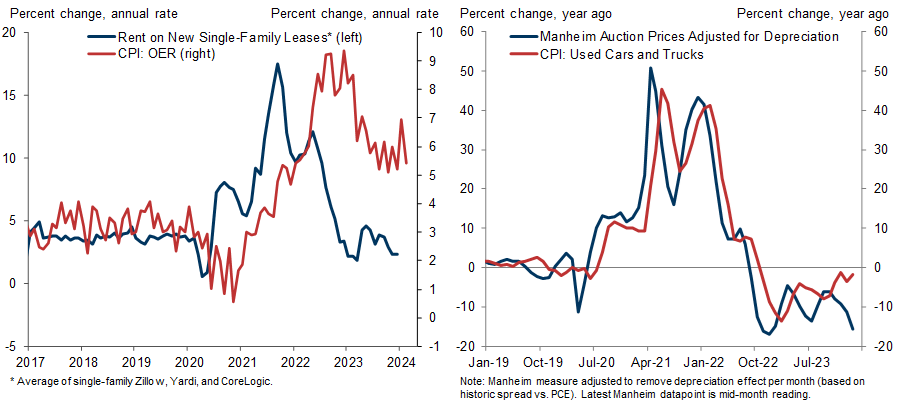
Source: Zillow, Yardi, CoreLogic, Manheim, Haver Analytics, Goldman Sachs Global Investment Research
6. June will likely see not only the Fed but also the ECB, BoE, and BoC begin to cut rates. The latter three all look set to move faster than the Fed because they face not just slowing inflation but also varying degrees of economic weakness. Moreover, the risks for policy rates across all major DM economies (excluding Japan but including the US) are skewed to the downside. While we don’t expect meaningful labor market deterioration in our baseline, we can’t rule it out. History shows that it would only take a small rise in the unemployment rate to generate more aggressive cuts, especially from levels that are almost universally viewed as restrictive. To us, DM rates curves therefore look attractive after the selloff of the past two months, especially at the short end outside the US.
Exhibit 6: The ECB and BoE Are Likely to Cut More than Market Pricing
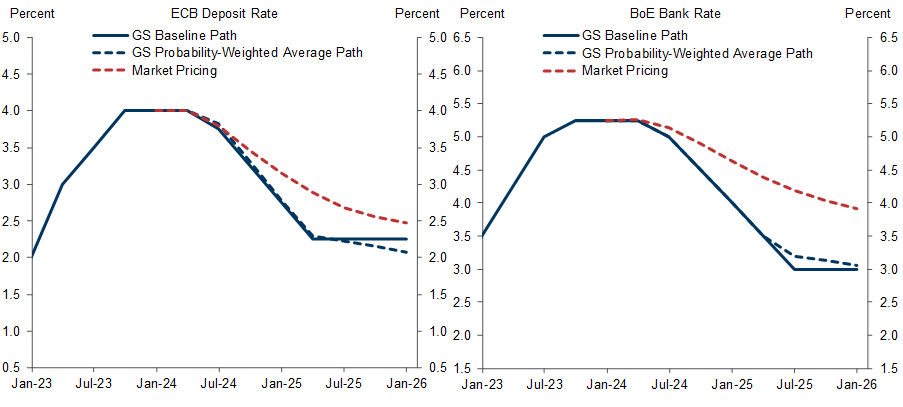
Source: Bloomberg, Goldman Sachs Global Investment Research
7. The shunto base pay increase of 3.7%—the strongest in over three decades—has probably sealed the deal for an end to both yield curve control and negative interest rates at the March 18-19 Bank of Japan meeting. But our longer-term view remains dovish. Real GDP contracted in 2023H2 and our tracking estimate is marginally negative for Q1; the monthly activity measures summarized in our Current Activity Indicator have softened since the turn of the year; and inflation ex food and energy is back below 2% on a 6-month annualized basis. We expect the overnight rate to stabilize at 0.5% in the medium term, below market pricing.
Exhibit 7: Softer Activity and Inflation Data Support Our Dovish Longer-Term BoJ View
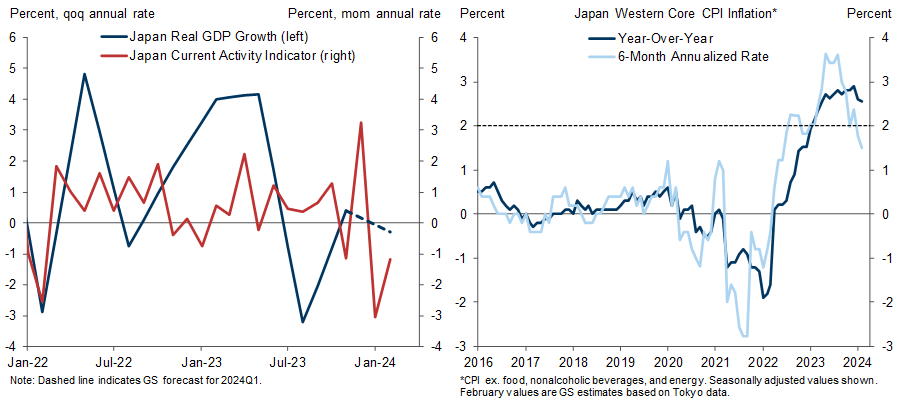
Source: Haver Analytics, Goldman Sachs Global Investment Research
8. The pickup in both headline and core inflation in China has reduced near-term deflation concerns, although it partly reflects one-off factors such as the temporary impact of record tourism activity and prices during the Lunar New Year holiday after three covid-affected years. A more genuine sign of strength is the pickup in industrial activity, which is consistent with China's big bet on manufactured exports and should help policymakers get close to the official GDP growth target of "around 5%" this year (we expect 4.8%). By contrast, the domestic economy remains sluggish. The housing and credit market signals in February have been negative, as new home price deflation quickened and credit growth came in below expectations despite a boost from “national team” buying in the stock market.
Exhibit 8: China's CPI Ticks Up; Auto Exports Surge
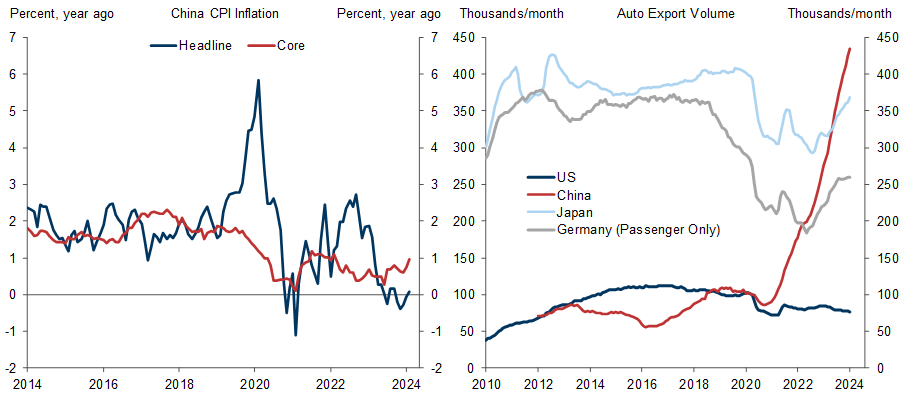
Source: Haver Analytics, CEIC, Goldman Sachs Global Investment Research
9. Global risk asset markets have remained resilient in the face of higher-than-expected inflation and reduced prospects for rate cuts. Under our economic forecast, this resilience is justified. Moreover, we think worries about the high degree of concentration in global equity markets—i.e. the increased weight of the US in global indices and the increased weight of the largest stocks in regional indices—are overblown. Nevertheless, our equity and credit strategists forecast relatively subdued near-term returns after the rally of the last six months, at least outside a few standout markets such as Japanese equities and US mortgages. Driven in part by our optimistic global growth view, our commodity strategists are more bullish, especially on industrial metals and to a lesser degree on oil.
Jan Hatzius
Investors should consider this report as only a single factor in making their investment decision. For Reg AC certification and other important disclosures, see the Disclosure Appendix, or go to www.gs.com/research/hedge.html.