Goldman Sachs Research
US Economics Analyst
Will Foreign Manufacturing Strength Boost US Growth and Inflation? (Hill/Rindels)
15 April 2024 | 11:16AM EDT | Research | Economics| By Jan Hatzius and others
More
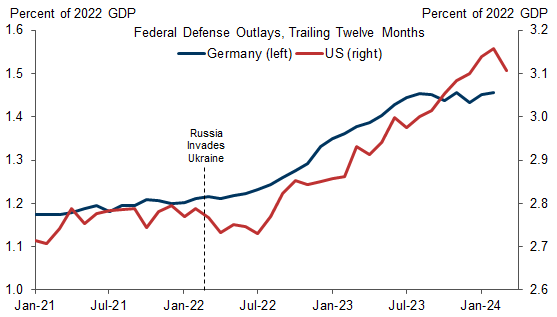
  • The global manufacturing cycle is picking up steam: foreign PMIs moved back above 50 in March, German industrial data has started to improve, and our China economists raised their GDP forecasts on the back of strong Q1 factory trends. This nascent rebound has multiple causes, including a waning drag from inventory drawdowns, the easing in global financial conditions, and increased spending on national defense. In this edition of the Analyst, we explore the implications of the foreign industrial pickup for US growth, employment, wage growth, and inflation.

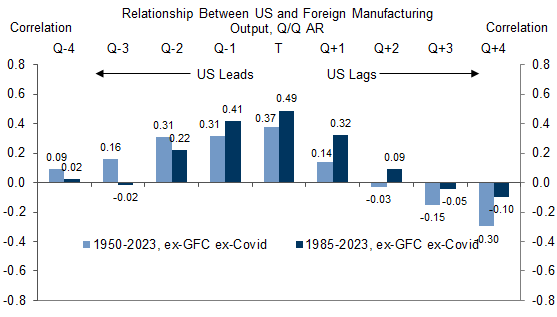
  • We construct time series of US and foreign industrial output over the last 75 years using quarterly manufacturing GDP in the US and the manufacturing subcomponent of industrial production across the G7 economies and 15 other countries. On this basis, US manufacturing output is currently rising at a fairly strong pace of 5.7% year-on-year, whereas the level of foreign factory output has picked up only marginally—up +0.3% year-on-year in Q1—after stagnating in 2022 and 2023. We also find that the two manufacturing series are positively but not perfectly correlated (correlations of +0.49 since 1985, qoq ar) and that the US manufacturing cycle tends to lead—though both series are influenced by shocks in the other.

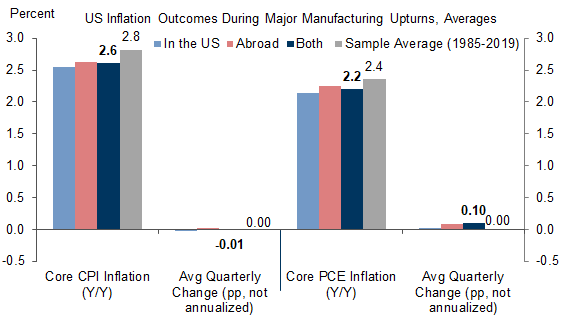
  • Unsurprisingly, we find that periods of strong US and foreign manufacturing growth are associated with strong US growth. Since 1985, US GDP growth has outpaced potential by 0.9pp in quarters with a synchronized major manufacturing upturn—defined as 5% or faster growth in US and foreign factory output. We find that the growth boost is roughly evenly split between inventories and final goods demand. The US labor market also tends to performs well, whereas the wage growth and inflation outcomes are inconsistent across episodes.

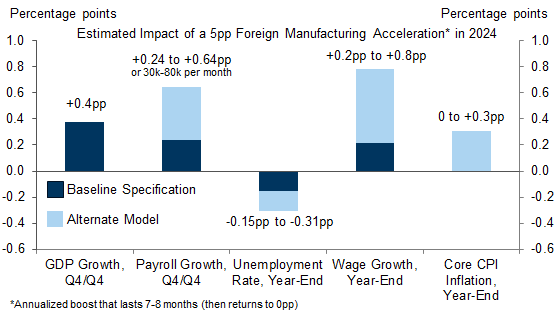
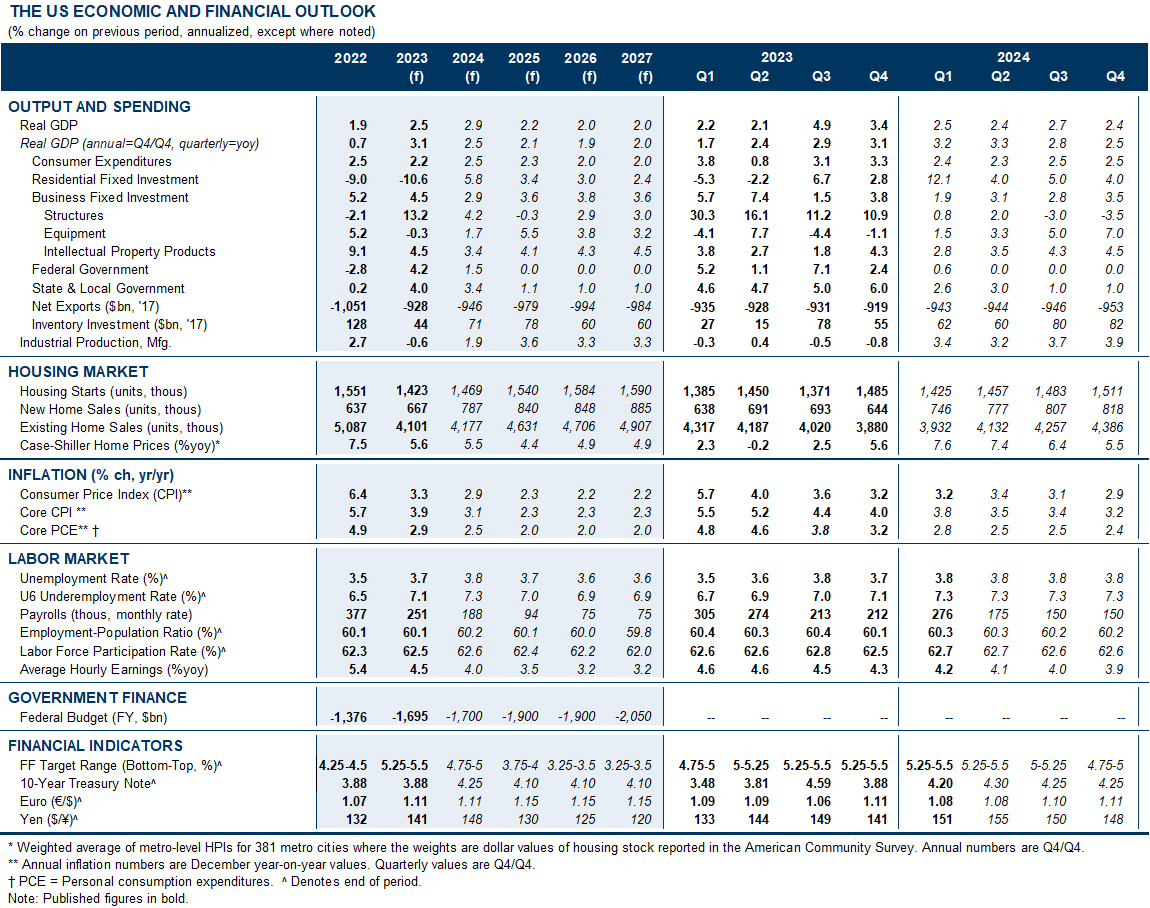
  • To estimate the causal effects, we model state-level economic outcomes—such as job growth or inflation—in a panel regression that exploits the variation in manufacturing GDP shares across states and across time. We also control for the state-level unemployment rate and for the trend in US manufacturing activity. Given the 10% GDP share of manufacturing in the US currently, we estimate that a “typical” rebound in global manufacturing activity would boost 2024 US GDP growth by 0.4pp (Q4/Q4 basis), boost nonfarm payroll growth by at least 30k per month, and would lower the unemployment rate by 0.15-0.3pp by year-end, other things equal. While such an acceleration abroad remains a risk rather than a baseline, these findings increase our conviction in our above-consensus GDP forecast for the year (+2.5% Q4/Q4 basis, vs. consensus +1.4%).

  • We estimate a more modest impact on 2024 wage growth, at +0.2pp under our preferred specification. The inflation effects are less straightforward, with an estimate range of zero to +0.3pp for year-end core CPI inflation (yoy). The mixed evidence on the inflation effects may reflect the tendency for periods of industrial strength to also exhibit above-average growth in manufacturing capacity. And for 2024 in particular, the continued labor supply tailwind from elevated immigration argues for a smaller-than-normal risk from wage growth or inflation spillovers.

Will Foreign Manufacturing Strength Boost US Growth and Inflation?

The global manufacturing cycle is picking up steam: foreign PMIs moved back above 50 in March (see Exhibit 1), Germany industrial data has started to improve, and our China economists raised their Q1 and full-year GDP forecasts on the back of strong Q1 factory trends. Additionally, Chinese export volumes jumped 20% year-on-year in the January-February period, and Korean goods exports—a bellwether indicator for global tech and industrial demand—have rebounded 8.4% since Q3 (nominal, not annualized) despite a late-March pullback. US manufacturing activity has also bottomed (manufacturing GDP +3.5% year-over-year in Q4, manufacturing industrial production +0.1% over the last three months) and appears likely to rise this spring.

Exhibit 1: Foreign Manufacturing PMIs Have Moved Back Into Expansionary Territory, On Net

1. Foreign Manufacturing PMIs Have Moved Back Into Expansionary Territory, On Net. Data available on request.
Source: S&P Markit, Goldman Sachs Global Investment Research
The nascent rebound has multiple causes, including a waning drag from inventory drawdowns after they became bloated in 2022 in a hangover from the pandemic goods demand boom. As shown in the left panel of Exhibit 2, inventory ratios are nearly back to normal in the US and they have partially normalized in East Asia where the consumer goods and technology inventory overhang was particularly severe. The easing in financial conditions over the last 6 months has also supported factory activity and consumer demand (Global FCI ex-Russia -0.65pt from the peak, see right panel).

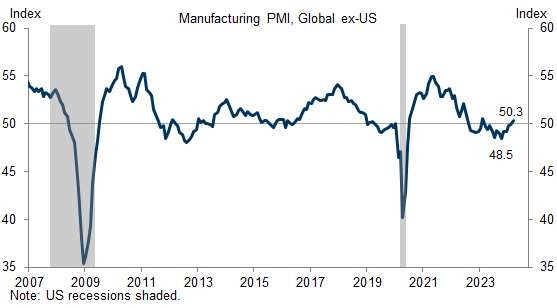
Exhibit 2: Leaner Inventories and Easier Financial Conditions Are Contributing to a Rebound in Global Manufacturing Activity

2. Leaner Inventories and Easier Financial Conditions Are Contributing to a Rebound in Global Manufacturing Activity. Data available on request.
Source: Bureau of Economic Analysis, Goldman Sachs Global Investment Research
Rising national defense budgets (see Exhibit 3) and the related increase in arms and ammunition production and exports are also boosting industrial demand in some industries and countries.

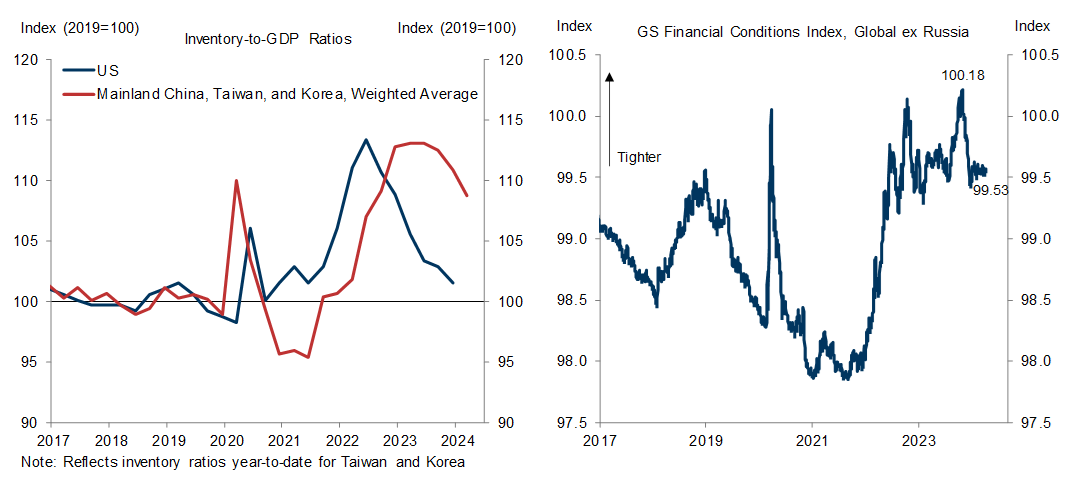
Exhibit 3: Rising Defense Spending Another Likely Contributor

3. Rising Defense Spending Another Likely Contributor. Data available on request.
Source: U.S. Treasury, Goldman Sachs Global Investment Research
In this edition of the Analyst, we explore the implications of the industrial inflection abroad for US growth, employment, wage growth, and inflation.

US and Global Manufacturing Cycles

To analyze the impact of the global industrial cycle on the US economy, we first construct time series of US and of foreign industrial output over the last 75 years (see Exhibit 4). For the US measure, we use real value added (GDP) of the manufacturing sector.[1] Because of limited availability of GDP by industry data in foreign economies, we construct the foreign measure from industrial production statistics—specifically the manufacturing subcomponents where available. We aggregate these data across the foreign G7 economies as well as 15 others[2] that together account for 84% of US exports in 2023. We weight the index based on US exports over the trailing three years, because we are ultimately interested in the spillovers to the US economy.[3]
On this basis, US manufacturing output is currently rising at a fairly strong pace of 5.7% year-on-year, whereas the level of foreign factory output has picked up only marginally—up +0.3% year-on-year in Q1—after stagnating in 2022 and 2023.[4]

Exhibit 4: A Synchronized Global Upturn? Foreign Manufacturing Growth May Converge Up Towards the US Pace

4. A Synchronized Global Upturn? Foreign Manufacturing Growth May Converge Up Towards the US Pace. Data available on request.
Source: Bureau of Economic Analysis, Goldman Sachs Global Investment Research
As shown in Exhibit 5, the two manufacturing series are positively but not perfectly correlated, with quarterly correlations of +0.49 since 1985 and +0.37 since 1950 (qoq ar). Consistent with conventional window, we find that the US manufacturing cycle on average tends to lead the foreign cycle by 0-2 quarters. However in some instances the foreign cycle leads, and when we test for causality we find that both series are influenced by shocks in the other.[5]

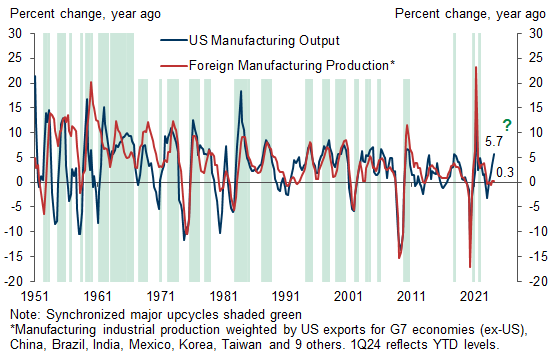
Exhibit 5: The US and Foreign Manufacturing Cycles Are Positively Correlated; The US Cycle Tends to Lead but Only at the Margin

5. The US and Foreign Manufacturing Cycles Are Positively Correlated; The US Cycle Tends to Lead but Only at the Margin. Data available on request.
Source: Goldman Sachs Global Investment Research
To gauge the historical performance of the US economy during periods of strong global manufacturing activity, we first classify US industrial recessions and their foreign counterparts using the well-known “two-quarter” rule.[6] We then divide the remaining observations into below-average and above-average expansions: the latter reflects quarters with manufacturing output growth above 5.1% in the US and above 5.2% abroad (on either a qoq or yoy basis). These periods represent major manufacturing upturns in the respective economies—and in some cases manufacturing booms. Periods with above-average growth in both US and foreign factory output—or synchronized major manufacturing upturns—are shaded green in Exhibit 4 above. These include the post-war manufacturing booms of the 1950s and 1960s, as well as the sharp industrial rebounds of 2010 and late 2020. Since 1985, there have been 13 instances of synchronized above-average factory growth, and on average they persist for 2.5 quarters (range of 1-6 quarters).

Historical Performance of the US Economy During Manufacturing Booms

Unsurprisingly, the broader US economy tends to exhibit strong growth during major manufacturing upturns—whether they are occurring in the US, abroad, or in both (see Exhibit 6). Since 1985, US GDP growth has averaged 4.0% and has outpaced potential[7] by 0.9pp in quarters with a synchronized major manufacturing upturn (based on the classification in the previous section). This reflects above-normal average growth in business fixed investment (+7.5% annualized), exports (+11.3%), and inventories, and the GDP growth boost is roughly evenly split within the goods sector between inventories (+0.6pp on average) and final demand (+0.7pp).[8]

Exhibit 6: GDP Growth Tends to Be Strong When the Manufacturing Is Expanding

6. GDP Growth Tends to Be Strong When the Manufacturing Is Expanding. Data available on request.
Source: Bureau of Economic Analysis, Congressional Budget Office, US Bureau of Labor Statistics, Goldman Sachs Global Investment Research
While these averages are illustrative of what to expect during a manufacturing boom, the causality runs in multiple directions: Other things equal, strong US demand boosts foreign manufacturing activity, which in turns boosts US manufacturing and US final demand. We assess the causal impact in the next section.
As shown in Exhibit 7, we find that the US labor market historically performs well during major manufacturing upturns, with nonfarm payroll growth averaging 205k per month (74k above average) in synchronized episodes. We find that only a minority of this strength reflects manufacturing payrolls specifically (5k monthly average pace, +16k above the sample average), suggesting a significant role for growth spillovers, reverse causality, or both.[9] The unemployment rate also tends to decline during these periods, by 0.12pp on average (or 0.10pp more than usual). This implies a 0.3pp cumulative drop in the unemployment rate during a synchronized major factory upturn of average duration (2.5 quarters).

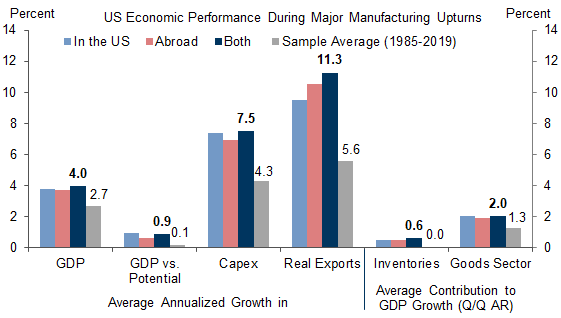
Exhibit 7: Job Growth Also Tends to be Strong and Unemployment Tends to Edge Lower; Wage Growth Effects Appear Modest On Average

7. Job Growth Also Tends to be Strong and Unemployment Tends to Edge Lower; Wage Growth Effects Appear Modest On Average. Data available on request.
Source: Bureau of Economic Analysis, Congressional Budget Office, US Bureau of Labor Statistics, Goldman Sachs Global Investment Research
The boost to wage growth appears more modest on average, with our GS wage tracker picking up by just 2bp per quarter and manufacturing wage growth picking up by 6bp per quarter during these episodes (see final two sets of columns).
We also found mixed inflation performance on average during these episodes, with both core CPI and core PCE inflation tending to run 0.2pp below average (at 2.6% and 2.2%) on averages in a synchronized major upturn. We find no clear direction in the CPI measure during these periods (on average year-on-year core CPI inflation falls by 1bp per quarter), but we find that core PCE inflation has historically risen on average by 10bp per quarter.[10] Given the multiple of factors determining inflation, we place more weight on our regression results in the following section.

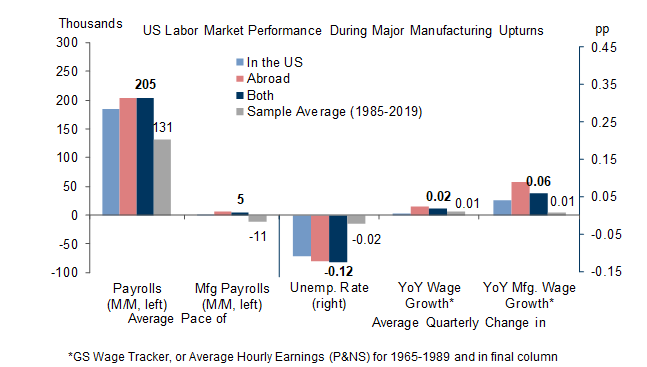
Exhibit 8: Core Inflation Tends to Be Somewhat Lower, though the Core PCE Measure Has Historically Drifted Upwards

8. Core Inflation Tends to Be Somewhat Lower, though the Core PCE Measure Has Historically Drifted Upwards. Data available on request.
Source: US Bureau of Labor Statistics, Bureau of Economic Analysis, Goldman Sachs Global Investment Research

The Impact of the Foreign Factory Rebound on the US Economy

To estimate the causal effect of foreign manufacturing activity on the US economy, we exploit the significant variation in manufacturing GDP shares across states and across time—the assumption being that states whose economies are more dependent on manufacturing in a given period should be disproportionately impacted by inflections in foreign manufacturing trends. Exhibit 9, shows that manufacturing GDP shares range from 2% to 26% currently—and 10.2% nationwide—but approached 50% in some states earlier in the sample.

Exhibit 9: Wide Variation in Manufacturing GDP Shares Across States and Across Time

9. Wide Variation in Manufacturing GDP Shares Across States and Across Time. Data available on request.
Source: Bureau of Economic Analysis, Goldman Sachs Global Investment Research
Accordingly, we model state-level economic outcomes—such as job growth or inflation—in a panel regression that allows the sensitivity to foreign manufacturing of a given state to vary based on its manufacturing GDP share at any given time. We also control for the state-level unemployment rate and for the trend in US manufacturing activity (including an interaction term—states with large manufacturing bases should also be disproportionately affected when the US industrial cycle rebounds).[11]
Exhibit 10 plots the resulting estimated effects of a 5pp acceleration—or one-standard deviation—in global manufacturing activity growth (qoq ar) that lasts for 2-3 quarters.[12] Given the current manufacturing intensity of the US economy (10.2% of GDP), we estimate that a typical rebound in global manufacturing activity would boost 2024 US GDP growth by 0.4pp (Q4/Q4 basis), boost nonfarm payroll growth by roughly 30k per months—and potentially as much at 80k per month—and lower the unemployment rate by 0.15pp-0.3pp by year-end, other things equal. The ranges reflect uncertainty around the contemporaneous coefficients due to endogeneity (e.g. Is foreign activity boosting US job growth, or is US job growth boosting foreign activity?).[13]

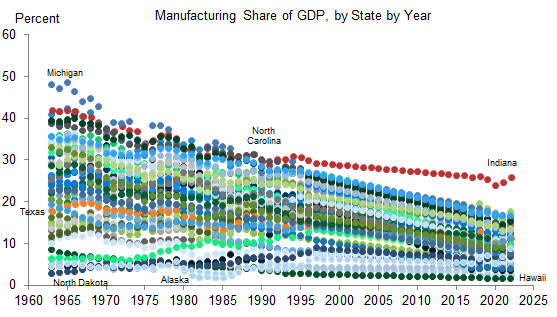
Exhibit 10: A Major Foreign Manufacturing Upturn Would Boost GDP, Employment, and (to a Lesser Extent) Wage Growth

10. A Major Foreign Manufacturing Upturn Would Boost GDP, Employment, and (to a Lesser Extent) Wage Growth. Data available on request.
Source: Goldman Sachs Global Investment Research
For wage growth, we estimate a direct boost to average hourly earnings growth from a major foreign manufacturing upturn worth +0.2pp by year-end—and potentially as much as 0.8pp (though we also obtain an impact of zero in some specifications).
The inflation effects are less straightforward, with an estimated range of 0.0-0.3pp for year-end core CPI inflation (yoy; we cannot test core PCE inflation in this model due to its lack of regional granularity). In some specifications we find zero impact, because in those regressions we find that the direct inflation effects of global factory activity depend solely on domestic manufacturing trends.[14] The mixed evidence on the inflation effects may in part reflect the tendency for periods of industrial output strength to also exhibit an expansion in manufacturing capacity: we find a +2.9% average annualized pace in these episodes since 1985, 1.2pp above average (based on manufacturing capacity in the industrial production statistics). Such a supply tailwind would limit any upward pressure on goods prices from strong consumer demand (to the extent that that generated the manufacturing upcycle in the first place).

Implications for the US Outlook

The rising probability of strong growth in foreign manufacturing activity increases our conviction in our above-consensus US growth forecast for the year: +2.5% on a Q4/Q4 basis, compared to consensus of +1.4%. We also note the possibility of upside to our forecast in the event that the magnitude of foreign manufacturing reacceleration approaches or exceeds 5pp (not our base case). In that outcome, the decline in wage growth could be somewhat less pronounced than we currently forecast (3.5% sequentially by year-end).
Our results caution against expecting a significant impact on core inflation from rebounding foreign factory activity unless we see evidence that strong growth more generally begins to reverse the progress achieved on labor market rebalancing. Fortunately, the continued labor supply tailwind from elevated immigration argues for a smaller-than-usual risk of such an outcome.

Spencer Hill

Jessica Rindels

Appendix

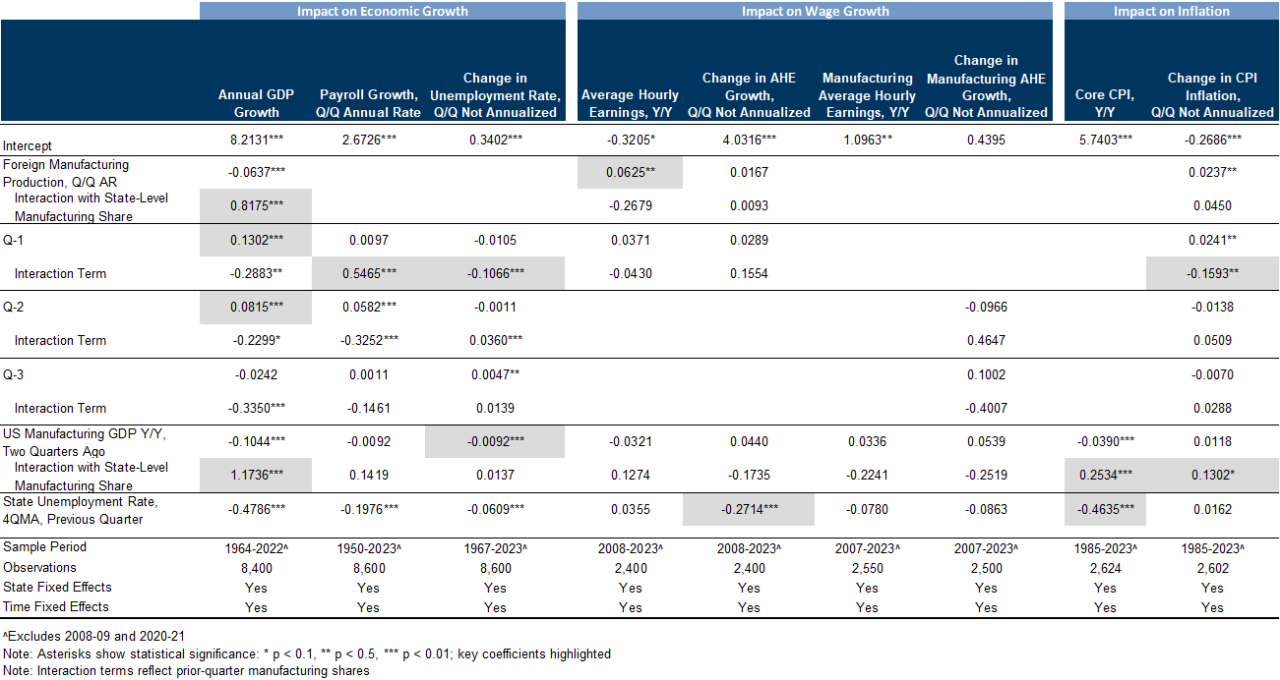
Exhibit 11: Impact of Foreign Manufacturing Activity on Economic Performance in the State-Level Cross-Section

11. Impact of Foreign Manufacturing Activity on Economic Performance in the State-Level Cross-Section. Data available on request.

The US Economic and Financial Outlook

Data available on request.
Source: Goldman Sachs Global Investment Research
  1. 1 ^ For years in which quarterly data is unavailable, we interpolate annual manufacturing GDP using the manufacturing subcomponent of US industrial production.
  2. 2 ^ Mainland China, Brazil, India, Singapore, South Korea, Taiwan, Norway, Switzerland, Turkey, Mexico, Chile, Australia, New Zealand, South Africa, and Israel. For missing manufacturing production observations since 1980, we assume the growth rate of the world ex-US industrial production index produced by the Dallas Fed. For missing observations before 1980, we assume the manufacturing production growth rate across the UK, Germany, France, and Japan (weighted average; also includes mining production for the latter three countries).
  3. 3 ^ We apply fixed weights before 1976 due to data limitations.
  4. 4 ^ 2024 industrial production data for most countries is available for January and February but not for March.
  5. 5 ^ Granger causality test p-values of 0.001 on “foreign causes US” and 0.054 on “US causes foreign.”
  6. 6 ^ Specifically, we assume a downturn occurs whenever there are two consecutive quarters of negative quarter-on-quarter or year-on-year manufacturing output growth. We also assume that expansions must last most than one quarter—else the downturn continues. For example, on this basis, the US had a five-quarter manufacturing downturn from 1Q22 through 1Q23, as opposed to two separate two-quarter contractions interrupted by a one-quarter expansion in 3Q22.
  7. 7 ^ CBO measure.
  8. 8 ^ US GDP strength is even more outsized over the full sample (1950-2019), with GDP growth 1.9pp above potential, on average.
  9. 9 ^ The full sample period exhibits further strength in manufacturing payroll growth (39k on average, 41k above normal) and the unemployment rate (-0.17pp average quarterly decline).
  10. 10 ^ Over the full sample, both measures tend to rise at a marginal pace (of 5bp per quarter for core CPI inflation and 6bp per quarter for core PCE inflation).
  11. 11 ^ We allow for up to three quarterly lags on foreign manufacturing growth (qoq ar) and its interaction term, we include time and state fixed effects in each specification, and we exclude 2008-09 and 2020-21 because the Lehman and Covid shocks likely dwarfed the impact of exogenous changes in foreign factory activity in those quarters. We drop contemporaneous variables with negative (and likely spurious) coefficients, negative coefficients on the wage growth and inflation variables in their "levels" specifications, and several statistically insignificant variables with counterintuitive signs.
  12. 12 ^ Or 7-8 months. This is the average duration of synchronized major manufacturing upcycles as discussed in the previous sections (the US is already in a major upcycle, according to the classification criteria.)
  13. 13 ^ Indeed, the implausibly high payroll sensitivity in some specifications likely reflects reverse causality—strong US jobs growth tends to encourage stronger factory output abroad via the expected demand channel, and US job growth also correlates with other factors that likely encourage the same (e,g, US retail sales growth, financial conditions, business demand for capex, inventories, and intermediate inputs).
  14. 14 ^ On the other hand, because we are controlling for the unemployment rate in the prior period, inflation could receive a second-round boost from faster job growth—this would be additive to the above estimates.

Investors should consider this report as only a single factor in making their investment decision. For Reg AC certification and other important disclosures, see the Disclosure Appendix, or go to www.gs.com/research/hedge.html.