Goldman Sachs Research
Japan Strategy Views
Thoughts on TOPIX P/E range after recent rally
Table of Contents
16 July 2024 | 2:12PM JST | Research | Portfolio Strategy| By Kazunori Tatebe, CFA and others
More
After a lackluster performance up to the third week of June, Japanese stocks have been making strong gains since the last week of June. This sharp rise in share prices was a bit of surprise to us, as the rise occurred earlier than we expected given we believed that an improvement in the macro environment would be necessary for Japanese stocks to break out of their recent range and see a sustained rise. We think initial price moves were mainly led by positioning and technical factors, but probably medium-term general positive views on Japanese stocks are also an underlying factor. It also appears that the market front-loaded some of the positive catalysts ahead.
We revise our TOPIX earnings forecasts. Our new forecasts call for EPS growth of +10%/+9%/+7% in FY2024-FY2026, and the cumulative 29% growth over the next three years should underpin the Japan market's move higher.
The TOPIX has now reached the upper end of our assumed P/E range of 15.0-15.5X. Given the backdrop of the recent rally, described above, further upside may be limited in the near-term until there is more evidence of a shift in fundamentals that we expect in 2H. While we do not expect a major correction, we note uncertainties around political events in Japan and the US, as well as weak upcoming seasonality, which warrant caution.
In our view, additional positive developments that could drive further upward shift of the P/E range include a stronger virtuous cycle between wages and prices with an upgrade in the domestic economic outlook, a reversal of the weak yen trend, progress in corporate governance, and further participation by individual investors.

1. TOPIX/Nikkei break out

TOPIX closed at 2,772 at the end of May and 2,810 at the end of June, roughly in line with our 3-month forward TOPIX target of 2,800 as of our March 1 and April 1 reports. Japanese stock performance was lackluster until the third week of June, but sharp gains since the last week of June have been attracting attention. On July 4, TOPIX reached a new all-time high, surpassing the previous record set 34 years ago.
We thought that a recovery in domestic demand and an improvement in the macro environment would be necessary for Japanese stocks to break out of their range and see a sustained rise. We also highlighted that 1Q earnings could be a catalyst. The recent earlier-than-expected sudden rise in share prices therefore came as a bit of a surprise to us.
We think initial price moves were mainly led by positioning and technical factors without any notable changes in fundamentals, but probably medium-term general positive views on Japanese stocks are also an underlying factor. It also appears that the market front-loaded some of the positive catalysts ahead, such as an expected solid 1Q earnings and a recovery in real wages/domestic consumption in the summer.

Exhibit 1: The Nikkei 225 and TOPIX have broken out of their recent ranges

1. The Nikkei 225 and TOPIX have broken out of their recent ranges. Data available on request.
Source: Bloomberg

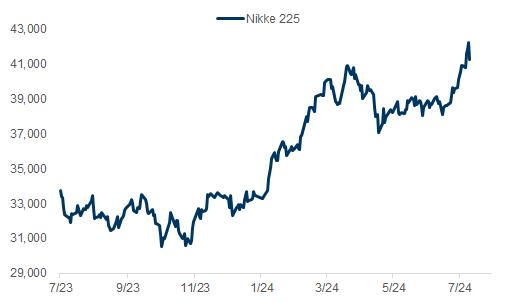
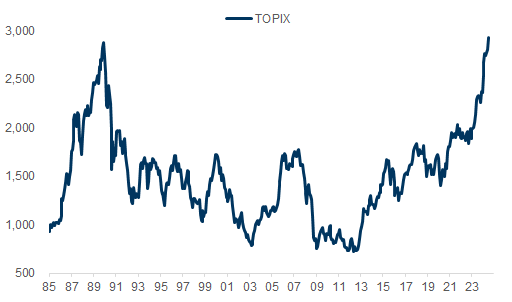
Exhibit 2: Following the Nikkei's move beyond its bubble-era high in February, TOPIX has now also exceeded its bubble-era high

2. Following the Nikkei's move beyond its bubble-era high in February, TOPIX has now also exceeded its bubble-era high. Data available on request.
Source: Bloomberg

2. Raising our TOPIX EPS forecasts

We revise our TOPIX earnings forecasts to reflect the stronger-than-expected 4Q3/24 results, changes to our forex assumptions (USD/JPY to ¥155/¥150 from ¥150/¥145 for FY2024/25), and our economists' latest macro assumptions. Our new forecasts call for EPS growth of +10%/+9%/+7% in FY2024-FY2026, cumulative 29% growth over the next three years, following the 18% growth seen in FY2023. In addition to the weaker yen on the currency markets, we think the inflationary environment in Japan will boost earnings.
The TOPIX earnings revision index had been on a downward trend in April-May due to cautious guidance issued at the beginning of the fiscal year, but started to rebound and rise in June, as consensus earnings forecasts are moving upward.

Exhibit 3: TOPIX earnings forecast: We estimate 29% EPS growth over the next three years, following 18% growth in FY2023

3. TOPIX earnings forecast: We estimate 29% EPS growth over the next three years, following 18% growth in FY2023. Data available on request.
Our FY2024-FY2026 USD/JPY assumptions are ¥155/¥150/¥150
Source: Goldman Sachs Global Investment Research

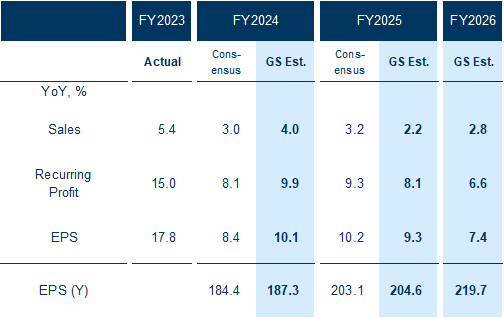
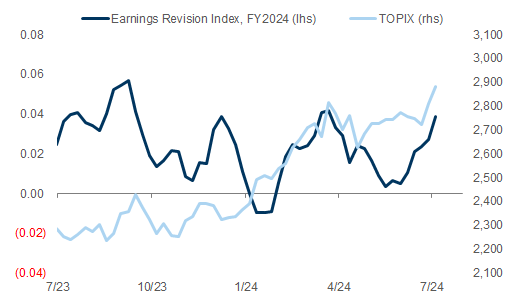
Exhibit 4: Japanese companies' earnings forecasts have been revised upward recently

4. Japanese companies' earnings forecasts have been revised upward recently. Data available on request.
Source: I/B/E/S, FactSet, Data compiled by Goldman Sachs Global Investment Research

3. Correlation between JPY weakness and Japanese stocks is back

One of the notable developments in the Japanese stock market in 2Q was the breakdown of the correlation between forex and Japanese stocks, with the weaker yen no longer providing a tailwind for Japanese equities. However, we note with interest that the correlation between the weaker yen and higher Japanese share prices seems to have returned from late June. Nevertheless, we are skeptical about whether it will continue. If the yen weakens further from the current level, we think the side effects could become more pronounced and yen weakness may not be seen as a positive.
Our sensitivity analysis shows that a ¥10 depreciation of the yen would increase profits by 3.5%, but we think the benefits of further yen depreciation from this level are likely to be smaller than our sensitivity analysis suggests, due to the increasing negative impact on real disposable income and domestic consumption. On the side note, if the virtuous cycle between wages and prices strengthens and the pace of yen depreciation is moderate, then the emergence of side effects could be delayed.
The weaker yen trend could stop or reverse due to weaker US growth/inflation data and rising expectations for US rate cuts. If the trend were to shift to moderate yen appreciation, we believe it would create a more favorable environment for long-term investors who do not hedge their currency exposure to invest in Japanese equities. The recent buying of Japanese stocks may also reflect in part the somewhat weaker US economic data.

Exhibit 5: The correlation between the weaker yen and higher share prices, which had broken down in 2Q, returned from late June

5. The correlation between the weaker yen and higher share prices, which had broken down in 2Q, returned from late June. Data available on request.
Source: MSCI, Bloomberg

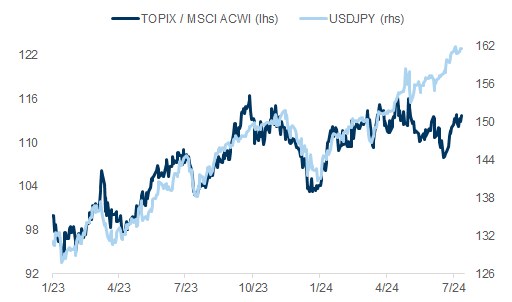
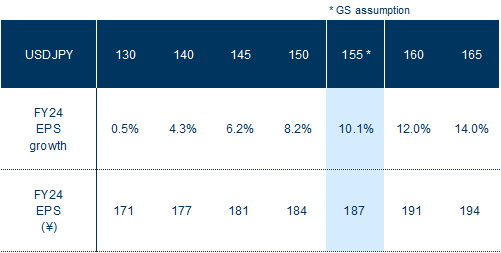
Exhibit 6: Our sensitivity analysis shows that a 10-yen depreciation/appreciation of the yen would increase/decrease profits by 3.5%, but the benefits of yen depreciation are likely to be smaller due to the increasing side effects

6. Our sensitivity analysis shows that a 10-yen depreciation/appreciation of the yen would increase/decrease profits by 3.5%, but the benefits of yen depreciation are likely to be smaller due to the increasing side effects. Data available on request.
Source: Goldman Sachs Global Investment Research

4. Positive micro developments

While the sharp rise in Japanese stocks since late June has been attracting attention, we would also highlight the positive micro developments that were seen during the preceding period of weakness.
  • Share buyback announcements remained brisk after increasing sharply in April-May, with Recruit announcing a ¥600 bn buyback program this month, bringing the overall total for the year to over ¥10 tn, which already exceeds last year's level.

  • AGMs have become more live, with the percentage of votes supporting CEO/director nominations fluctuating significantly depending on how management's performance is viewed. Since the unwinding of cross-shareholdings will reduce the number of stable shareholders, we think shareholder meetings could become even more lively going forward. We plan to look at AGMs in more detail in a future report.

  • TOPIX review (new rules for TOPIX constituents): The Tokyo Stock Exchange has announced new rules related to the forthcoming TOPIX review. The number of constituent companies is expected to decline to about 1,200, increasing pressure on companies to achieve profit growth and valuation expansion.

Exhibit 7: AGM approval ratings

6M ADTV > $20mn
7. AGM approval ratings. Data available on request.
Source: Company data, Data compiled by Goldman Sachs Global Investment Research

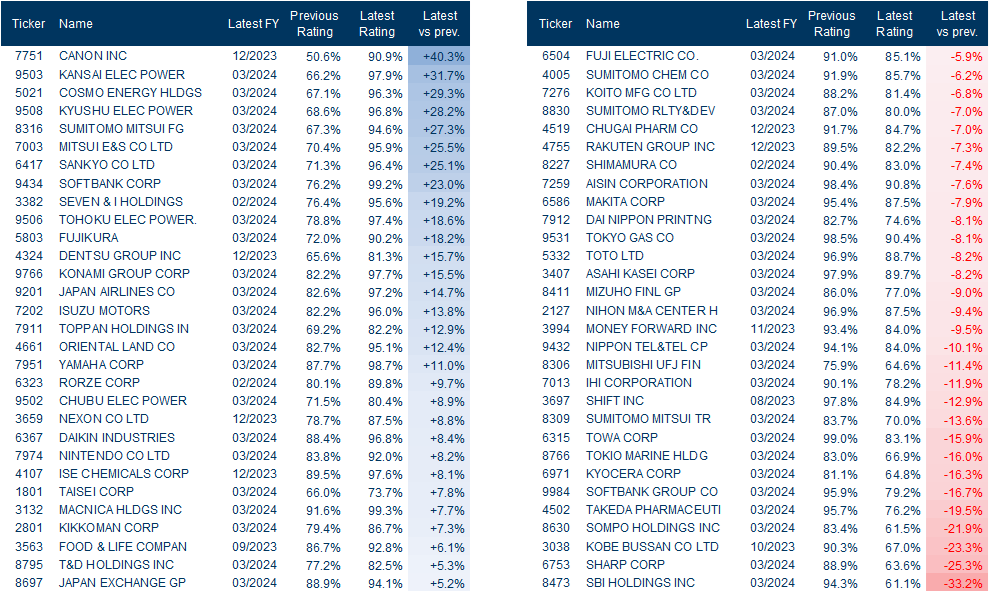
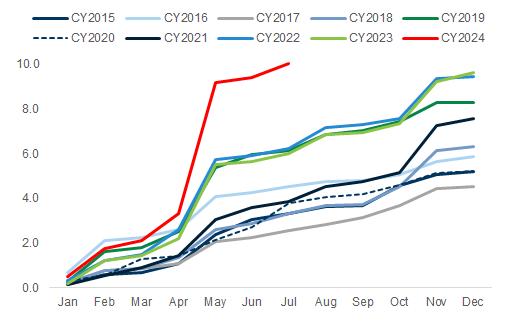
Exhibit 8: Announced share buybacks have already exceeded last year's record level

JPY tn
8. Announced share buybacks have already exceeded last year's record level. Data available on request.
Source: QUICK, Data compiled by Goldman Sachs Global Investment Research

5. Thoughts on TOPIX P/E range

The TOPIX has now reached the upper end of our assumed P/E range of 15.0-15.5X. This is also the P/E level at which the index peaked in late March. Given the backdrop of the recent rally, described above, further upside may be limited in the near term until there is more evidence of a shift in fundamentals that we expect in 2H, including solid 1Q earnings and evidence of a strengthening recovery in domestic demand. While we do not expect a major correction, we note uncertainties around political events in Japan and the US, as well as weak upcoming seasonality, which warrant caution.
In our view, additional positive developments that could drive further upward shift of the P/E range include a stronger virtuous cycle between wages and prices with an upgrade in the domestic economic outlook, a reversal of the weak yen trend, progress in corporate governance, and further participation by individual investors. If the TOPIX were to break out of its current range, we think the Abenomics peak of 16.3X (May 2015) would be investors next focus.

Exhibit 9: TOPIX has reached the upper end of our assumed P/E range (15.0-15.5x)

9. TOPIX has reached the upper end of our assumed P/E range (15.0-15.5x). Data available on request.
Source: FactSet, Data compiled by Goldman Sachs Global Investment Research

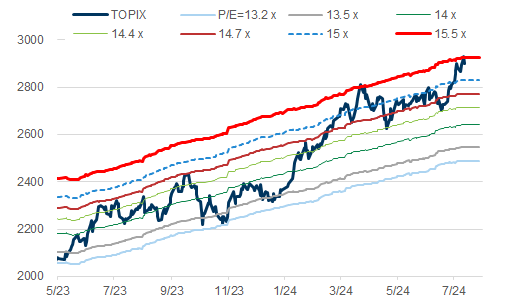
Exhibit 10: Excluding the initial overshoot, the peak P/E during Abenomics was 16.3x

10. Excluding the initial overshoot, the peak P/E during Abenomics was 16.3x. Data available on request.
Source: FactSet, Data compiled by Goldman Sachs Global Investment Research

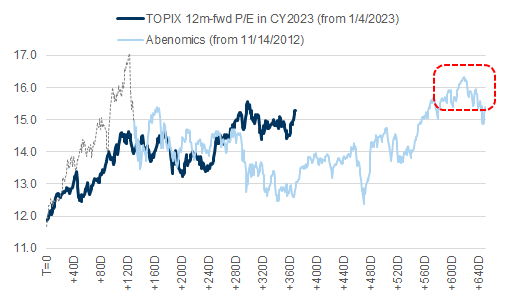
Exhibit 11: 3m and 12m forward TOPIX levels based on USD/JPY and P/E levels

11. 3m and 12m forward TOPIX levels based on USD/JPY and P/E levels. Data available on request.
Source: Goldman Sachs Global Investment Research

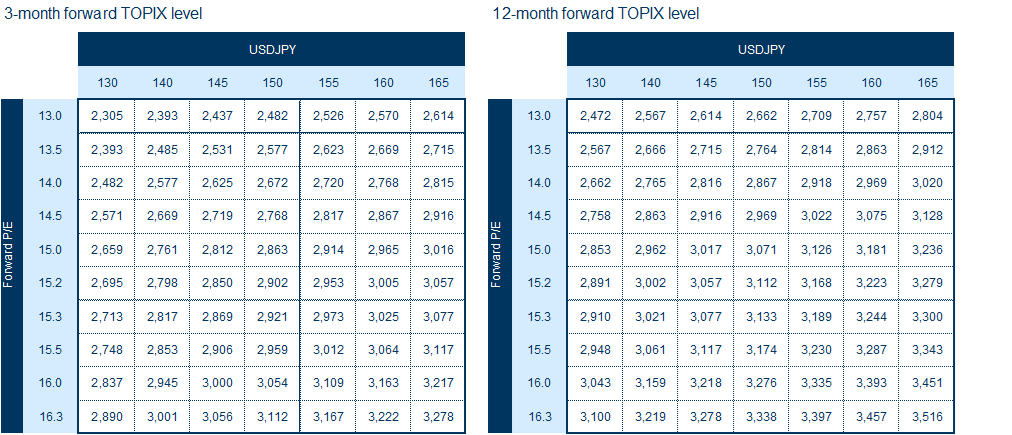
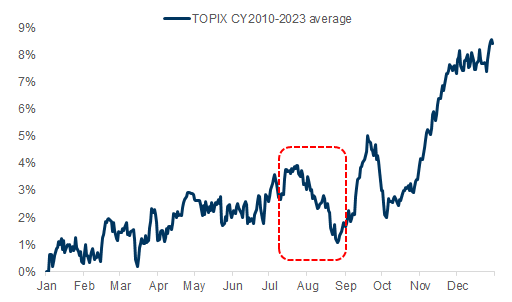
Exhibit 12: Weak seasonality ahead

12. Weak seasonality ahead. Data available on request.
Source: Bloomberg, Data compiled by Goldman Sachs Global Investment Research

Investors should consider this report as only a single factor in making their investment decision. For Reg AC certification and other important disclosures, see the Disclosure Appendix, or go to www.gs.com/research/hedge.html.