Goldman Sachs Research
GOAL: Global Opportunity Asset Locator
2H Outlook: Shifting neutral into the summer but we remain mildly pro-risk for 12m
  • Global growth slowed in Q2 but risky assets performed well, helped by expectations for central bank easing and mega cap tech optimism. Our macro baseline view for 2H remains friendly with a small pick-up in growth, further inflation normalisation and central bank cuts. We continue to think we are in an early late-cycle backdrop, which could last considering a healthy private sector, and as a result both recession and bear market risk have been low.

  • However, after a strong rally in equities in 1H we see risk of a setback in the summer due to the combination of weaker growth data, already more dovish central bank expectations and rising policy uncertainty into the US elections. As a result, we shift Neutral across assets on a 3-month horizon. We remain mildly pro-risk for 12m with an OW equities/commodities, N bonds/cash, UW credit.

  • So far 'bad news' has been 'good news' for equities and risky assets more broadly, with more expectations of central bank easing. Fed easing cycles have been generally positive for equities as long as growth was good. But 'bad news' could become 'bad news' if there is less of a buffer from monetary policy or 'bad news' becomes too bad. A much weaker global growth backdrop, disappointing Q2 earnings season and rising US policy uncertainty can weigh on risk appetite.

  • Still, we see more risk of a correction rather than a bear market for 2H. Only when our cycle growth score shifted below zero, which has historically been mostly around recessions, did equities have drawdowns in excess of 20%. With only some growth slowdown, a healthy private sector and a buffer from central bank easing, equity drawdown risk should be limited.

  • While we do not see much equity valuation expansion from here in our base case, central bank cuts, continued AI optimism and a potential growth re-acceleration in 2H could support multiples, especially for laggards. Credit valuations are a more binding constraint and we think the sector composition is worse than for equities due to a larger weight in leveraged cyclical/value sectors.

  • We think the equity/bond correlation will be less positive with continued inflation normalisation and bonds should buffer severe growth shocks. For additional diversification in a late-cycle backdrop and with rising policy uncertainty, we remain OW commodities on a 12m horizon and we recommend selective option overlays.

2H Outlook: Shifting neutral into the summer but we remain mildly pro-risk for 12m

1. Global growth slowed in Q2 but risky assets performed well, helped by expectations for central bank easing and mega cap tech optimism. Our macro baseline view for 2H remains friendly with a small pick-up in growth, further inflation normalisation and central bank cuts. We continue to think we are in an early late-cycle backdrop, which could last a long time considering a healthy private sector, and as a result both recession and bear market risk have been low. However, after a strong rally in equities in 1H we see risk of a setback in the summer due to the combination of weaker growth data, already more dovish central bank expectations and rising policy uncertainty into the US elections. As a result, we shift Neutral across assets on a 3-month horizon. We remain mildly pro-risk for 12m with an OW equities/commodities, N bonds/cash, UW credit.
During late-cycle backdrops equities can still deliver attractive returns, often supported by valuation expansion, and in part this is what happened in 1H. While we do not see much equity valuation expansion from here in our base case, central bank cuts coupled with continued AI optimism and a potential growth re-acceleration in 2H could support multiples, especially for laggards. Credit valuations are a more binding constraint and we think the sector composition is worse here than for equities due to a larger weight in leveraged cyclical/value sectors. We think the equity/bond correlation will be less positive with continued inflation normalisation and bonds could buffer severe growth shocks. However, in our base case we do not see material declines in long-dated bond yields into year-end. For additional diversification in a late-cycle backdrop and with rising policy uncertainty going into the US elections, we remain OW commodities on a 12m horizon.

Exhibit 1: We remain modestly pro-risk over 12m but are shifting N for 3m

1. We remain modestly pro-risk over 12m but are shifting N for 3m. Data available on request.
Source: Goldman Sachs Global Investment Research
We remain OW equities for 12m, shift N for 3m. In our baseline view, we expect modest returns driven mostly by earnings growth rather than valuation expansion. With elevated profit margins, we forecast single-digit earnings growth in all regions other than Asia, where earnings are recovering from a low base. However, we think equities offer better asymmetry than credit late cycle, with less downside convexity and more upside potential. Equity valuations are elevated and have expanded YTD, especially in the US, increasing the risk of a near-term correction. However, valuations are less of a binding constraint for returns and can overshoot late cycle, especially with falling rates. Corporate sector balance sheets are also strong, leaving potential for releveraging, shareholder returns and restructuring. After a strong rally YTD and with weaker growth and a high bar to beat in the Q2 earnings season, as well as rising policy uncertainty into the US elections, we shift N equities for 3m. We continue to see potential benefits from international diversification and remain Neutral across regions.
We remain Neutral bonds for 3m and 12m. After the recent rally we think US 10-year yields will be rangebound in 2H with 4.25% becoming a midpoint of the range. Broadly, we still have a bias for steeper yield curves with impending central bank cutting cycles, potential for term premium rebuild and fiscal policy uncertainty in the run-up to the US elections, but high negative carry is challenging. Our rates team thinks the Fed cutting cycle is well priced now and that clearer growth weakness is required for further cuts to be priced – in that case, front-end rates would lead the curve lower and there could be steepening into 2s5s. They also think the ECB cutting cycle might be underpriced, especially in 2025, and continue to have a long bias at the front end of the curve in Europe: they maintain their year-end 10-year Bund yield forecast at 2.25%. While we expect some OAT relief in the summer, budget risks are likely to come into focus later. Equity/bond correlations have remained positive in the US but less so in other markets – we think bonds will help buffer growth shocks in 2H. We are OW long-dated UK and German 10-year bonds, Neutral US treasuries and UW JGBs. We also continue to like TIPS for long-term investors and our rates team recommends a 5s10s TIPS curve steepener.
We remain UW credit for 12m, shift N 3m. Our credit strategy team continues to expect carry-driven returns for the remainder of the year with spreads relatively rangebound. Our EM team also expects EMBI spreads to remain rangebound and their 12-month EMBI Global Diversified spread target (including Venezuela) is now 380bp. All-in yields for credit are becoming more attractive vs. cash with central bank rate cutting cycles but mainly due to sovereign yields; we think the risk/reward for equity is more attractive for the rest of the year. However, near-term credit could be more defensive – the sensitivity of credit to equity has been lower YTD due to low recession risk and relative illiquidity. Also, mega cap tech stocks might suffer in the upcoming earnings season. They like selective European opportunities such as EUR real estate IG and French banks (where the political risk premium has more room to normalise). We are neutral across regions and with 'higher for longer' rates there is a weaker case for staying down-in-quality – but our credit strategy team does not expect a major negative impact from the upcoming maturity wall.
We remain OW commodities for 12m, shift N 3m. Commodities can help diversify both geopolitical and political risk, as well as in the event of overheating when late cycle – recent correlations with a 60/40 portfolio have been low. Near-term upside to oil prices might be limited by OPEC spare capacity, which is why our commodities team maintains a rangebound view, with a $75-90 range for Brent. Gold has broken out of its Q2 range given optimism on the impending Fed cutting cycle. Our team has a target of $2,700/toz by year-end, supported by tailwinds from central bank purchases and China demand, but they also think it can be an important hedge into the US elections in the event of trade tariffs, Fed subordination risk, and debt concerns. We remain particularly bullish on copper ($12,000/year-end target) – demand should be supported by an eventual global manufacturing pick-up and the green transition, as well as structural under-supply and extremely low inventory.
2. Our sentiment and positioning indicators remained relatively elevated throughout Q2. The gap between investor and economic sentiment has narrowed with global PMIs picking up (Exhibit 2), but recently global growth momentum has been more negative again, with negative macro surprises in most regions. US equity futures positioning remains particularly elevated, consistent with the S&P 500 making new all-time highs. Also, the Investor Intelligence and AAII surveys have shifted more bullish and the VIX has declined compared with 3 months ago (Exhibit 3). On the flip side, 3m flows into riskier bonds (credit) and systematic investor positioning have turned somewhat less bullish. Although fund flows into safe bonds also remain very strong, the aggregate indicator has increased back to its year-to-date peak bullish levels.

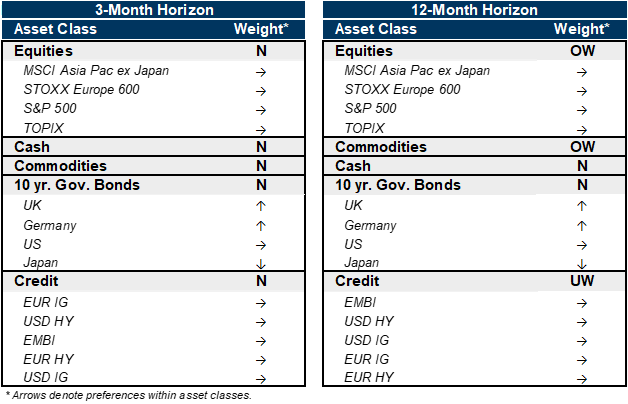
Exhibit 2: Aggregate positioning and sentiment indicators are again quite bullish

Data since 2007
2. Aggregate positioning and sentiment indicators are again quite bullish. Data available on request.
Source: Datastream, Haver Analytics, EPFR, Goldman Sachs Global Investment Research

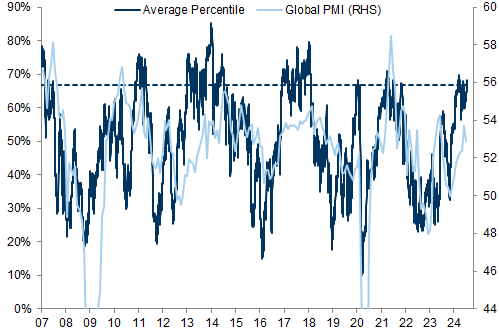
Exhibit 3: Percentiles of sentiment indicators are elevated

Data since 2007
3. Percentiles of sentiment indicators are elevated. Data available on request.
Source: Datastream, Haver Analytics, EPFR, Goldman Sachs Global Investment Research
US equity futures positioning remains near all-time highs; similarly, high S&P 500 funding spreads point to elevated positioning from levered investors (Exhibit 4 and Exhibit 5). From such elevated levels of S&P 500 futures positioning, both near-term and 12-month equity returns have historically been less positive on average. This increases the risk of corrections in the event of external shocks, e.g., around the US elections. This might be particularly the case in the summer when liquidity tends to decrease. Our US equity strategy team has highlighted that earnings expectations into the Q2 earnings season are high: for the aggregate S&P 500 index, consensus expects 9% year/year EPS growth, the highest level of expected growth since 2021. Expectations for the mega cap tech stocks in particular are elevated and with record index concentration disappointing results from them could weigh on the index.

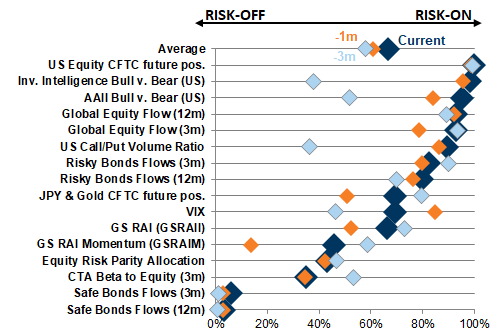
Exhibit 4: Equity futures positioning remains elevated with S&P 500 funding spreads elevated

4. Equity futures positioning remains elevated with S&P 500 funding spreads elevated. Data available on request.
Source: Bloomberg, Goldman Sachs Global Investment Research

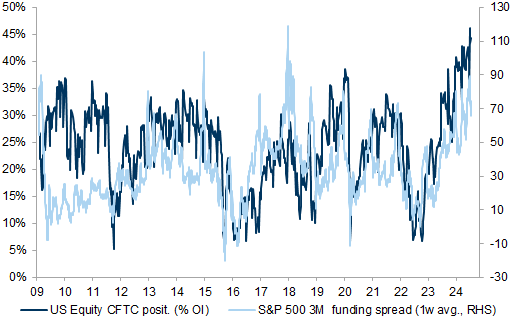
Exhibit 5: From elevated levels of S&P 500 futures positioning, near-term returns are negatively skewed

S&P 500 returns conditional on starting percentile of US Equity CFTC positioning (% OI) since 2007
5. From elevated levels of S&P 500 futures positioning, near-term returns are negatively skewed. Data available on request.
Source: Bloomberg, Goldman Sachs Global Investment Research
3. Our business cycle scores point to a stable late-cycle position with more negative inflation momentum and policy easing ahead. During late-cycle backdrops risk premia tend to be compressed as macro conditions are supportive – risky assets often continue to perform well, especially in the case of falling inflation like last year, or policy easing like we expect this year. The economy often operates at full capacity and corporate profitability is high. Those periods can last a long time and are generally a risk-friendly backdrop until there are more clear signs of a material growth slowdown and rising risk of a recession. We have argued that a healthy private sector, as indicated by the private sector financial balance, suggests an 'early' late-cycle backdrop with low recession risk; also, non-US growth and manufacturing have been much weaker in the last year, indicating some potential for recovery.

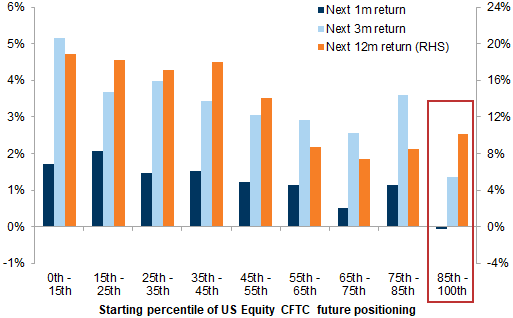
Exhibit 6: We expect growth to remain strong with further inflation normalisation and material policy easing

Average expanding z-score of macro and market variables across growth, inflation, and policy (dotted lines denote extrapolation based on GS economics forecasts)
6. We expect growth to remain strong with further inflation normalisation and material policy easing. Data available on request.
Source: Haver Analytics, Bloomberg, Goldman Sachs Global Investment Research
However, global macro surprises turned negative in Q2 (Exhibit 7). As our economists highlighted, in the US GDP growth slowed meaningfully in the first half of the year. They also think that the US labour market is now fully rebalanced and more slowing could start to result in job losses, pushing up the unemployment rate. Historically, equities have underperformed bonds in periods of rising unemployment, especially in the case of large increases around recessions (Exhibit 8). However, since the trough in the US unemployment rate 15 months ago, equities have outperformed bonds materially – in part this might reflect the fact that immigration contributed to the increase in the unemployment rate but also that equities were boosted by mega cap tech stocks, which are less linked to the economy. And bonds performed less well due to markets repricing a 'higher for longer rates' backdrop and fiscal risks.

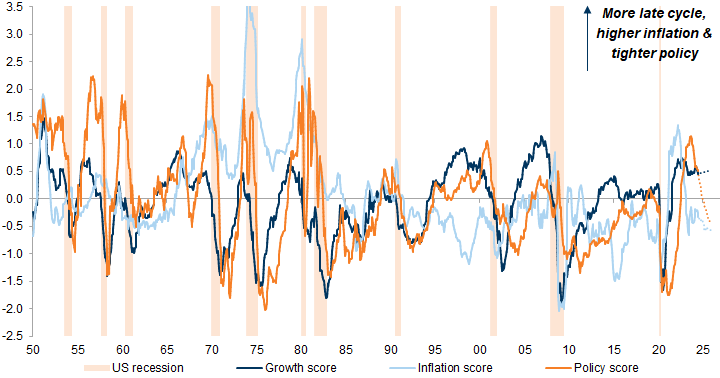
Exhibit 7: Global macro surprises have been more negative since Q2

Macro surprises (MAP). Europe = 75% Euro area + 25% UK
7. Global macro surprises have been more negative since Q2. Data available on request.
Source: Bloomberg, Goldman Sachs Global Investment Research

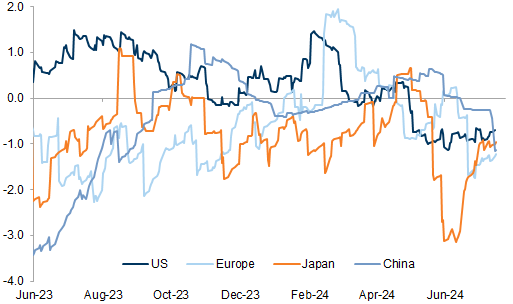
Exhibit 8: Equities have outperformed bonds despite a rise in the unemployment rate

Relative total return. Shaded area: US recessions
8. Equities have outperformed bonds despite a rise in the unemployment rate. Data available on request.
Source: Datastream, Goldman Sachs Global Investment Research
Still, a continued growth slowdown and weakening of the labour market could pose the risk of a catch-down from equity vs. bond performance. That said, we see more risk of a correction rather than a bear market in equities. Equities had a max drawdown of 15% on average in the year following a peak in growth score, but the performance dispersion is large (Exhibit 9). The level of the growth score matters critically for equity drawdown risk – from positive levels like now (0.5), the most negative equity returns in the subsequent 6 months have usually been around 10% (Exhibit 10). Only when the growth score shifts below zero, which has historically been mostly around recessions, did equities have drawdowns in excess of 20%. Our economists' baseline view is a moderate growth pick-up in H2 as the impulse from financial conditions is turning more positive at a time when we expect the drag from inventories and net trade to end – this should help limit downside to equities.

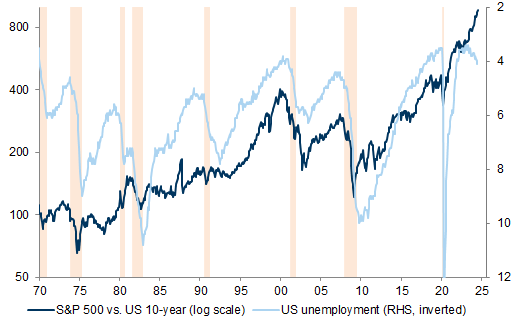
Exhibit 9: Equities tend to consolidate late cycle but performance dispersion is large

S&P 500 performance around growth peaks since 1950 (rebased to 100)
9. Equities tend to consolidate late cycle but performance dispersion is large. Data available on request.
Source: Haver Analytics, Bloomberg, Goldman Sachs Global Investment Research

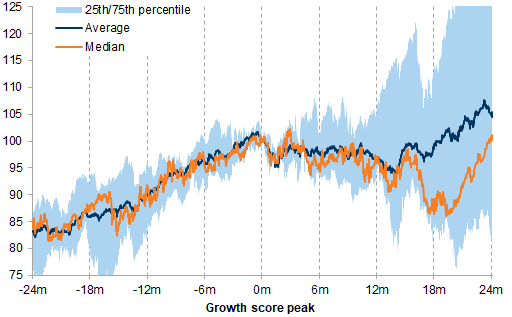
Exhibit 10: Unless the growth score drops below zero, equity drawdown risk is relatively limited

Data since 1950
10. Unless the growth score drops below zero, equity drawdown risk is relatively limited. Data available on request.
Source: Datastream, Haver Analytics, Goldman Sachs Global Investment Research
4. Also, central bank easing should help limit downside both to the economy and risky assets. Weaker growth momentum, especially in the labour market, had already driven increased expectations for Fed rate cuts. Last week's softer US inflation data and more balanced Powell comments further increased market expectations for Fed rate cuts – the 12-month forward implied change in the fed funds rate is now nearing the most dovish pricing from Q4 2023 (Exhibit 11). Our economists still expect two Fed cuts until year-end but have argued there could be a case for a July cut considering progress on inflation and weaker labour markets. So far the dovish repricing has come without a major repricing in other latent recession risk indicators, such as the yield curve, cyclicals vs. defensives P/Es and MBS spreads, which has resulted in a benign backdrop for risky assets (Exhibit 12).

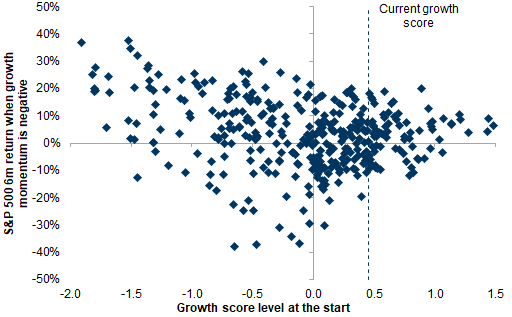
Exhibit 11: Markets are again pricing more Fed cuts in the next 12 months

11. Markets are again pricing more Fed cuts in the next 12 months. Data available on request.
Source: Haver Analytics, Goldman Sachs Global Investment Research

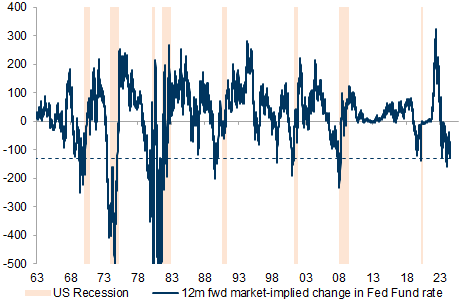
Exhibit 12: Other latent recession indicators have mostly priced out risk YTD

Market-implied probability of a recession in the next 12 months
12. Other latent recession indicators have mostly priced out risk YTD. Data available on request.
Source: Datastream, Haver Analytics, Goldman Sachs Global Investment Research
Fed easing cycles have generally been positive for equities as long as there was no recession and growth was good (Exhibit 13). The S&P 500 delivered positive returns on average and in particular if the US economy avoided a recession, which is when the S&P 500 delivered almost a 20% return on average in the 12 months after the first cut – since 1990, when a recession followed the cut, the S&P 500 has delivered poor returns in the subsequent 12-18 months. Before 1990, as the Fed was less reactive to growth, equities usually dropped before the Fed cut. Of course, there have been material differences in macro backdrops and asset performance into historical Fed cutting cycles, and the sample size is small. Arguably, this time macro conditions are more friendly, with low recession risk, but risk premia are low and risky assets are already benefiting from negative inflation momentum given stable growth last year.

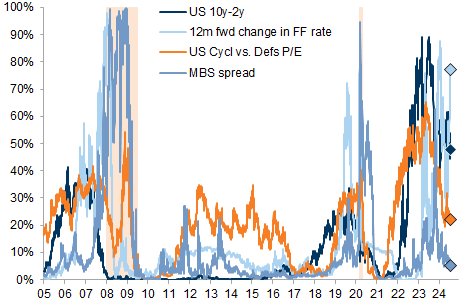
Exhibit 13: Equities tend to perform well after the Fed cutting cycle starts, unless growth is weak

S&P 500 total return performance indexed to start of Fed cutting cycle (data since 1955)
13. Equities tend to perform well after the Fed cutting cycle starts, unless growth is weak. Data available on request.
Source: Datastream, Goldman Sachs Global Investment Research
The interaction with growth also matters for changes in bond yields. Historically, US 10-year yields have fallen going into Fed cutting cycles in anticipation of the first cut, with the pace of declines slowing after the actual cut (Exhibit 14). If the US economy avoided a recession, further declines were relatively limited and reversed in part – in the case of weaker growth US 10-year yields continued to decline. Similarly, in the case of deeper cutting cycles due to weaker growth the yield curve steepened more, while during those with continued good growth yield curve steepening was relatively limited (Exhibit 15). Our macro baseline view (and recent price action) is consistent with the Fed cutting into a friendly growth backdrop helped by continued inflation normalisation – this points to support for equities and limited declines in long-dated bond yields with modest curve steepening.

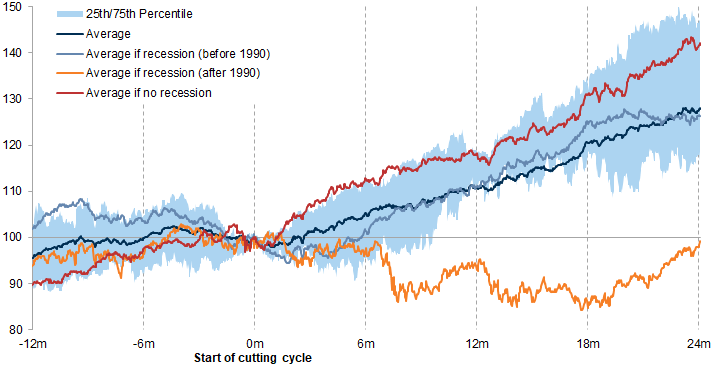
Exhibit 14: Bonds yields tend to decline but less so if growth remains strong

Change in US 10-year yields rebased to start of Fed cutting cycles (data since 1955)
14. Bonds yields tend to decline but less so if growth remains strong. Data available on request.
Source: Datastream, Goldman Sachs Global Investment Research

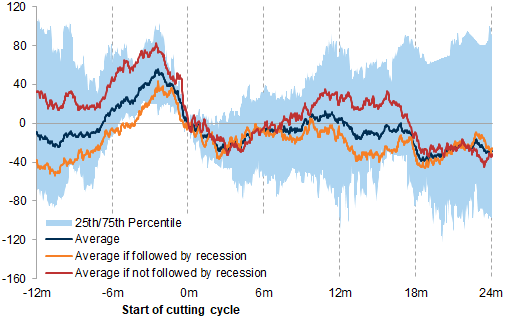
Exhibit 15: The US yield curve generally steepened around the start of Fed cutting cycles

Change in US 2s10s spread rebased to the start of Fed cutting cycles (data since 1955)
15. The US yield curve generally steepened around the start of Fed cutting cycles. Data available on request.
Source: Datastream, Goldman Sachs Global Investment Research
5. So far 'bad news' has been 'good news' for equities and risky assets more broadly. As we recently wrote, our RAI PC1 'Global growth' factor has started to reprice the weaker macro backdrop, triggered by the EM carry unwind due to surprising election outcomes in India, Mexico and South Africa, as well as the widening of OAT spreads and European risk premia due to the French snap elections. While the RAI PC1 has declined, it is still above the more negative level of our US MAP score, which tracks macro surprises and has declined further. At the same time, the RAI PC2 'Monetary policy' factor increased, which cushioned the negative growth repricing – markets have shifted to a 'central bank put' regime (RAI PC1 down, RAI PC2 up). The recent declines in global bond yields were further helped by weaker US inflation data but also by safe haven demand for Bunds due to concerns around EU sovereign risk.

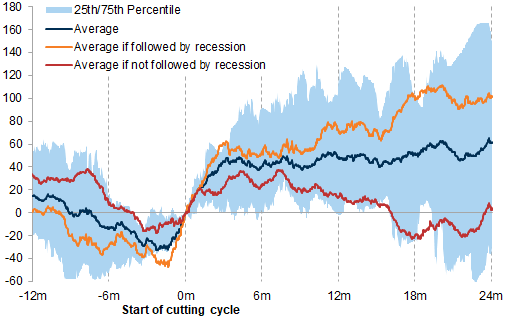
Exhibit 16: Growth optimism across assets has started to decline with more negative macro surprises

PC1: Global growth factor vs. macro surprises (MAP)
16. Growth optimism across assets has started to decline with more negative macro surprises. Data available on request.
Source: Datastream, Goldman Sachs Global Investment Research

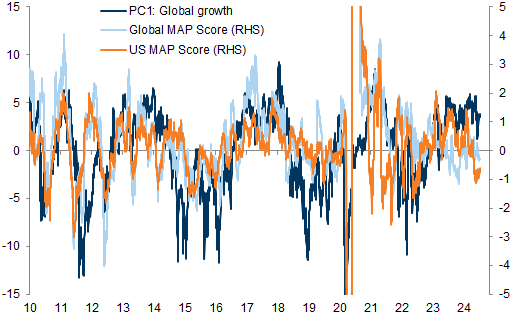
Exhibit 17: RAI PC2 has declined alongside rising real yields since the beginning of the year

Monetary policy factor vs. US 10-year TIPS yield (1y z-score)
17. RAI PC2 has declined alongside rising real yields since the beginning of the year. Data available on request.
Source: Datastream, Goldman Sachs Global Investment Research
This 'bad news is good news' regime has been particularly supportive for the S&P 500, which was boosted to a new all-time high. The correlation of the S&P 500 with the RAI PC2 "Monetary policy" has been higher than with the RAI PC1 "Global growth" in the last year for the first time since the late 1990s (Exhibit 18). This likely reflects the growing weight of mega cap US tech, which increased the equity duration of the overall index. On the flip side, equity/bond correlations for the Russell 2000 and MSCI EAFE have already shifted more negative as bad growth news outweighed support from easier monetary policy (Exhibit 18). Last week global small and mid cap stocks started to outperform sharply, likely on optimism that Fed cuts could help a recovery in economic growth and positioning unwinds. In the coming weeks, a key risk is that 'bad news' becomes 'bad news' either because growth disappoints too much, e.g., due to continued weakness in US labour markets or the Q2 earnings season, or as the market's dovish central bank expectations are disappointed.

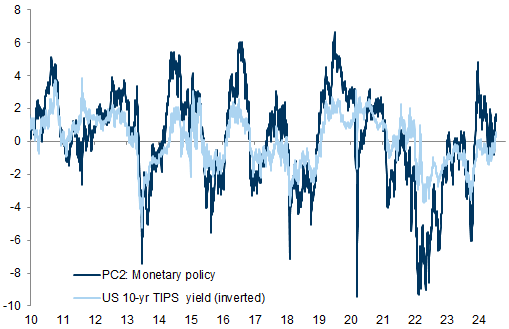
Exhibit 18: S&P 500 sensitivity to monetary policy shifts has been more important than to growth optimism

S&P 500 12-month correlation with RAI PC1 and PC2 (monthly changes)
18. S&P 500 sensitivity to monetary policy shifts has been more important than to growth optimism. Data available on request.
Source: Bloomberg, Goldman Sachs Global Investment Research

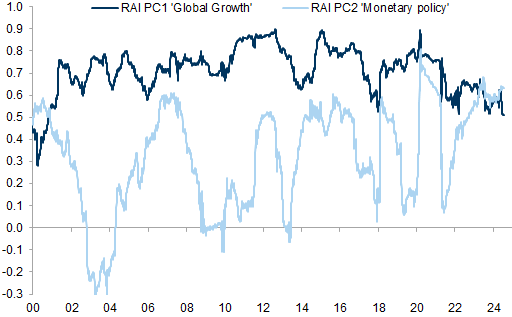
Exhibit 19: Equity/bond correlation has started to decrease

1-month correlation of weekly returns
19. Equity/bond correlation has started to decrease. Data available on request.
Source: Haver Analytics, Datastream, Goldman Sachs Global Investment Research
6. Rising policy uncertainty into the US election can also trigger a shift to a 'bad news is bad news' regime. While markets have just started to fade European political risk, the US presidential elections on November 5 are moving closer into focus – the implied S&P 500 volatility term structure is upward-sloping into the event with excess volatility priced early in November (Exhibit 20). And uncertainty has increased post the first TV debate – the betting market-implied probability that former President Trump will win rose materially during and since the debate, forcing the market to price the potential impacts earlier. The overall cross-asset footprint has been mixed with rising long-dated bond yields and breakeven inflation and some equity strength but less Dollar strength than expected. The clearest cross-asset move has been a steepening of the US yield curve, which extended alongside a rising probability of a Republication victory (Exhibit 21). In fact, the US 2s30s spread is now disinverted for the first time in two years – continued increases in long-dated bond yields can reverse some of the support from expected central bank easing.

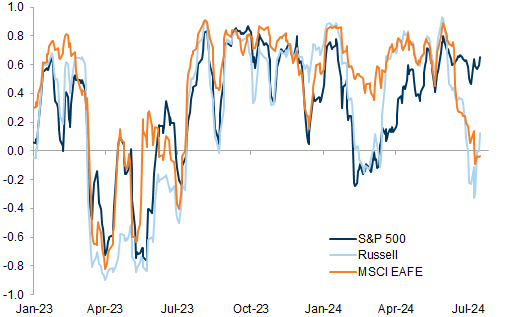
Exhibit 20: Implied volatility is still pricing rising risks into the US elections

S&P 500 implied volatility term structure
20. Implied volatility is still pricing rising risks into the US elections. Data available on request.
Source: Refinitiv Eikon, Goldman Sachs Global Investment Research

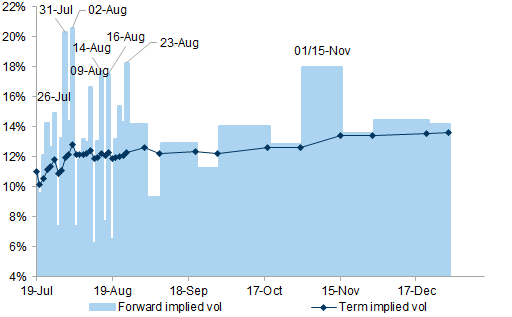
Exhibit 21: US yield curve has steepened with a rising probability of a Republican win

21. US yield curve has steepened with a rising probability of a Republican win. Data available on request.
Source: Bloomberg, PredictIt, Goldman Sachs Global Investment Research
We continue to believe that a second Trump presidency would involve higher tariff levels, looser regulatory policy, and potentially looser US fiscal policy. The Dollar remains a key portfolio hedge to mitigate related risks, both due to potential reflationary policies but also potential trade tariff increases, which could be a stagflationary shock. The correlation of a US 60/40 portfolio with the Dollar remains deeply negative (Exhibit 22). Our FX team has been tactically more bearish the Dollar, supported by the 'risk on' backdrop and weaker US data – this might eventually create an entry opportunity for Dollar longs as an overlay into the US elections. While we do expect steeper yield curves into year-end, our rates team has highlighted that tariffs might actually drive flatter curves if rate cuts are delayed and there is a negative growth impact. There could be more value in long US belly breakeven inflation positions, possibly relative to Europe (Exhibit 23). Our European economists estimate a 100bp negative Euro area GDP growth impact from a 10% blanket tariff but little inflation impact.

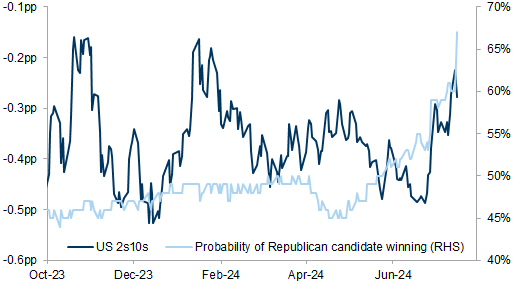
Exhibit 22: The Dollar remains a key hedge for rate shock risk in multi-asset portfolios

1-year rolling correlation with a US 60/40 portfolio
22. The Dollar remains a key hedge for rate shock risk in multi-asset portfolios. Data available on request.
Source: Bloomberg, Goldman Sachs Global Investment Research

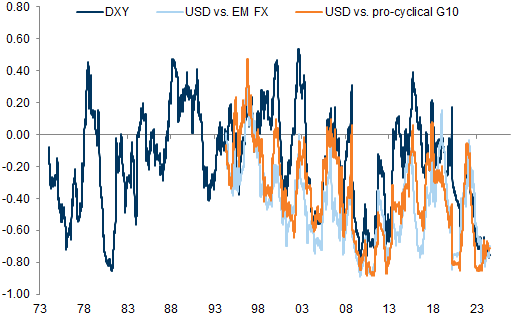
Exhibit 23: US traded inflation has increased vs. EMU

Differential in US vs. EMU inflation swap
23. US traded inflation has increased vs. EMU. Data available on request.
Source: Bloomberg, Goldman Sachs Global Investment Research
7. With both the French and the UK elections behind us, European risk premia have normalised quickly (Exhibit 24). Cyclical pricing across assets in Europe has declined more than in the US but has recovered since (Exhibit 25). However, increased political uncertainty, including concerns on EU fiscal risks, might weigh on French and European growth. In addition, our economists have highlighted that trade tariffs might drive more monetary policy divergence; we are OW German/UK, N US and UW Japan 10-year bonds. Our European strategy team has also shifted more defensive in their sector portfolio and recommend US vs. China exposure to address the more challenging macro backdrop and potential for divergence. They estimate a potential 6-7% hit to European earnings growth from a 10% tariffs on all US imports. We prefer UK equities, both FTSE 100 and FTSE 250 – this is due to potential political tailwinds for domestic growth but also high USD exposure and sector mix for FTSE 100 providing an embedded hedge for US elections.

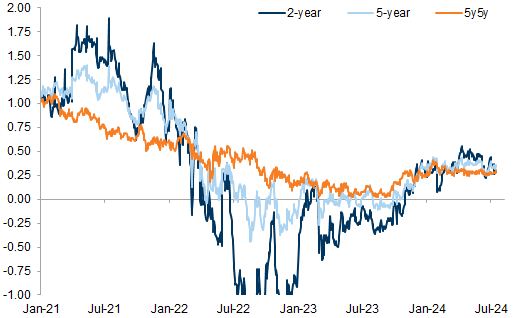
Exhibit 24: European political risk premium has declined again

24. European political risk premium has declined again. Data available on request.
Source: Bloomberg, Goldman Sachs Global Investment Research

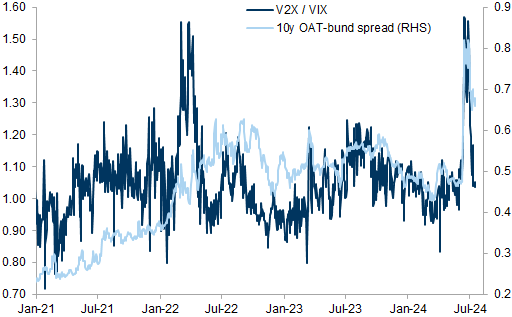
Exhibit 25: Procylical pricing across assets has declined more in Europe recently

Average 1y z-score of equity vs. 10y bonds, cyclical vs. defensives, financials vs. staples, HY credit spreads
25. Procylical pricing across assets has declined more in Europe recently. Data available on request.
Source: Datastream, Haver Analytics, Goldman Sachs Global Investment Research
China growth pricing has been under pressure again after closing some of the gap to RAI PC1 YTD (Exhibit 26). While the MAXPJ ex China has continued to perform well helped by India and Taiwan, HSCEI and A-Shares have consolidated after some optimism around the 'Nine Measures' reforms. While our China strategy team have seen an attractive tactical setup into the July policy meetings, but there have been few surprises – the nearing US elections and potential negative impacts from trade tariffs increase potential for volatility in 2H. On the positive side Japanese equities have made new all-time highs after mostly consolidating during Q2, helped by a weaker Yen and anchored real yields (Exhibit 27). Further tailwinds from governance reforms, low real yields and a weaker FX can support Japanese equities – our Japan strategy team have upgraded their earnings growth forecasts but highlighted that valuations have moved to the upper end of their range, and they see potential for a consolidation near-term.

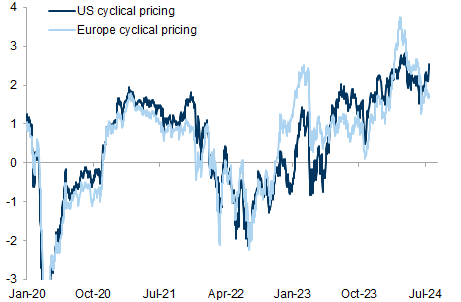
Exhibit 26: China growth pricing across assets remains much more conservative

26. China growth pricing across assets remains much more conservative. Data available on request.
Source: Datastream, Haver Analytics, Goldman Sachs Global Investment Research

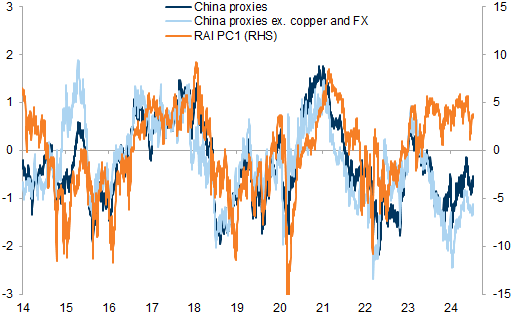
Exhibit 27: Japanese equities have made new all-time highs helped by a weaker Yen

27. Japanese equities have made new all-time highs helped by a weaker Yen. Data available on request.
Source: Datastream, Goldman Sachs Global Investment Research
8. Commodities also benefit from Fed cutting cycles but which commodity depends on growth. As Exhibit 28 shows, historical Fed cutting cycles have been supportive for commodities as long as growth was strong – if the US entered a recession in the 12m following the cut, the GSCI declined sharply. Our commodities team found similar results, with industrial metals performing particularly strongly in positive growth scenarios - they remain bullish copper into 2H while expecting oil to be rangebound. Importantly, in the first 6 months after the first Fed cut commodities tend to increase irrespective of subsequent growth, likely due to still supportive activity levels. This is in contrast to equities, which tend to be more forward-looking and decline well ahead of weaker growth. Thus, we continue to see benefits from late-cycle allocations to commodities, which can also help diversify against rate shocks and policy risk into the US election (Exhibit 29).

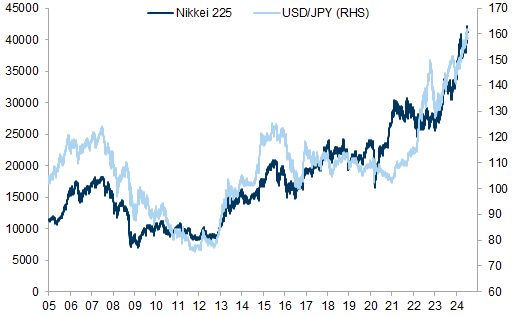
Exhibit 28: Commodity performance around Fed cutting cycles is particulary sensitive to growth

S&P GSCI performance rebased to the start of Fed cutting cycles (data since 1971)
28. Commodity performance around Fed cutting cycles is particulary sensitive to growth. Data available on request.
Source: Datastream, Goldman Sachs Global Investment Research

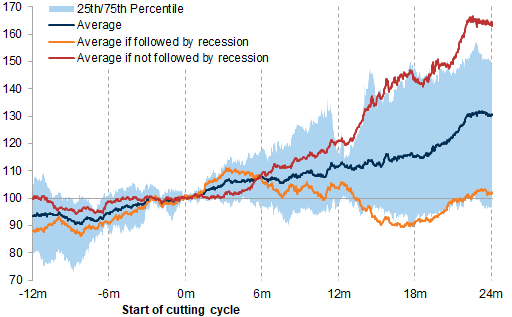
Exhibit 29: Commodities can help diversifiy in the event of a rate shock and policy risks

12-month rolling correlation with S&P 500 (weekly changes)
29. Commodities can help diversifiy in the event of a rate shock and policy risks. Data available on request.
Source: Datastream, Goldman Sachs Global Investment Research
Gold can be a particularly effective portfolio overlay for a pro-risk asset allocation right now – it tends to perform strongly during Fed cutting cycles with poor growth outcomes (Exhibit 30). In addition, as our commodities team has shown, Gold can offer the best protection against very high inflation caused by losses in central bank credibility and geopolitical supply shocks, which might include trade tariffs. Gold has already performed strongly YTD due to China demand, both from households and the central bank – Gold prices have been more closely linked to Chinese 10-year yields than to US 10-year TIPS yields (Exhibit 31). That said, US ETF flows into Gold have been limited YTD and could pick up with a less favourable growth/inflation mix, concerns on stagflation and rising political uncertainty. Also, with the recent more dovish Fed pricing, Gold has broken out of its Q2 range.

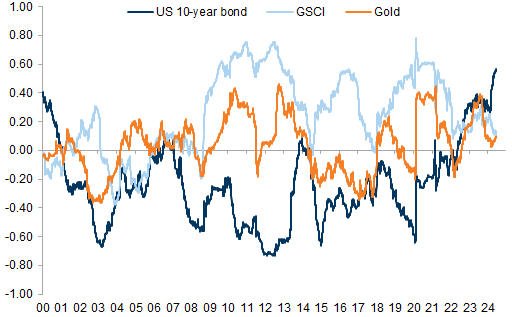
Exhibit 30: Fed cutting cycles can be very supportive for Gold if followed by weaker growth

Performance of Gold rebased to the start of Fed cutting cycles (data since 1971)
30. Fed cutting cycles can be very supportive for Gold if followed by weaker growth. Data available on request.
Source: Datastream, Goldman Sachs Global Investment Research

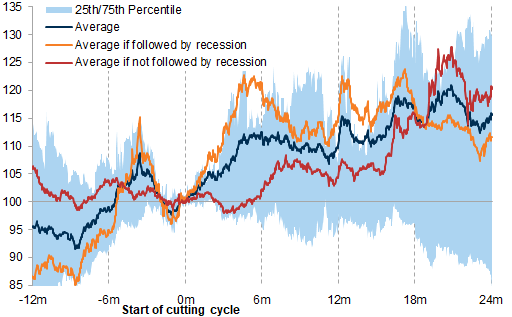
Exhibit 31: Gold has benefitted mainly from China demand YTD

31. Gold has benefitted mainly from China demand YTD. Data available on request.
Source: Datastream, Goldman Sachs Global Investment Research
9. Equities have outperformed credit YTD but near-term there might be risk of a relative setback. As we wrote earlier in the year, as we shift late cycle we generally prefer equity vs. credit as tight credit spreads are a more binding constraint while stock valuations can overshoot. This has been the case in particular recently as the sector mix in equity is more favourable compared with credit, especially in the US, which has a larger weight in large cap quality growth stocks. Since Q1 equity has materially outperformed credit on a risk-adjusted basis (Exhibit 32) – equities have underperformed credit only in the past month in Europe, due to the recent increase in European sovereign risk premia. Equity/credit valuations remain somewhat in favour of equities (Exhibit 33) but the credit/equity beta in a 'risk off' environment might be lower due to illiquidity and also in the event the equity drawdown is triggered by large cap tech stocks, e.g., due to disappointing Q2 results.

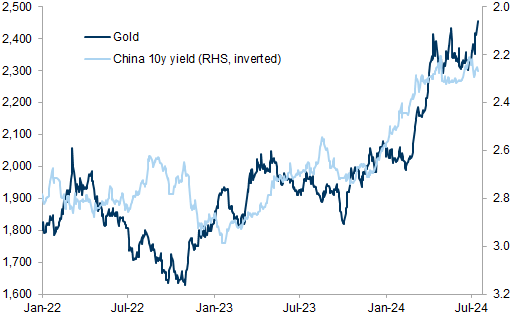
Exhibit 32: Equities have outperformed credit on a risk-adjusted basis YTD

32. Equities have outperformed credit on a risk-adjusted basis YTD. Data available on request.
Source: Datastream, Goldman Sachs Global Investment Research

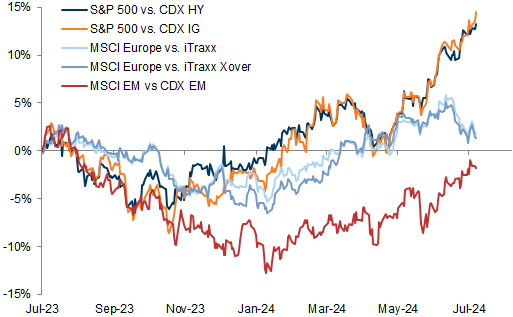
Exhibit 33: Equity valuations continue to look attractive relative to credit

33. Equity valuations continue to look attractive relative to credit. Data available on request.
Source: Datastream, Goldman Sachs Global Investment Research
Cross-asset carry has been among the best-performing factors for more than a year. Our macro baseline view of solid growth, further inflation normalisation and central bank easing should continue to support carry. However, while we see little scope for broad declines in risk premia, we look for carry opportunities very selectively. In corporate credit our credit strategy team thinks carry will drive most of the returns, especially in HY. They like selective European opportunities such as EUR real estate IG and French banks (where the political risk premium has more room to normalise). Our EM team also expects EMBI spreads to remain rangebound and their 12-month EMBI Global Diversified spread target (including Venezuela) is now 380bp. They continue to look for selective EM FX carry opportunities as the US elections move closer into focus and have initiated a trade recommendation to go long MXN and COP versus EUR. Prospective carry from commodity indices such as S&P GSCI energy remains relatively attractive but with high drawdown risk. We see little benefit from equity put selling strategies with low vol and skew. Defensive dividend yield strategies such as the S&P Dividend Aristocrats are screening better.

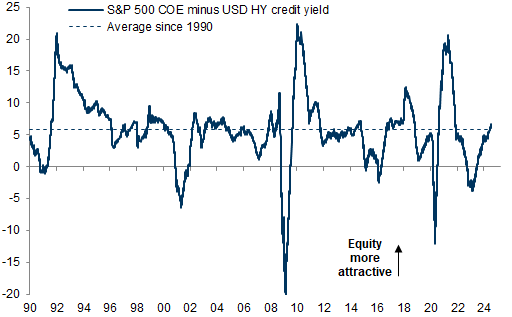
Exhibit 34: Equity carry trades look attractive vs. fixed income

Data since 2000 where available. Equities carry = 12-month forward dividend yield + forward earnings growth
34. Equity carry trades look attractive vs. fixed income. Data available on request.
Source: Datastream, Haver Analytics, Bloomberg, Goldman Sachs Global Investment Research
10. Implied volatility across assets has continued to trend lower despite some temporary spikes (Exhibit 35). Equity implied volatility was particularly low into the start of H2, with VIX touching the lows since 2019, but recently US equity vols started to increase led by Russell and Nasdaq vols as the market rotated sharply between these two indices. High stock dispersion/ low correlation is contributing to low equity vol. Outside of US equities, implied volatility has reset the most for oil, EM equities and USD credit. Our S&P 500 volatility regime model (which aggregates macro, market, and uncertainty indicators) still points to a mixed picture with a falling probability of a low vol regime but no clear signal (Exhibit 36). While market indicators and measures of macro uncertainty still point more to a low vol regime, macro indicators have been worsening given the recent softness in US labour data. We expect equities to avoid a high vol regime under our baseline scenario of a supportive macro backdrop; still, near-term the potential for vol spikes has picked up.

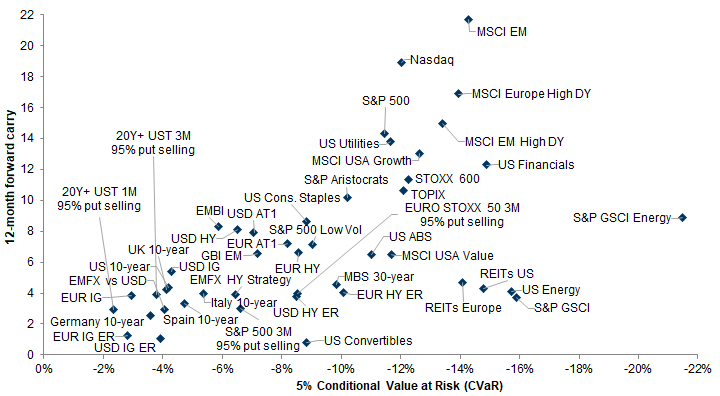
Exhibit 35: Implied volatility across assets is low and has declined YTD

3m ATM implied vol. 0%/100% = min/max since 2010
35. Implied volatility across assets is low and has declined YTD. Data available on request.
Source: Goldman Sachs FICC and Equities, Goldman Sachs Global Investment Research

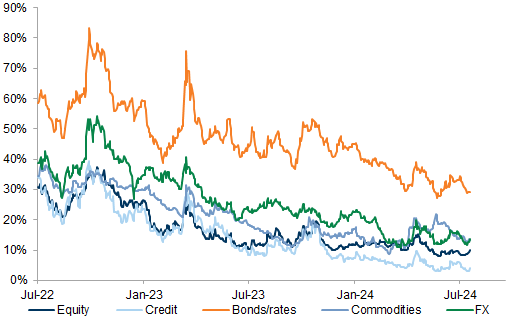
Exhibit 36: The likelihood of an S&P 500 low vol regime has declined

Probability of different S&P 500 vol regimes (green = low vol regime, orange = high vol regime, dotted line = unconditional probability)
36. The likelihood of an S&P 500 low vol regime has declined. Data available on request.
Source: Haver Analytics, Datastream, Consensus Economics, Goldman Sachs Global Investment Research
The French elections and the first US presidential TV debate drove higher rates volatility, but dovish data momentum has already led to a renewed reset in rates vs. equity volatility (Exhibit 37). The reset YTD has been supported by a moderation in rates and policy uncertainty and easier financial conditions, and as investors' focus shifts from the inflation to the growth outlook. Still, the risk of another rate shock due to fiscal policy lingers. We continue to like selling downside on US bonds (e.g., TLT) to fund equity puts – from here, we think this trade would benefit from a further reset in rates vs. equity vol and in the event of a rate shock equities are likely to suffer too. Equity risk-off/risk-on skew continues to be close to its lows, with both elevated call skew and little put skew pricing compared with history (Exhibit 38). The pricing of skew is similar for cyclical FX and commodities, even though less extreme, while the risk-off skew remains elevated for credit and VIX/V2X. This is not surprising as VIX calls (and to some extent credit puts) are less strike-dependent and equities can rally while being volatile.

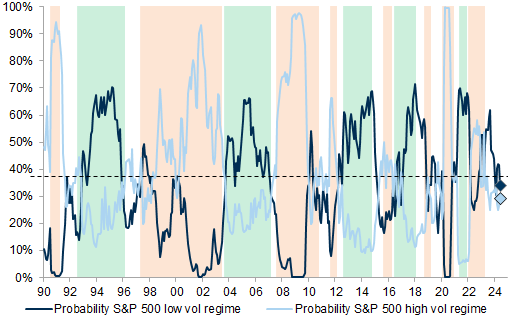
Exhibit 37: Rates vol has declined again vs. equity vol

37. Rates vol has declined again vs. equity vol. Data available on request.
Source: Bloomberg, Goldman Sachs Global Investment Research

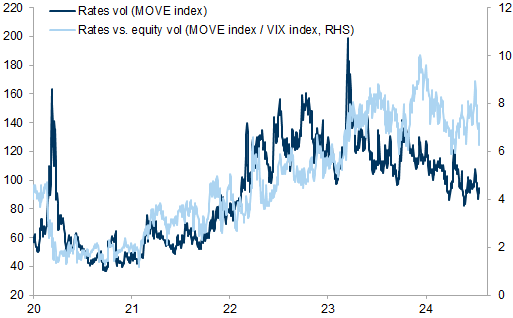
Exhibit 38: Risk-off skews remains unusually low in equities

5-year percentile of 3m 25-delta risk-off/risk-on skew
38. Risk-off skews remains unusually low in equities. Data available on request.
Source: Goldman Sachs FICC and Equities, Goldman Sachs Global Investment Research
We continue to look for selective portfolio overlay hedges to protect equity longs and think effective hedges need to address the source of the shock and the central bank reaction function. Puts (or put spreads to lower negative carry) on DAX or FTSE MIB, Financials (XLF) appear attractive given their high beta to growth pricing vs. implied vol, relatively more limited relief from lower rates due to a value bias, but also exposure to potential US tariffs as regards European indices. Equity down/Dollar up hybrids (such as S&P 500 down & EUR/USD down double digitals) can further decrease the cost of hedging US tariff risk (Exhibit 39). Within rates, EUR rates receivers look attractive against a growth deterioration – our rates team thinks the easing priced so far looks modest. In the case of a renewed 'balanced bear' rate shock, HYG puts look attractive as they are pricing a very low implied rates/credit spread correlation (Exhibit 40).

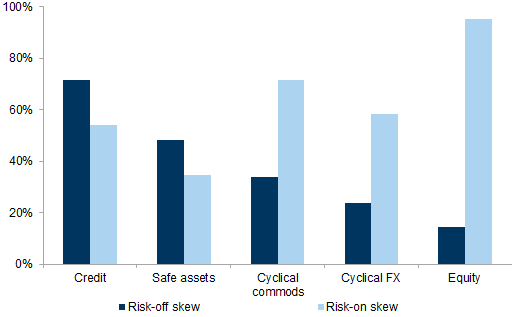
Exhibit 39: Value in equity down, rates or FX down hybrids and European equity puts

Average payout since 2007/ current price. 3-month 25-delta put/call options and double digital hybrid
39. Value in equity down, rates or FX down hybrids and European equity puts. Data available on request.
Source: Bloomberg, Goldman Sachs FICC and Equities, Goldman Sachs Global Investment Research

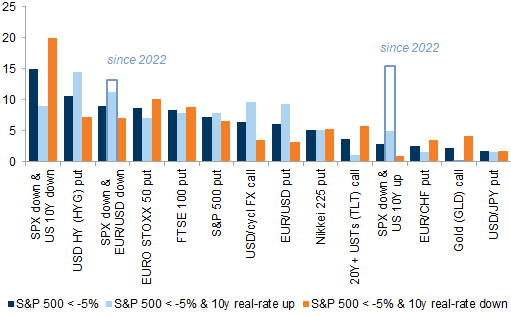
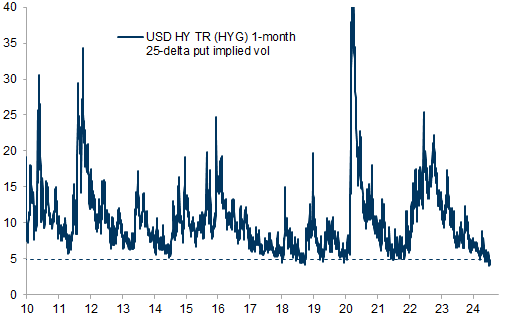
Exhibit 40: Implied volatility of USD HY credit (HYG) is close to all-time lows

40. Implied volatility of USD HY credit (HYG) is close to all-time lows. Data available on request.
Source: Goldman Sachs FICC and Equities, Goldman Sachs Global Investment Research

Cross-asset correlation: Equity/bond correlations have declined again

Exhibit 41: 3m rolling equity/bond correlation of weekly returns

41. 3m rolling equity/bond correlation of weekly returns. Data available on request.
Source: Datastream, Goldman Sachs Global Investment Research

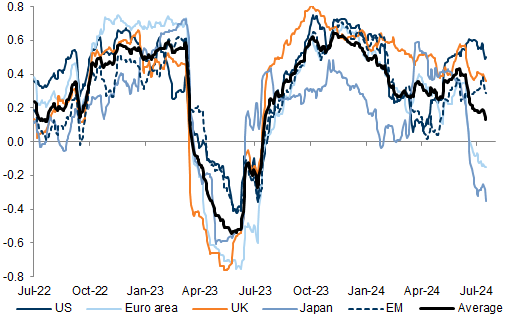
Exhibit 42: 3m rolling equity/FX correlation of weekly returns

42. 3m rolling equity/FX correlation of weekly returns. Data available on request.
Source: Datastream, Stoxx, Goldman Sachs Global Investment Research

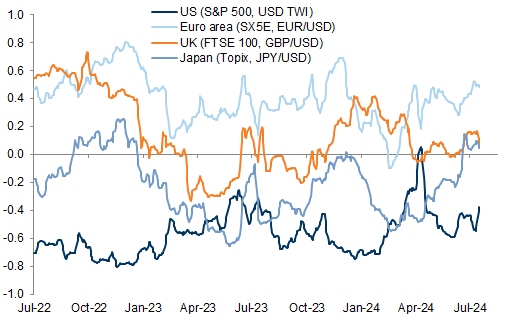
Exhibit 43: 3m rolling commodity price correlation of weekly % changes with different assets

US HY returns, oil, copper and USD TWI spot return
43. 3m rolling commodity price correlation of weekly % changes with different assets. Data available on request.
Source: Datastream, Goldman Sachs Global Investment Research

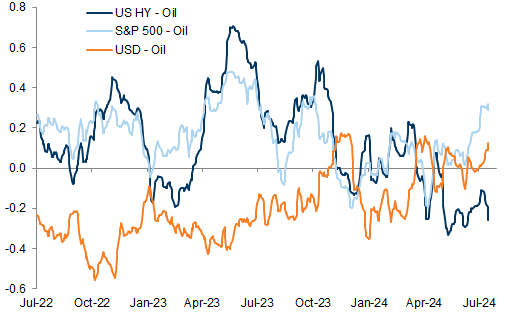
Exhibit 44: 3m rolling equity vol/CDS correlation of weekly level changes

CDX HY for the US, iTraxx Xover for Europe; ATM implied vol for S&P 500 and Euro Stoxx 50
44. 3m rolling equity vol/CDS correlation of weekly level changes. Data available on request.
Source: Datastream, Goldman Sachs Global Investment Research

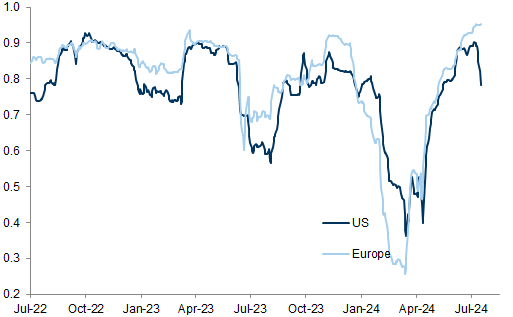
Exhibit 45: 3m rolling correlation of weekly returns with US 10y Treasury returns

45. 3m rolling correlation of weekly returns with US 10y Treasury returns. Data available on request.
Source: Datastream, Goldman Sachs Global Investment Research

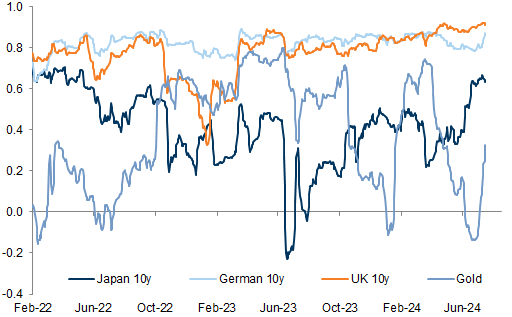
Exhibit 46: Cross-sector dispersion of weekly returns for regional equity indices

46. Cross-sector dispersion of weekly returns for regional equity indices. Data available on request.
Source: Datastream, Goldman Sachs Global Investment Research

Macro monitor: US FCI easing and negative macro surprises

Exhibit 47: Current Activity Indicators (CAI)

47. Current Activity Indicators (CAI). Data available on request.
Source: Goldman Sachs Global Investment Research

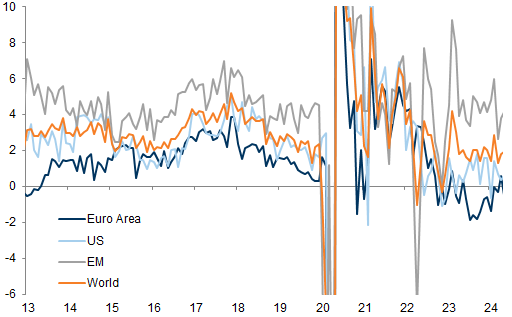
Exhibit 48: Financial Condition Indices (FCI)

48. Financial Condition Indices (FCI). Data available on request.
Source: Goldman Sachs Global Investment Research

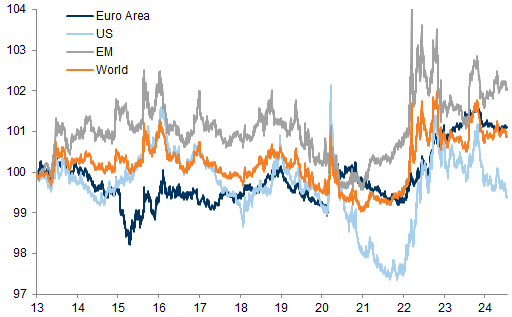
Exhibit 49: Manufacturing PMIs

49. Manufacturing PMIs. Data available on request.
Source: Haver Analytics, Goldman Sachs Global Investment Research

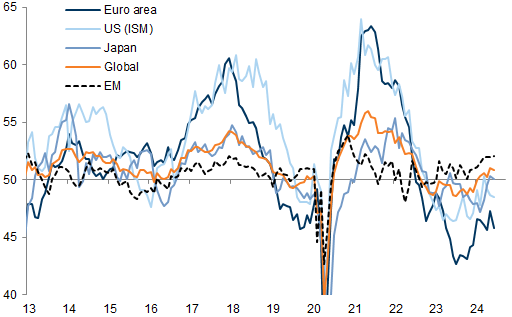
Exhibit 50: Macro-data Assessment Platform

50. Macro-data Assessment Platform. Data available on request.
Source: Goldman Sachs Global Investment Research

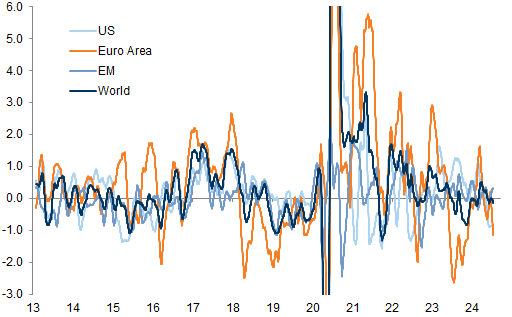
Exhibit 51: Inflation (CPI, yoy)

51. Inflation (CPI, yoy). Data available on request.
Source: Haver Analytics, Goldman Sachs Global Investment Research

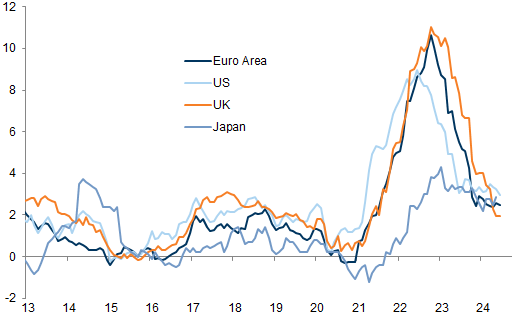
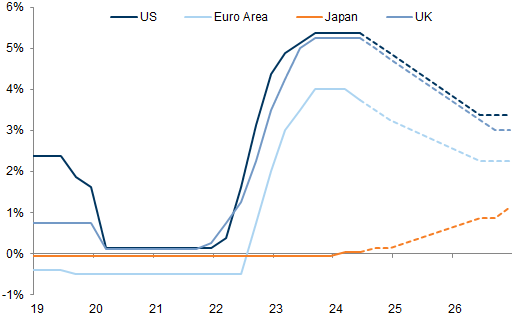
Exhibit 52: GS monetary policy rates forecasts

Policy rate
52. GS monetary policy rates forecasts. Data available on request.
Source: Goldman Sachs Global Investment Research

Asset class forecast returns and performance since last GOAL

Exhibit 53: Goldman Sachs Global Investment Research 3-, 6- and 12-month return forecasts by asset class

53. Goldman Sachs Global Investment Research 3-, 6- and 12-month return forecasts by asset class. Data available on request.
S&P GSCI total return forecast as of July 17, 2024
Source: Datastream, Bloomberg, Goldman Sachs Global Investment Research

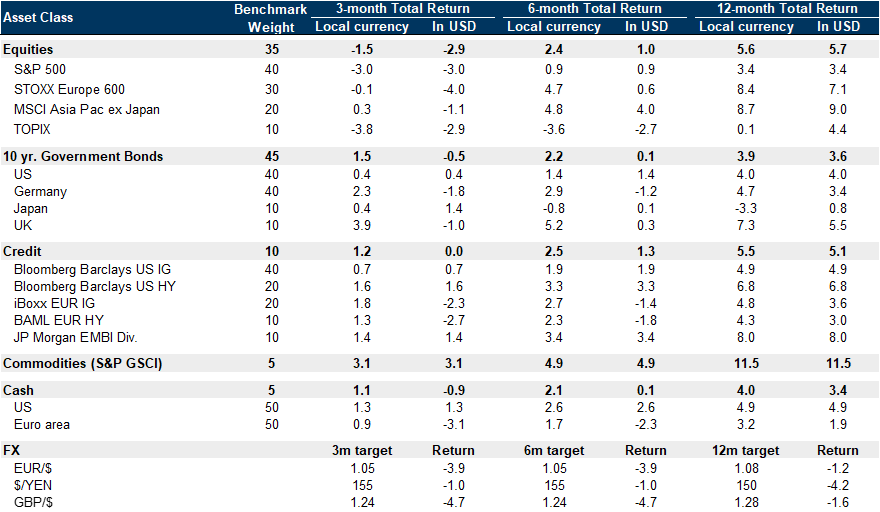
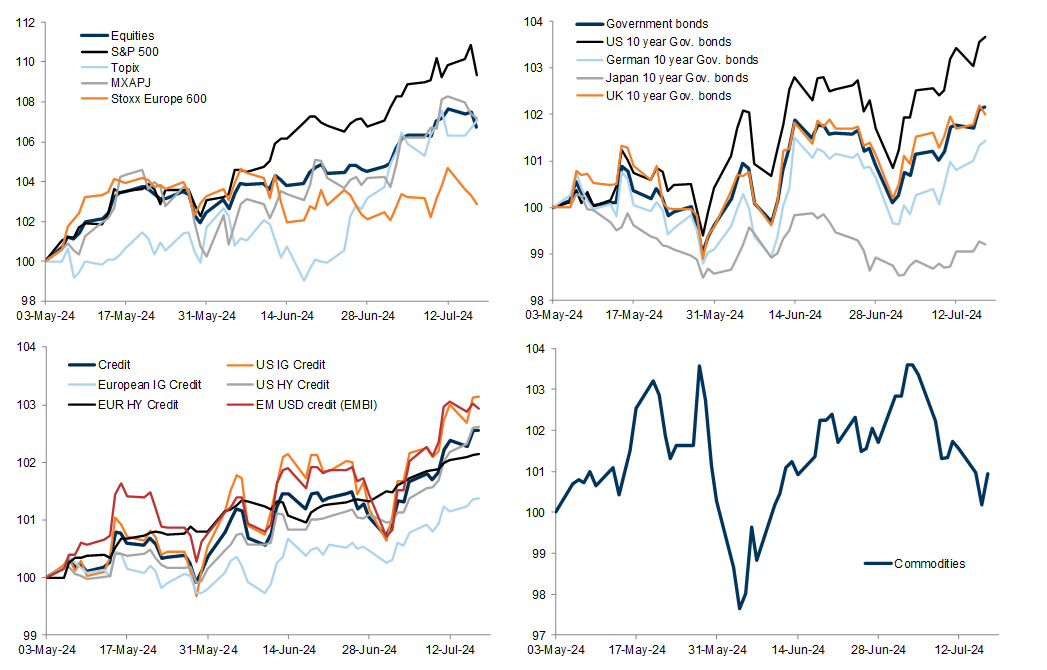
Exhibit 54: Performance of asset classes since our last GOAL (May 3, 2024)

54. Performance of asset classes since our last GOAL (May 3, 2024). Data available on request.
Source: Datastream, Goldman Sachs Global Investment Research

Key macro forecasts

Exhibit 55: GS forecasts across asset classes

55. GS forecasts across asset classes. Data available on request.
Source: Datastream, Bloomberg, Goldman Sachs Global Investment Research

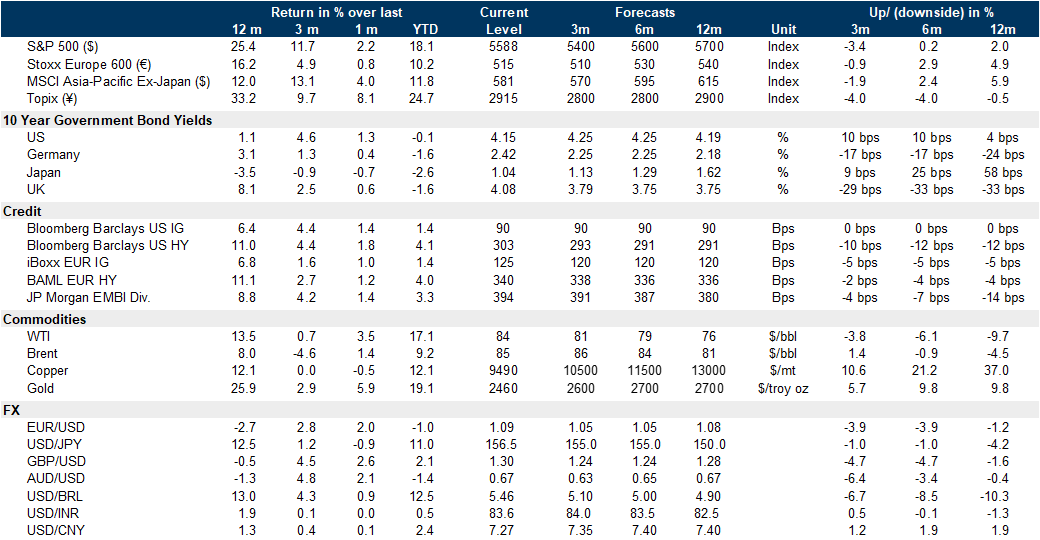
Exhibit 56: DM GDP growth vs. GS CAI and GDP forecasts

56. DM GDP growth vs. GS CAI and GDP forecasts. Data available on request.
Source: Goldman Sachs Global Investment Research

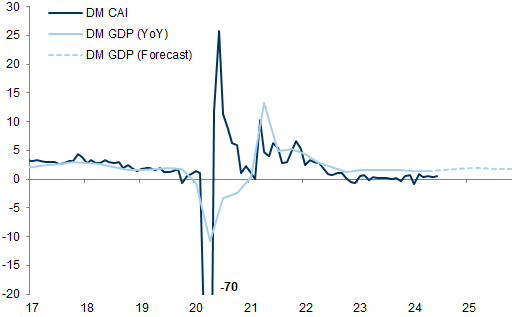
Exhibit 57: EM GDP growth vs. GS CAI and GDP forecasts

57. EM GDP growth vs. GS CAI and GDP forecasts. Data available on request.
Source: Goldman Sachs Global Investment Research

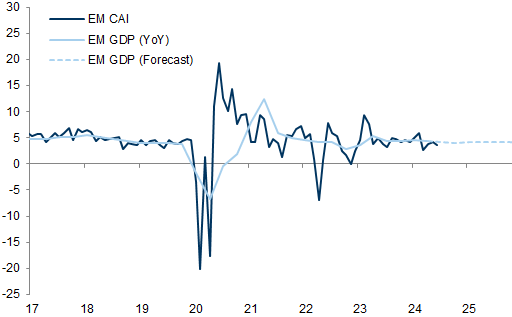
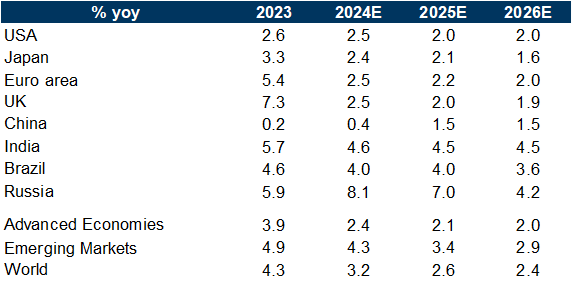
Exhibit 58: Real GDP growth

*Bloomberg Consensus
58. Real GDP growth. Data available on request.
Aggregates are Market FX - Weighted
Source: Bloomberg, Goldman Sachs Global Investment Research

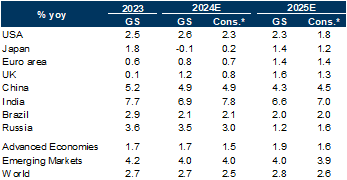
Exhibit 59: Headline Inflation

59. Headline Inflation. Data available on request.
Source: Goldman Sachs Global Investment Research

Investors should consider this report as only a single factor in making their investment decision. For Reg AC certification and other important disclosures, see the Disclosure Appendix, or go to www.gs.com/research/hedge.html.