Goldman Sachs Research
Global Economics Analyst
What Determines Cross-Country Differences in r*? (Daly)
11 August 2024 | 11:01AM EDT | Research | Economics| By Jan Hatzius and others
More
  • The neutral real rate (r*) – the equilibrium real policy rate that is neither stimulatory nor contractionary, consistent with output at potential and stable inflation – is an important anchor for both monetary policy and financial markets.

  • In the years leading up to the 2020 Covid pandemic, there was a consensus among investors, policymakers, and academic economists that neutral rates in the US and other major advanced economies had fallen significantly. We were sceptical of this view – arguing that it exaggerated the likely decline in r* – and more recent estimates point to a higher level of neutral rates in the US and other major advanced economies in the aftermath of the pandemic.

  • While there has been significant research on developments in r* in major advanced economies, there has been less focus on neutral rates in other economies. In this piece, we use market-based estimates of r* for 12 developed (DM) economies and 24 emerging (EM) economies to explore developments in and the drivers of cross-country differences in r*. We find the following:

  • First, developments in EM and DM neutral real rates over the past 25 years have mostly been driven by changes in US/global r*, which have an almost one-for-one impact on other economies. Country-specific spreads have remained largely stable in aggregate, falling in some economies but rising in others.

  • Second, in the latest five-year period (2020-24), the neutral real rate spread vs. the US has ranged from negative in some DM economies (notably Japan, the Euro area and Switzerland) to more than 10pp in some high-yield EM economies that have experienced major currency weakness (Turkey and Egypt).

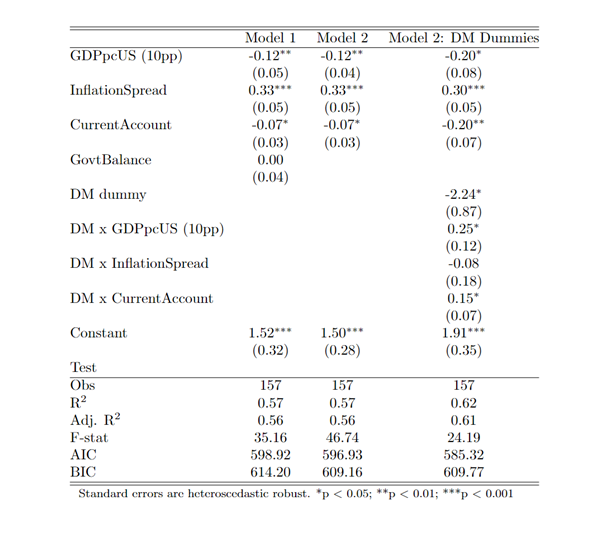
  • Third, we find that most of the cross-country variation in neutral real rates is accounted for by three factors: GDP per capita levels, inflation, and current account balances (the latter are a more important factor for EMs than DMs). A 10pp convergence in GDP per capita lowers neutral real rates (r*) by 12bp (all else equal), 1pp higher average inflation raises r* by 33bp, and a 1pp improvement in the current account balance lowers r* by 7bp (and by 20bp in EM economies). We find no independent role for a range of other factors, including GDP growth, government balances, and government debt levels.

  • Our results suggest that the returns from macroeconomic stabilisation are high. Economic convergence, lower inflation, and improved external balances provide a clear route to sustainably lower interest rates.

What Determines Cross-Country Differences in r*?

Estimating r*

The neutral real rate (r*) is the equilibrium real policy rate that is neither stimulatory nor contractionary, consistent with output at potential and stable inflation. It is an important anchor for both monetary policy and financial markets. However, it is not directly observable and can only be “seen by its works” (Williams (1931)).
Estimates of r* can either be derived from economic models or inferred directly from financial market pricing. The most widely used model-based estimates are provided by Holsten, Laubach, and Williams (2017, 2023). HLW estimate r* using two statistical relationships: the link between the monetary policy stance (r-r*) and changes in the output gap and the link between the output gap and inflation (the Phillips curve). Although widely used, a major drawback of the HLW approach is that the two empirical relationships that it relies on are relatively weak, limiting the robustness of its results. This is a serious problem for large, relatively closed economies – such as the US and the Euro area – but it presents an even bigger problem for smaller, relatively open economies, for which these relationships are even more difficult to discern in the data.
Market-based measures infer the level of r* from medium/long-dated nominal interest rates, to abstract from cyclical fluctuations, and these are then deflated to generate estimates of the neutral real rate. One key advantage of market-based estimates is that they can be applied uniformly across many countries, making them especially suited to cross-country studies of r*. These measures are not without their drawbacks: one criticism is that financial markets' perceptions of neutral are themselves influenced by central bank communication, potentially creating a ‘hall of mirrors’ in which policymakers and investors mutually reinforce each other’s perception of the neutral rate.[1] The main counter-argument to this view is that, if these distortions were long-lived, market participants would take the opportunity to borrow or lend at these rates until they re-converged to their equilibrium levels. Nevertheless, to limit potential distortions from this source, our analysis focuses on 5-year averages of our r* estimates.
We have chosen a relatively simple measure of the neutral real rate, to maximise the number of countries and the time period that we can cover with a uniform methodology. For the neutral nominal rate, we use the 3-years forward, 1-year rate (and the closest proxies thereof).[2] Where the data are incomplete, we extend the historical series using the estimated relation between 3Y1Y rates, 10-year government bond yields, and policy rates. We then deflate this nominal rate using long-term (6-10 year) inflation expectations from Consensus Economics, to generate a forward-looking neutral real rate. Our sample includes 12 DM economies and 24 EM economies and, where possible, we use data back to 2000.

Moving in Tandem with Global/US r*

Exhibit 1 displays our median neutral nominal policy rate estimates for EM and DM economies, together with the 25-75th percentiles.[3] These have moved largely in tandem with each other with a relatively stable spread, falling steadily from 2000 to a trough in 2020, before rising in the four years since then. As global inflation accelerated in the aftermath of the pandemic, estimated neutral nominal rates rose particularly rapidly in EM economies but have fallen back somewhat from a peak in 2022.

Exhibit 1: Market Estimates of Neutral Nominal Rates in EM and DM Have Moved (Largely) in Tandem, Falling to a Trough in 2020 Before Rising Again

Market estimates of neutral nominal rates; shaded areas mark 25-75th percentile
1. Market Estimates of Neutral Nominal Rates in EM and DM Have Moved (Largely) in Tandem, Falling to a Trough in 2020 Before Rising Again. Data available on request.
DM Sample: Australia, Canada, Euro area, Hong Kong, Japan, New Zealand, Norway, Singapore, Sweden, Switzerland, United Kingdom, United States; EM Sample: Brazil, Chile, China, Colombia, Czech Republic, Hungary, India, Indonesia, Israel, Malaysia, Mexico, Peru, Philippines, Poland, Romania, Russia, Saudi Arabia, South Africa, South Korea, Taiwan, Thailand.
Source: Bloomberg, Haver Analytics, Goldman Sachs Global Investment Research
The pattern over the past 25 years is closely matched by estimated neutral real rates, although the spread between the two series is smaller, given that long-term inflation expectations tend to be higher for EM economies (Exhibit 2). EM inflation expectations declined in the early 2000s but, from the mid-2000s onwards, median EM inflation expectations have stabilised around 3.0% vs. 2.0% for DM economies.

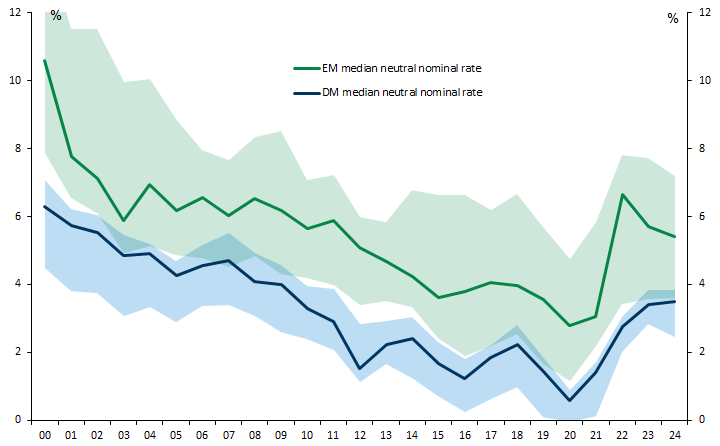
Exhibit 2: EM and DM Neutral Real Rates Have Also Moved in Tandem, With Long-Term Inflation Expectations Broadly Stable

Market estimates of neutral real rates based on 3y1y swap rates and long-term inflation expectations; shaded areas mark 25-75th percentile
2. EM and DM Neutral Real Rates Have Also Moved in Tandem, With Long-Term Inflation Expectations Broadly Stable. Data available on request.
DM Sample: Australia, Canada, Euro area, Hong Kong, Japan, New Zealand, Norway, Singapore, Sweden, Switzerland, United Kingdom, United States; EM Sample: Brazil, Chile, China, Colombia, Czech Republic, Hungary, India, Indonesia, Israel, Malaysia, Mexico, Peru, Philippines, Poland, Romania, Russia, Saudi Arabia, South Africa, South Korea, Taiwan, Thailand.
Source: Bloomberg, Haver Analytics, Consensus Economics, Goldman Sachs Global Investment Research
Exhibit 3 displays EM and DM (ex US) median neutral rate spreads vs. the US. While these have fluctuated from year to year, the fluctuations have taken place around relatively stable averages. Country-specific spreads have fallen in some counties and risen in others, but they have remained largely stable in aggregate.
For DM economies, median neutral nominal and real rates have typically been slightly (0.0-0.5pp) below US levels, reflecting low neutral rates in several DM economies, including Japan, the Euro area, Switzerland, and Sweden.

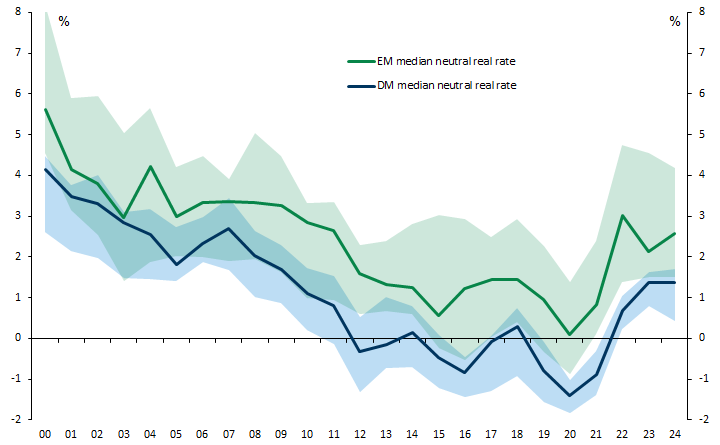
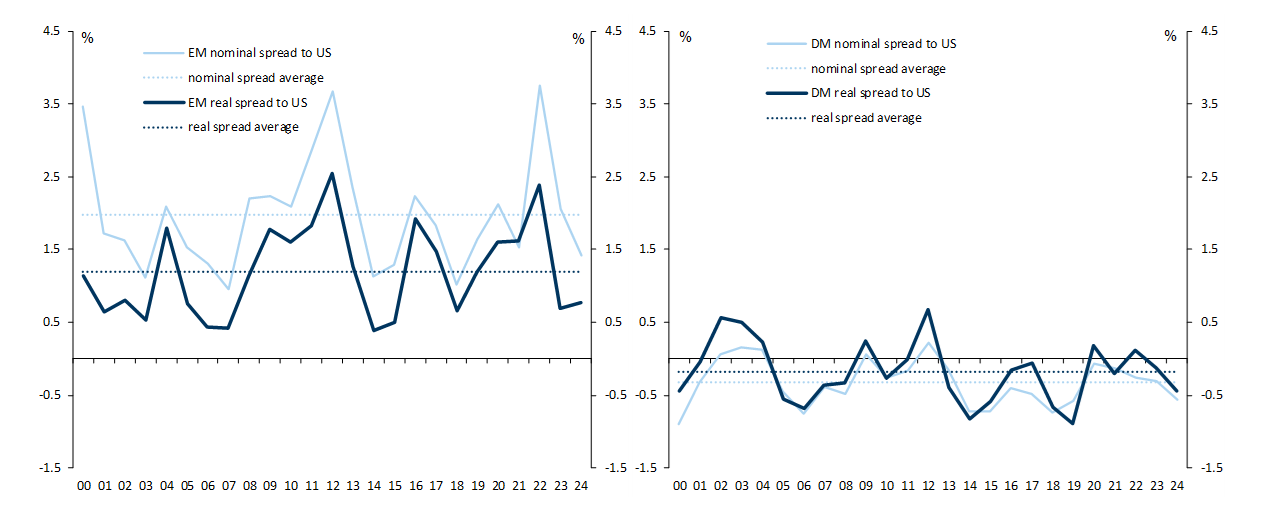
Exhibit 3: The Spread vs. US for Both EM and DM Neutral Rates Fluctuates from Year to Year, But Around a Mean that Has Remained Stable

EM median neutral rate speads (nominal and real) to the US
3. The Spread vs. US for Both EM and DM Neutral Rates Fluctuates from Year to Year, But Around a Mean that Has Remained Stable. Data available on request.
EM Sample: Brazil, Chile, China, Colombia, Czech Republic, Hungary, India, Indonesia, Israel, Malaysia, Mexico, Peru, Philippines, Poland, Romania, Russia, Saudi Arabia, South Africa, South Korea, Taiwan, Thailand; DM Sample: Australia, Canada, Euro area, Hong Kong, Japan, New Zealand, Norway, Singapore, Sweden, Switzerland, United Kingdom
Source: Bloomberg, Haver Analytics, Consensus Economics, Goldman Sachs Global Investment Research
That EM and DM neutral real rates have moved in tandem over the past 25 years, with a spread versus the US that has remained relatively stable throughout, suggests that most of the movement in neutral rates has been driven by changes in US/global r*, which have an almost one-for-one impact on other economies.[4]

Accounting for Cross-Country Differences in r*

What drives cross-country differences in r*? Economists typically think of developments in neutral real interest rates as being driven by factors affecting the balance between saving and investment (such as potential growth, demographics, and government deficits) or changes in risk preferences.[5] In thinking of developments in global or US r*, this approach clearly makes sense.
However, in a world of integrated capital markets for government bonds, it is less clear that factors affecting domestic savings and investment are likely to be the dominant force affecting cross-country differences in r*, especially for small open economies. In such a world, it is useful to think of the neutral real interest rate as comprised of two parts: a global neutral real rate (for which US rates are often used as a proxy) and a country-specific risk premium. In this setting, developments in global/US neutral rates are still driven by factors affecting the balance between global saving and investment and changes in global risk preferences, but cross-country differences in r* are primarily driven by factors affecting country-specific risk premia. Such variables include: the level of economic development (GDP per capita), the level and/or volatility of inflation, and external balances.
In our analysis, we have considered both sets of variables, but we find that factors affecting country-specific risk premia play the dominant role in driving cross-country differences in r*.
Exhibit 4 displays the neutral real rate spread vs. the US, averaged over the past five years (2020-24). This spread has ranged from negative in several DM economies to more than 10pp in some high-yield EM economies that have experienced major currency weakness (Turkey and Egypt). (In the Appendix, we provide a regional breakdown for EMs dating back to 2000.)

Exhibit 4: The Market's Estimate of Neutral Real Rates -- From a Low in Japan to a High in Turkey

Neutral real rate spreads to US, 2020-24 average
4. The Market's Estimate of Neutral Real Rates -- From a Low in Japan to a High in Turkey . Data available on request.
Source: Bloomberg, Haver Analytics, Consensus Economics, Goldman Sachs Global Investment Research
One indication of the drivers of these cross-country differences is provided by simple cross-sectional scatter plots (Exhibit 5). These suggest that neutral rates tend to be (i) lower in rich economies (top left); (ii) higher in high-inflation economies, reflecting inflation risk premia (top right); (iii) lower in countries running current account surpluses (bottom left); and (iv) lower in countries with healthy government balances (bottom right).

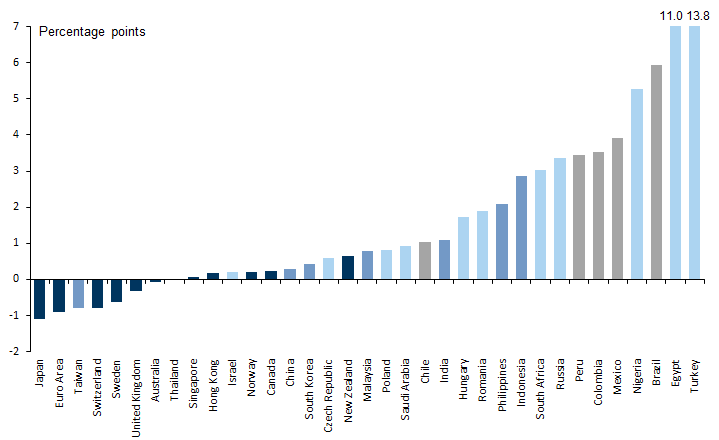
Exhibit 5: Neutral Real Rates Are Lower in Rich Countries, Higher in High-Inflation Economies, And Lower with Healthy Current Account and Government Balances

Average market-implied neutral rates against various macroeconomic indicators, 2000-24
5. Neutral Real Rates Are Lower in Rich Countries, Higher in High-Inflation Economies, And Lower with Healthy Current Account and Government Balances. Data available on request.
Light blue line fits EMs, dark blue fits DMs, and green covers all countries
Source: IMF, Haver Analytics, Consensus Economics, Goldman Sachs Global Investment Research
Some of these variables (and others that we have also tested) are often closely related to each other, so scatter plots on their own will not reveal the independent information that each contains. Therefore, to explore these relationships more formally, we ran a series of regressions using these and other variables, in an OLS panel set up using 5-year averages (Exhibit 6).
We find that most of the cross-country variation in neutral real rates is accounted for by three factors: GDP per capita levels, inflation, and current account balances.[6] In the last regression, we included a series of DM dummies to see whether there were significant differences in the determinants of r* between DM and EM economies. The results imply that GDP per capita and current account balances are a significantly more important factor for EMs than for DMs (i.e., EMs are 'punished' with higher equilibrium interest rates for running current account deficits, in a way that DMs are not).
Taken together, our results imply that a 10pp convergence in GDP per capita lowers neutral real rates (r*) by 12bp (all else equal), 1pp higher average inflation raises r* by 33bp, and a 1pp improvement in the current account balance lowers r* by 7bp (and by 20bp in EM economies).

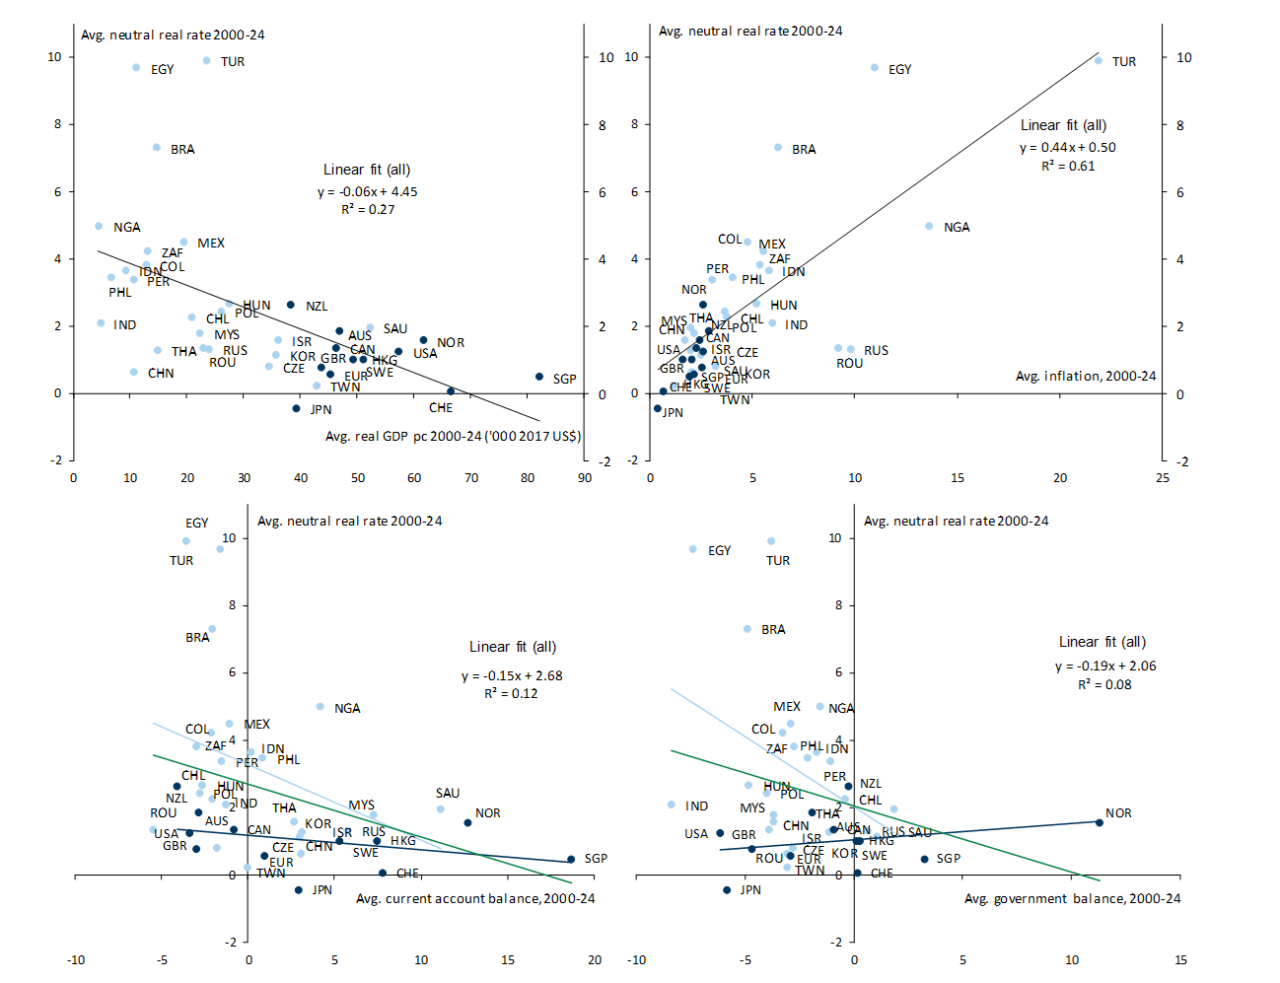
Exhibit 6: GDP Per Capita, Inflation and Current Account Balances Account for Most of the Variation in Neutral Real Rates

Estimates from an OLS panel regression based on 5-year averages
6. GDP Per Capita, Inflation and Current Account Balances Account for Most of the Variation in Neutral Real Rates. Data available on request.
Standard errors are heteroscedastically robust
Source: Goldman Sachs Global Investment Research
In some cases, what has not had a role in determining cross-country differences in r* is as interesting as what has had a role. In closed-economy models, potential growth is viewed as a key determinant of r*, but we find no role for relative growth performance in our regressions.[7] We also found no independent role for government balances (other than via their effect on current account balances) and government debt levels.

High Returns to Macroeconomic Stabilisation

Our results suggest that the returns to macroeconomic stabilisation are high. In the traditional closed-economy model, rapid economic growth comes partly at the cost of higher equilibrium real interest rates.[8] However, if high real rates primarily reflect elevated risk premia (due to high inflation, large current account deficits, etc.), this implies a greater potential payoff from good macroeconomic policies.
With open economies and integrated government bond markets, economic convergence, lower inflation, and improved external balances provide a clear route to sustainably lower interest rates and a lower cost of capital, thereby raising potential growth. This channel works in the opposite direction and with opposite effects to the way we usually think of the correlation between potential growth and r*.
Turkey is an interesting case study in this respect because, as an economy with (1) strong growth and (2) high real rates, it has often been tempting to conclude that (1) caused (2). However, several countries have exhibited even stronger growth but with lower equilibrium rates (e.g., India and China). Our findings suggest that Turkey can bring about sustainably lower real interest rates by bringing down inflation and re-balancing its economy.
Kevin Daly and Holger Harmsen*
*Holger is an intern in the CEEMEA Economics team

Appendix: EM Regional Breakdown

EM Regional Breakdown

Exhibit 7 provides a regional breakdown of the median neutral real rate spread to US for LatAm, Asia, and CEEMEA. The estimated neutral real rate spread vs. the US is large and positive across LatAm economies (with the exception of Chile). The median spread has fallen materially in Asia since 2020, while the picture in CEEMEA has been more varied, both across countries and across time.

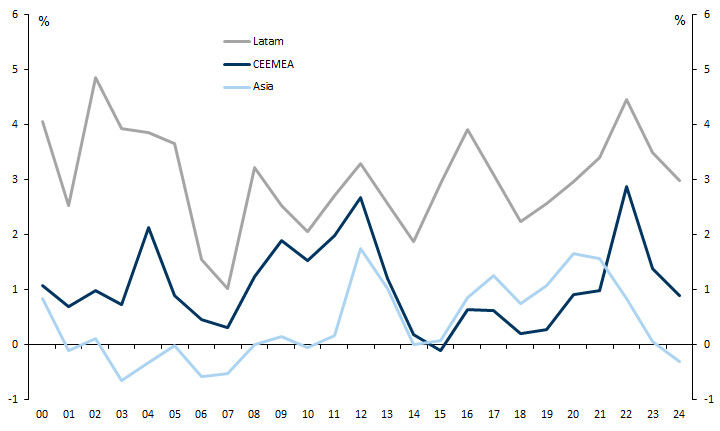
Exhibit 7: Neutral Real Rates Are Higher in LatAm Than in CEEMEA, and Lowest in Asia

Median neutral real rate spread to US by region
7. Neutral Real Rates Are Higher in LatAm Than in CEEMEA, and Lowest in Asia. Data available on request.
LatAm Sample: Brazil, Chile, Colombia, Mexico, Peru; CEEMEA Sample: Czech Republic, Hungary, Israel, Poland, Romania, Russia, Saudi Arabia, South Africa; Asia Sample: China, India, Indonesia, Malaysia, Philippines, South Korea, Taiwan, Thailand.
Source: Bloomberg, Haver Analytics, Consensus Economics, Goldman Sachs Global Investment Research
  1. 1 ^ See Rungcharoenkitkul and Winkler (2022).
  2. 2 ^ We have focused on 3Y1Y rates as our proxy for the market’s assessment of neutral rates because this is the most actively traded and liquid expression of the market’s view on short-term rates at a medium-term horizon. However, other forward-rate expressions produce similar results.
  3. 3 ^ For the time-series charts (Exhibits 1-3), we only include the countries for which we have the full 25-year sample.
  4. 4 ^ This finding fits closely with a previous study by Clemens Grafe and Sara Grut that focused on neutral interest rates in CEEMEA economies.
  5. 5 ^ For a discussion of the estimated effects of each of these factors on US r*, see “What Have We Learned About the Neutral Rate?”, US Economics Analyst, 5 June 2023.
  6. 6 ^ Government balances have a significant role in single-variable regressions but this significance disappears when they are included together with current account balances. We do not find this surprising: the current account balance is the sum of public and private balances, so the result implies that that whole-economy balance (i.e., the current account) is a more important determinant of neutral rates than the government balance on its own.
  7. 7 ^ This result is consistent with the findings of a previous study by Jan Hatzius, Nicholas Fawcett, and Jari Stehn, who found that the link between growth and equilibrium real rates in DM economies has been weak (“Depressed R* Narrative: On Shaky Ground”, Global Economics Analyst, 29 November 2016).
  8. 8 ^ A result that follows directly from the Euler equation.

Investors should consider this report as only a single factor in making their investment decision. For Reg AC certification and other important disclosures, see the Disclosure Appendix, or go to www.gs.com/research/hedge.html.