Global equities had a drawdown in August and have remained volatile since. Equity drawdowns are a common feature, but their size and frequency has varied over time - risk-adjusted returns were unusually high in the last 12 months.
While 'buy the dip' has been a successful strategy since the GFC, its success has been mixed over long horizons as often equity drawdown risk lingers. If an equity drawdown comes alongside a fast and broad de-risking across assets, i.e., our Risk Appetite Indicator (RAI) drops near -2 or below, or a material valuation de-rating, the asymmetry to 'buy the dip' is usually positive.
However, our RAI remains well above -2 and the valuation de-rating so far has been limited - thus, the asymmetry is not much better and macro momentum remains mixed. To better understand risks from here, we have developed a framework to assess the likelihood of equity drawdowns.
Strong price momentum as well as negative inflation levels and momentum (allowing for central bank easing) point to lower drawdown risk, while recent negative growth momentum and elevated Shiller P/Es point to elevated risk. The negative growth momentum suggests a larger probability of a >10% correction - recent higher equity volatility also points in this direction.
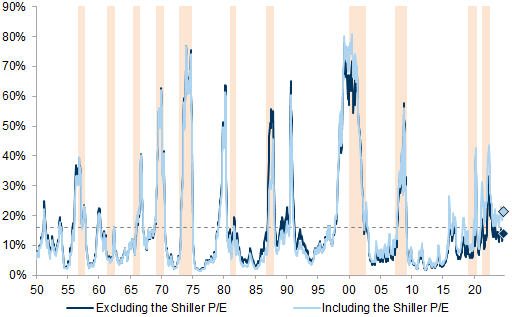
Combining all variables indicates that drawdown risk has picked up but remains relatively low at around 20% - historically, levels above 30% indicate a clear warning signal. In addition, valuations are a key driver of elevated drawdown risk - ignoring the absolute Shiller P/Es level points to lower risk.
With elevated equity valuations, mixed macro momentum and rising policy uncertainty, there is the risk of more equity drawdowns, in our view. As a result, we believe risk-adjusted returns for equities are likely to be lower into year-end. However, we think the risk of a bear market remains low with relatively low recession risk, helped by a healthy private sector and central bank easing.
While 60/40 portfolios have performed well since the summer, already dovish Fed pricing and upward pressure on term premia might mean a smaller bond buffer from here. Alternative safe havens such as Gold, Yen and CHF are likely to provide more diversification benefits. Higher vol of vol also increases the value of option hedges, in our view - we like selling upside on bonds to buy equity puts.
The lowdown on the risk of an(other) equity drawdown
Summertime sadness - global equities have a drawdown
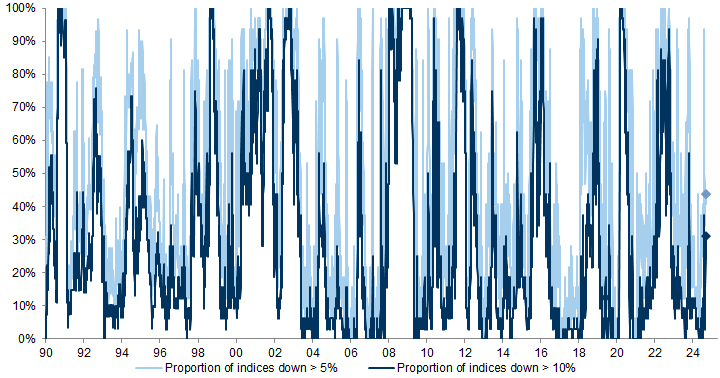
Exhibit 1: In August 94% of equity indices had a drawdown of 5% or more
No risk, no return - equity drawdowns are relatively common
Exhibit 2: Equity drawdowns were relatively common across markets and large ones usually were around recessions
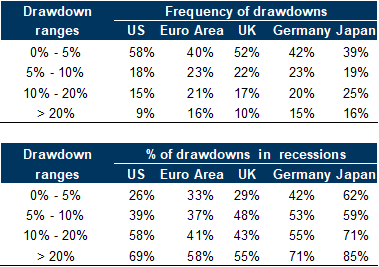
Exhibit 3: Bull markets have been longer since the 1990s
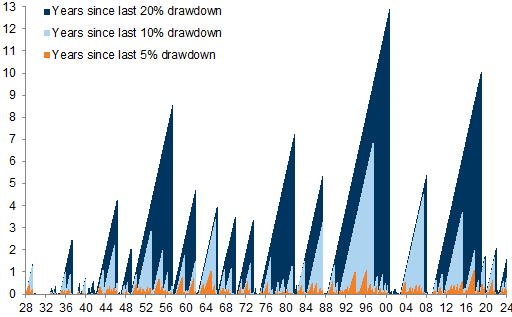
Exhibit 4: Bear markets and corrections have been less frequent since the 1990s
Buy the dip or sell the rip - drawdowns can be a buying opportunity
Exhibit 5: Since 2010 buying the 10% dip has been very successful
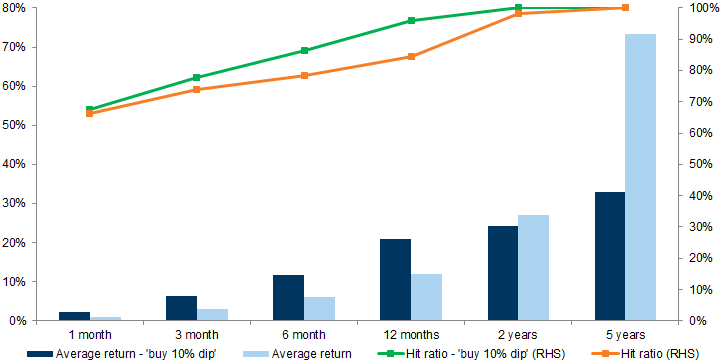
Exhibit 6: Since 1990, buying the 10% dip has been less successful
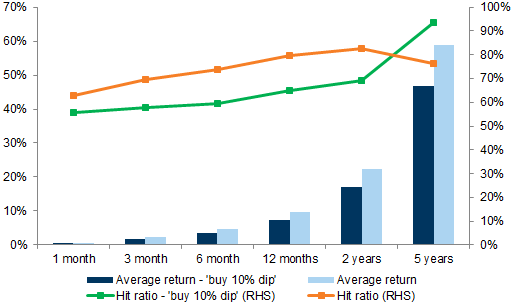
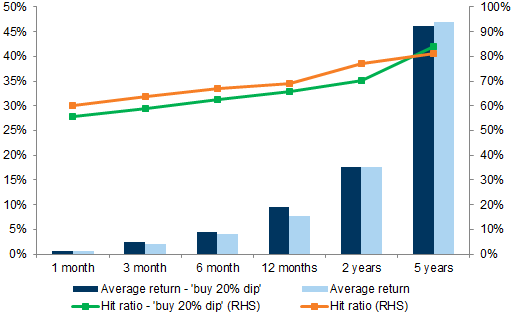
Exhibit 7: Since 1928, buying the dip has been less successful
Large equity drawdowns often create better asymmetry
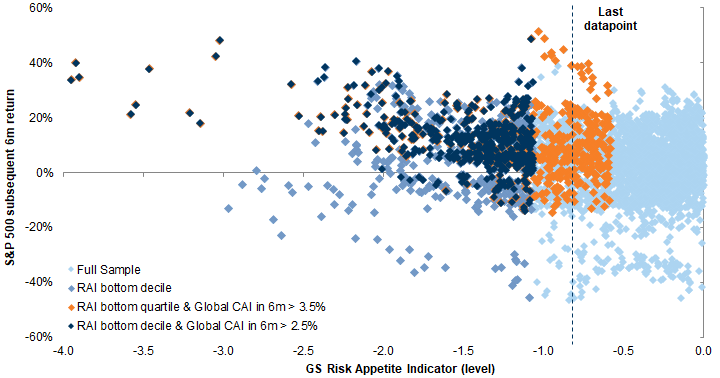
Sharp declines in our Risk Appetite Indicator indicate breadth in de-risking
Exhibit 8: After large declines in risk appetite, there are usually fewer S&P 500 drawdowns
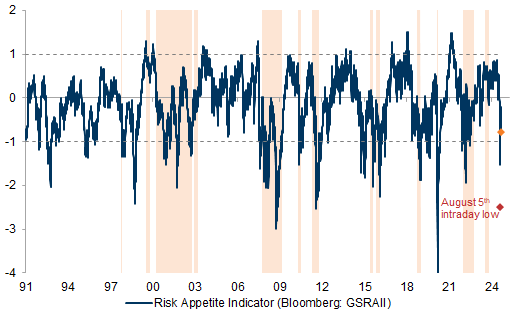
Exhibit 9: From low levels of our RAI, the asymmetry to add risk improves
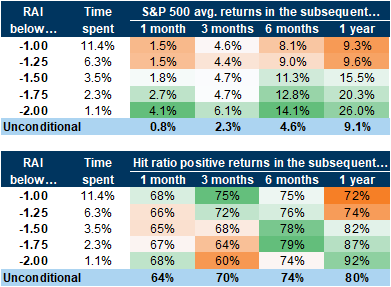
Exhibit 10: Positive asymmetry for equity returns in the next 6 months from the current levels of our RAI improves if growth holds up
Material valuation de-rating improves asymmetry for equities
Exhibit 11: During equity drawdowns, valuations usually de-rate
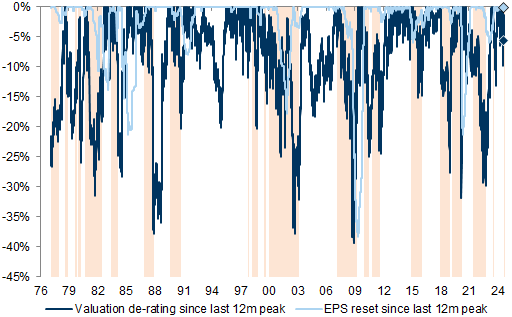
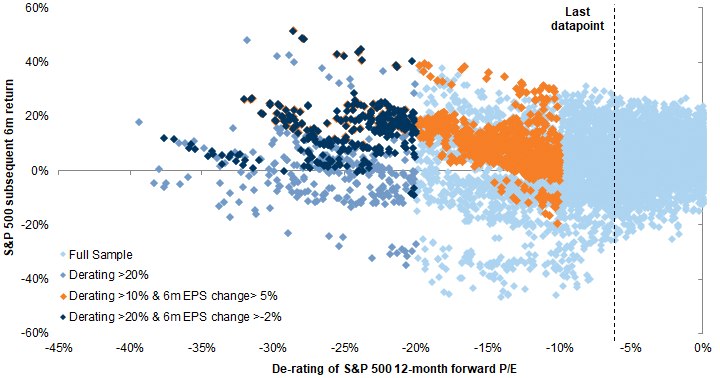
Exhibit 12: Large valuation de-ratings create positive asymmetry
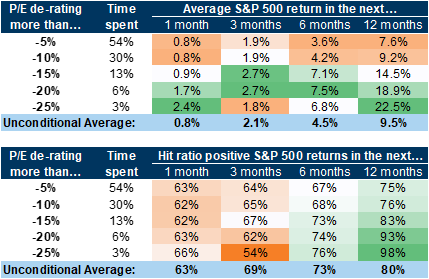
Exhibit 13: Valuation de-ratings of more than 20% without a profit recession have been a buying opportunity - smaller de-ratings (10-20%) require positive earnings growth to mitigate negative tails
The lowdown on the risk of an(other) equity drawdown
Business cycle scores, i.e., levels and momentum of the growth, inflation and policy scores.
Sentiment cycle metrics, i.e., Risk Appetite Indicator (RAI), S&P 500 realised volatility (1-month and 3-month) and price momentum metrics (6-month and 12-month trend).
Valuations, both the S&P 500 Shiller P/E outright, vs. 10- and 20-year average and relative to their macro fair value (for details see Global Strategy Paper: The Strategic Balanced Bear).
Leading growth indicators such as Leading Economic Indicator (LEI)[1], ISM manufacturing survey and components and economic policy uncertainty.
Exhibit 14: Negative macro and market momentum matter most for near-term drawdown risk, valuations and the business cycle drive latent drawdown risk
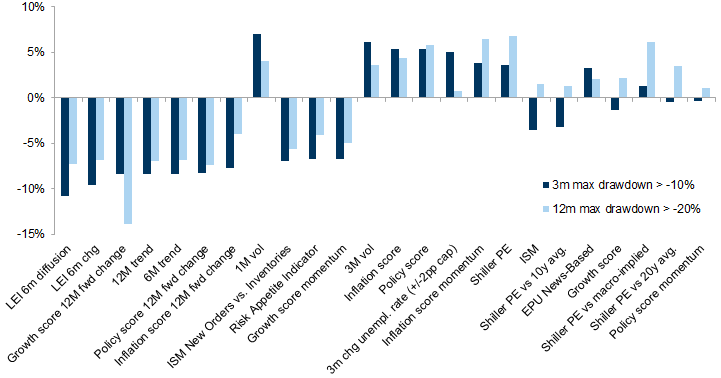
Exhibit 15: Weaker growth momentum, elevated valuations and tight policy drive higher risk of large drawdowns in the next 12 months, while negative inflation momentum and the positive trend reduce it
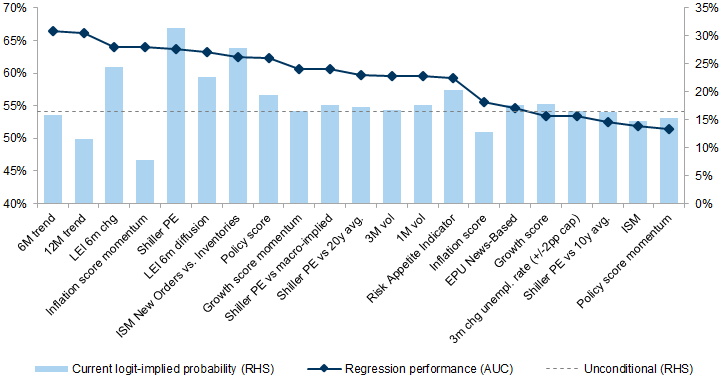
Exhibit 16: Negative growth momentum coupled with increased volatility increases near-term drawdown risk, while the positive trend lowers it
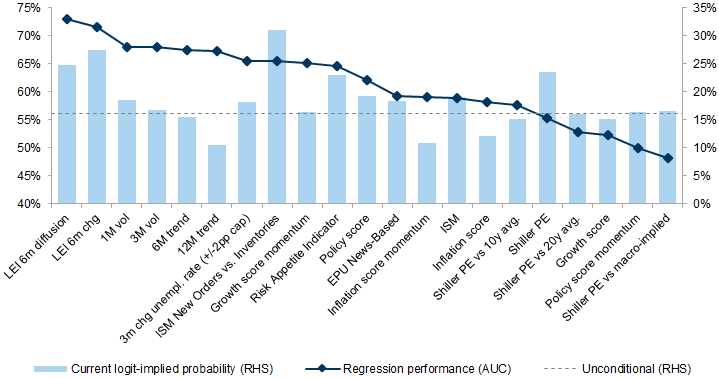
Exhibit 17: Equity drawdown risk has picked up in the past few months but remains relatively low
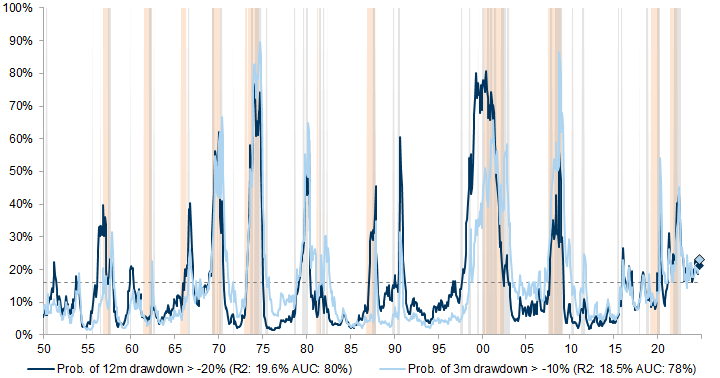
Exhibit 18: Valuations are contributing most to the recent increase in the risk of larger drawdowns
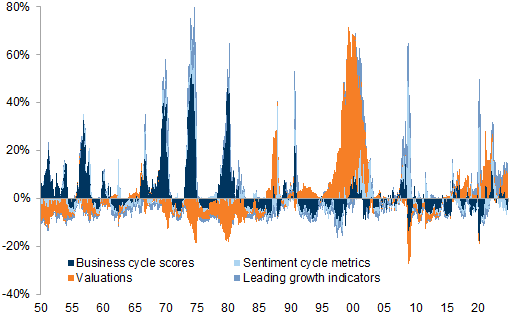
Exhibit 19: Excluding valuations points to bear market risk in line with the unconditional probability
Asset allocation implications - better balance but value in alternative safe havens and convexity
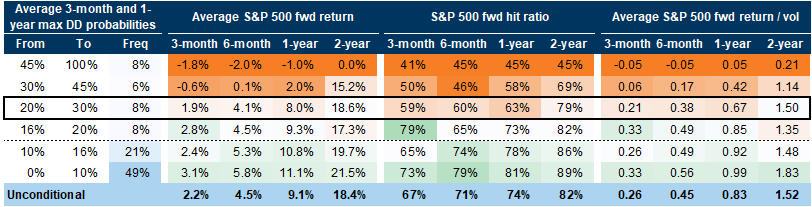
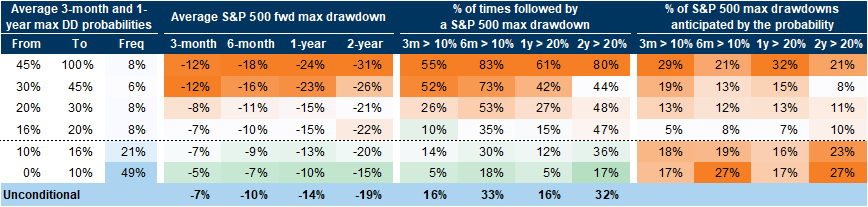
Exhibit 20: Equity drawdown probabilities above 30% historically have resulted in lower risk-adjusted returns
Better balance - 60/40 and risk parity portfolios had smaller drawdowns
Exhibit 21: 60/40 portfolios have performed well in the summer
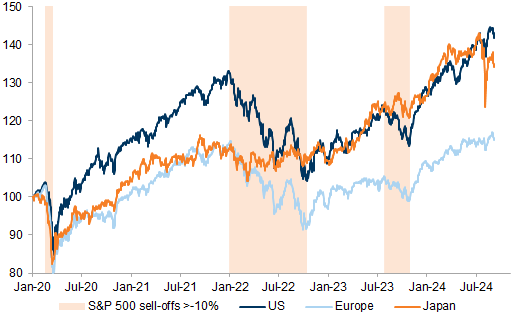
Exhibit 22: Risk parity strategies' performance has been particularly steady (outside Japan)
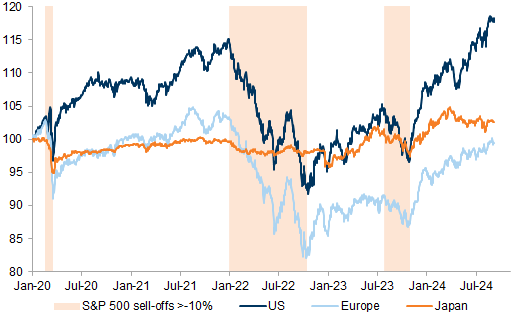
Exhibit 23: 3m rolling equity/bond correlation of weekly returns
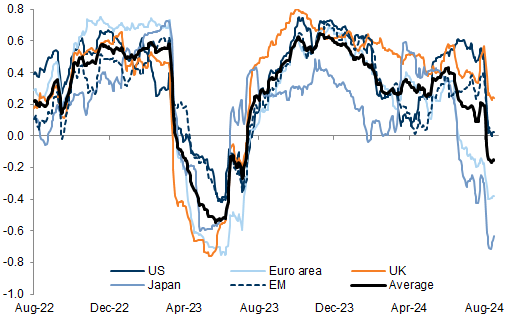
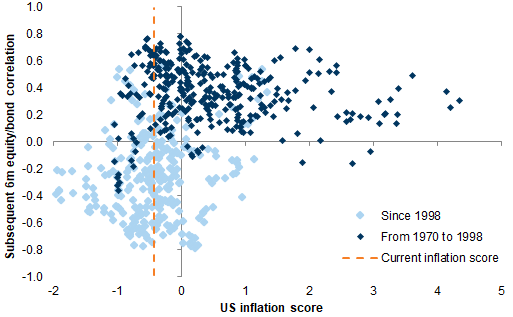
Exhibit 24: Inflation normalisation supports more negative equity/bond correlations
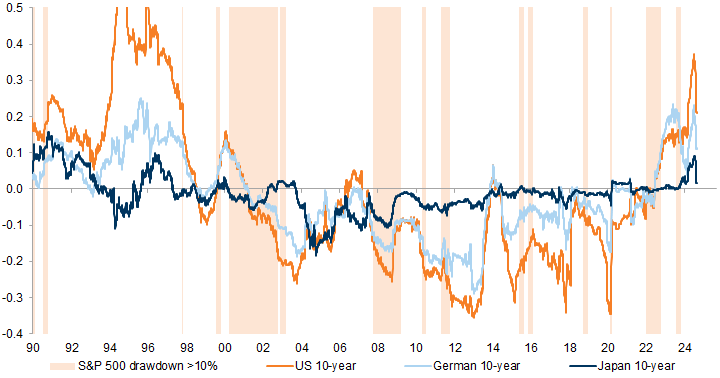
Limited bond buffer - less negative equity beta for long-dated bonds
Exhibit 25: Bonds able to buffer equities better from here with higher yields and lower inflation
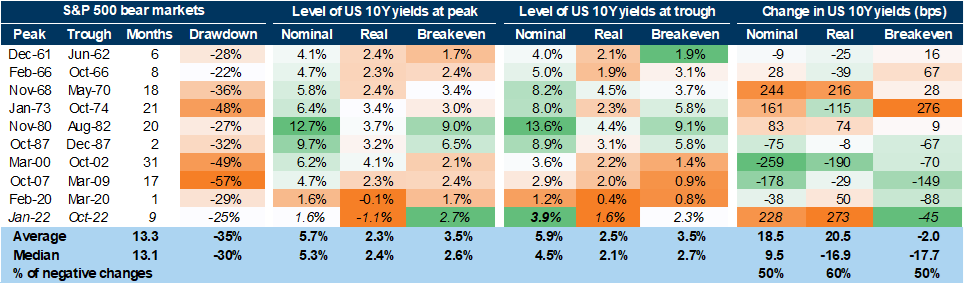
Exhibit 26: Markets are already pricing a large amount of Fed cuts in the next 12 months
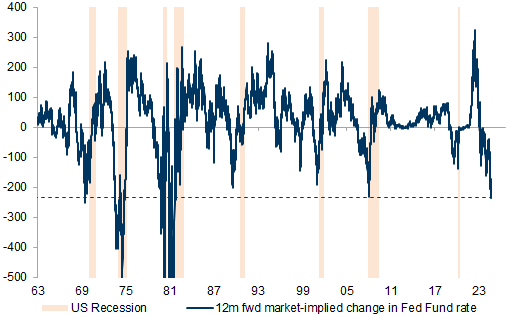
Exhibit 27: Yield curves might steepen more with upward pressure on bond term premia
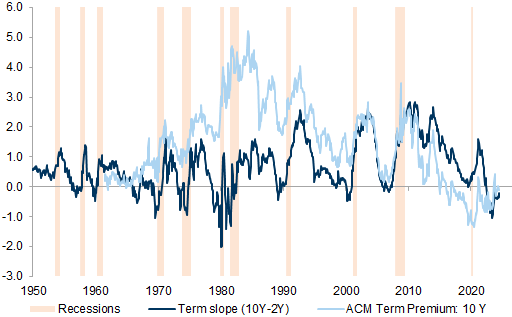
Exhibit 28: The bond buffer in Europe was already lower before the COVID-19 crisis
Less diversification desperation with inflation normalisation
Exhibit 29: Bonds have provided a relatively good buffer from equities in the recent S&P 500 drawdown
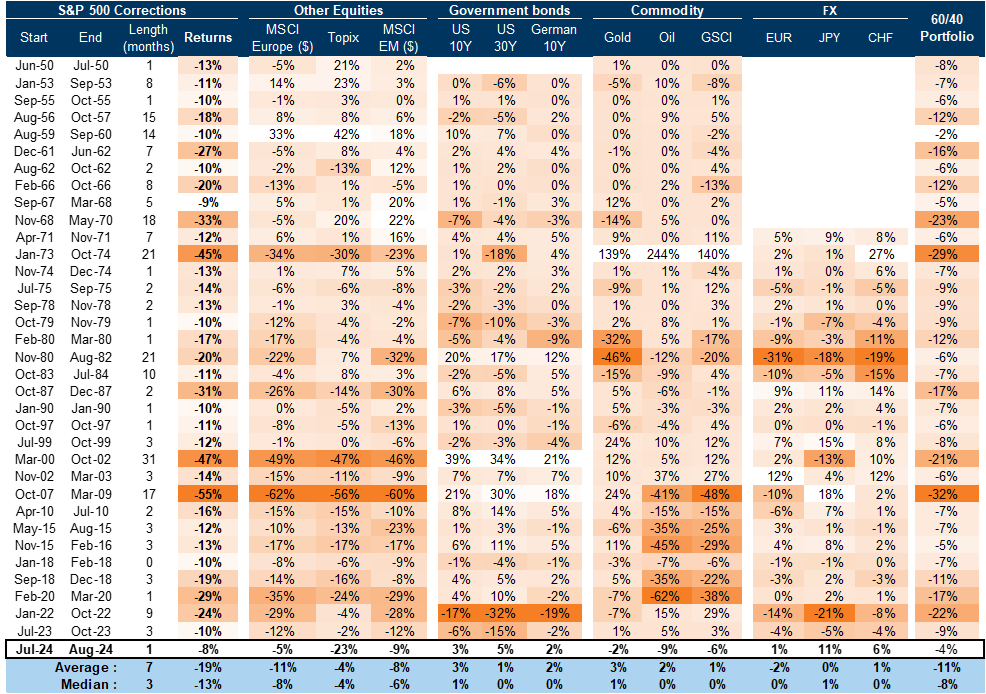
Exhibit 30: Gold became more correlated with equities in 2022 as both suffered from higher real yields
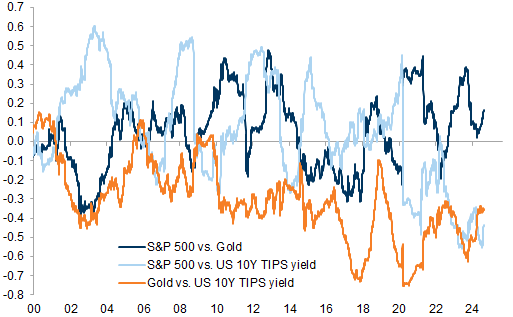
Exhibit 31: Yen and Swiss Franc have become less 'risk off', the Dollar more so
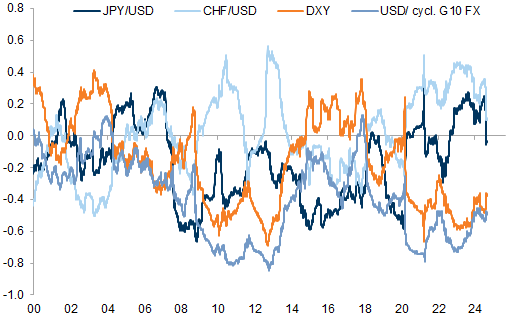
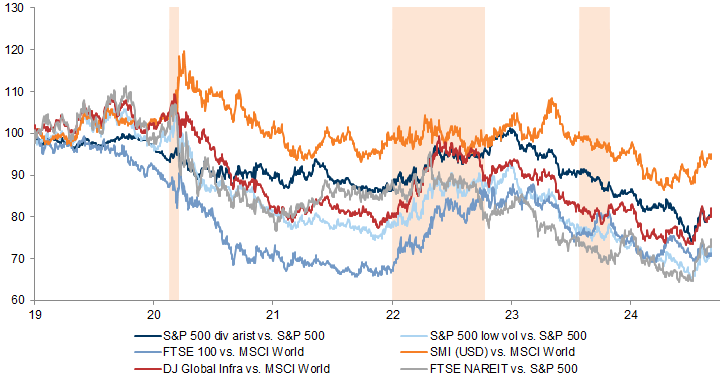
Exhibit 32: Defensive areas within equities have de-rated since the COVID-19 crisis
Convexity comeback - growing value of options, prefer risky asset hedges
Exhibit 33: Vol of vol has started to pick up from low levels in the post COVID-19 recovery
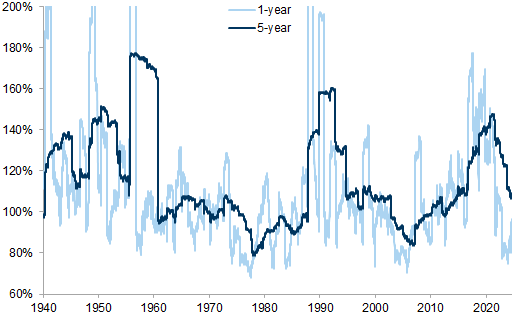
Exhibit 34: Implied vol of vol indicates more negative convexity in equities
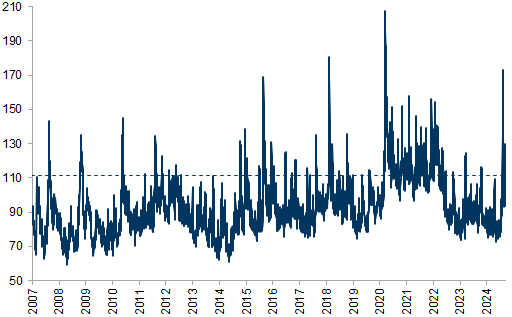
Exhibit 35: Equity volatility increased more than rates volatility during the recent volatility spike, but resettled again afterwards
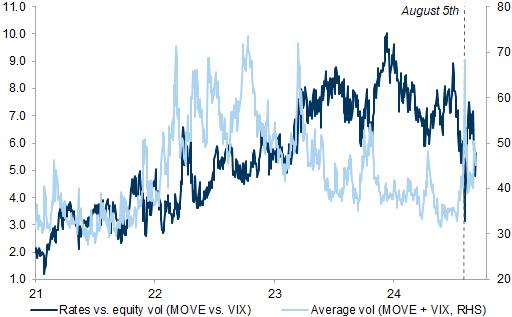
Exhibit 36: Selling TLT calls can reduce the cost of buying equity puts
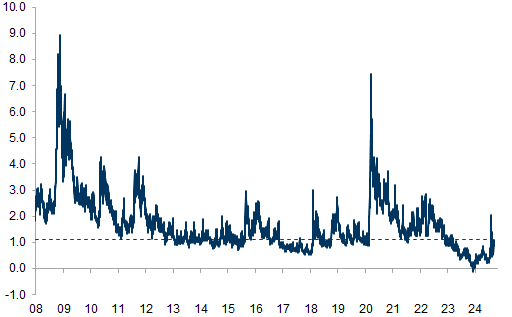
Exhibit 37: Options on US bonds, safe haven FX are pricing more risk-off asymmetry, less in the dollar, US equity, gold
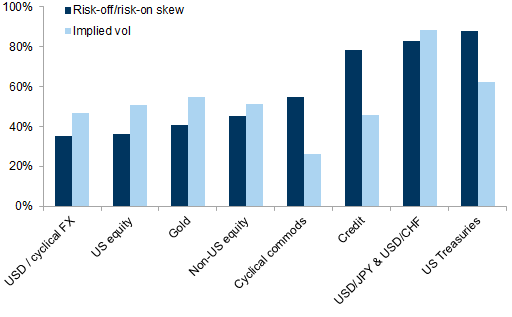
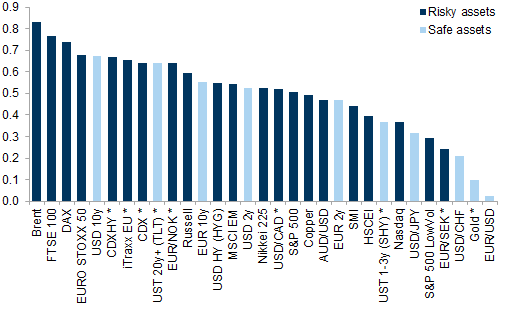
Exhibit 38: Vol on risky assets, e.g., DAX, CDS, looks attractive to hedge a growth shock
Appendix: Modelling equity drawdown risk
Exhibit 39: T-stat and goodness-of-fit measures for the univariate logit models estimated on the maximum available history since 1950
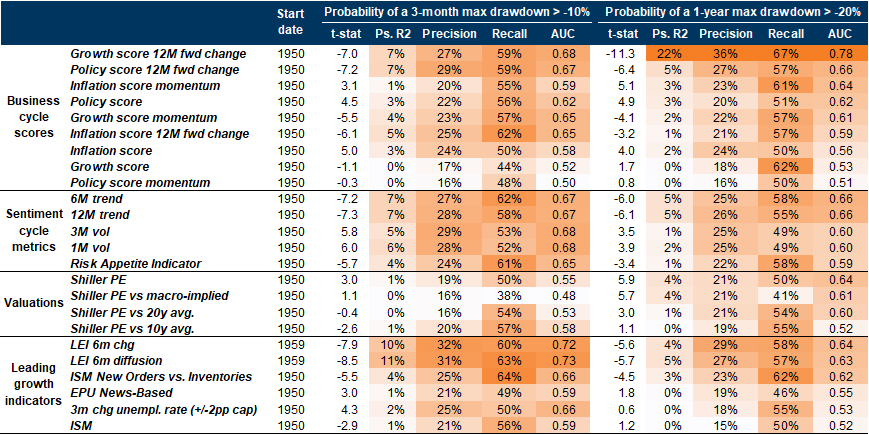
Exhibit 40: Equity drawdown probabilities above 30% tend to have good predictive power for subsequent drawdowns
- 1 ^ In-line with the Conference board's 3Ds rule, we use the 6-month change in the LEI and LEI dispersion (for details see https://www.conference-board.org/topics/us-leading-indicators).
Investors should consider this report as only a single factor in making their investment decision. For Reg AC certification and other important disclosures, see the Disclosure Appendix, or go to www.gs.com/research/hedge.html.
Gallery
View all 40 exhibits