Goldman Sachs Research
Global Economics Comment: What Prompts DM Pivots to Sequential Cuts? (Briggs/Peters)
24 September 2024 | 12:56PM EDT | Research | Economics| By Jan Hatzius and others
More
  • Several central banks—including the BoC, RBNZ, Riksbank, and the Fed—have started cutting sequentially, and we expect several others (including the ECB and BoE) to do so soon. In this comment we review the data dashboards that led central banks to pivot to sequential cuts so far and discuss the implications for central banks that have not.

  • Data dashboards around pivots toward sequential cuts show three patterns. First, countries so far have only pivoted following substantial progress on core inflation and wage growth. Second, countries that have pivoted generally had larger policy rate overshoots relative to Taylor rule implied levels and higher real interest rates. Third, countries that have pivoted experienced a marked rise in unemployment and/or a downside growth surprise that raised concerns around the GDP outlook.

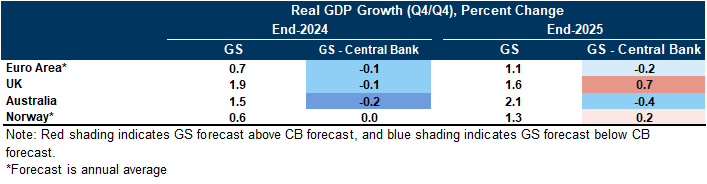
  • Under our forecasts, the Euro area will reach the average levels of core inflation and wage growth that permitted pivots in 2024Q4, followed by the UK and Australia in 2025H1. Moreover, our GDP forecasts are bearish relative to central bank expectations across all three economies. These patterns support our forecasts for a shift to sequential cuts for both the ECB (starting in December) and BoE (November). And while we continue to expect quarterly cuts in Australia and Norway, we expect that progress on inflation will keep the door open to an acceleration in rate cuts in the event of even moderate downside growth surprises.

What Prompts DM Pivots to Sequential Cuts?

Several central banks—including the BoC, RBNZ, Riksbank, and the Fed—have started cutting sequentially (or signaled an intent to deliver sequential rate cuts), and we expect several others (including the ECB and BoE) to do so soon. In this Global Economics Comment we review the data dashboards that led central banks to pivot to sequential cuts so far and discuss the implications for central banks that have not.
For central banks that have pivoted toward sequential cuts, we define the dates of pivots based on when 1) central bank commentary signaled an intent to cut sequentially or 2) economic data drove market pricing to a clear per-meeting cut baseline. Based on these criteria, we consider July central bank meetings as the points of pivot for the BoC (July 24) and RBNZ (July 10), the June CPI release as the point of pivot for the Riksbank (July 12), and the July employment report as the point of pivot for the Fed (August 2). Market pricing moved sharply around these dates, with end-24 policy rate pricing on average shifting down by 27bp (Exhibit 1).

Exhibit 1: End-2024 Market Pricing Shifted Down by 27bp Around Central Bank Pivots to Accelerated Cuts

1. End-2024 Market Pricing Shifted Down by 27bp Around Central Bank Pivots to Accelerated Cuts. Data available on request.
Source: Haver Analytics, Goldman Sachs Global Investment Research, Bloomberg
Next, we compare the data dashboards in Canada, New Zealand, Sweden, and the US at these pivot dates with the current data dashboard in DM economies where a pivot has not yet occurred (the Euro area, UK, Australia, and Norway). This highlights three patterns.
First, DMs that have pivoted did so once core inflation showed significant progress, with year-over-year core inflation having fallen to 2.79% on average, and only the RBNZ moving toward sequential cuts while inflation was above 3% (left chart, Exhibit 2).[1] Among economies where central banks haven’t shifted toward sequential cuts yet, inflation has only made a similar amount of progress in the Euro area, with core inflation remaining above 3% in the UK, Australia, and Norway.
Year-over-year wage growth similarly showed more progress, dropping to 4.1% on average at the time of pivot (vs. 4.5% current average in economies where central banks haven’t pivoted; right chart, Exhibit 2). This pattern suggests that an expectation of further inflation progress likely contributed to the decision to accelerate rate cuts.

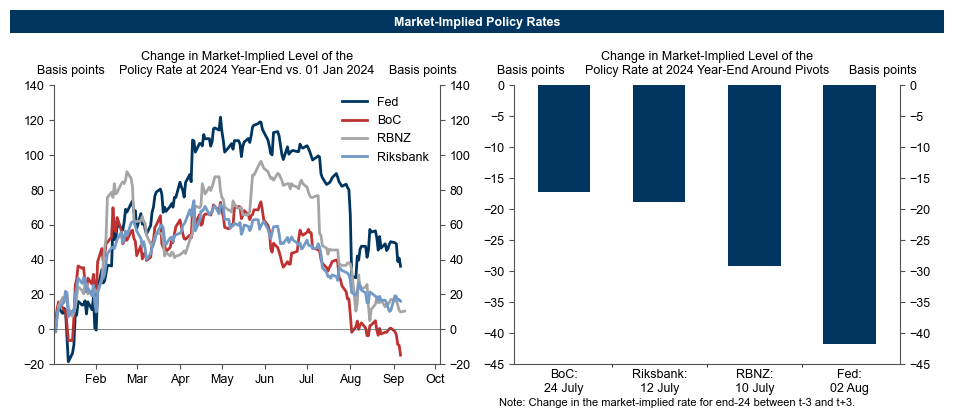
Exhibit 2: Pivots Toward Sequential Cuts Occurred Following Significant Inflation and Wage Growth Progress

2. Pivots Toward Sequential Cuts Occurred Following Significant Inflation and Wage Growth Progress. Data available on request.
Source: Goldman Sachs Global Investment Research, Haver Analytics
Second, countries that pivoted generally had larger policy rate overshoots relative to Taylor rule implied levels and higher real interest rates. The left chart of Exhibit 3 shows that policy rates in major DMs that pivoted were on average 0.9pp above the level implied by our country team’s preferred Taylor rule, while policy rates in other economies are currently roughly in line with Taylor rule implied levels. The right chart in Exhibit 3 similarly shows that real policy rates—defined as the difference between nominal rates and current headline inflation—were over 1pp above our real terminal rate forecasts at points of pivot but remain somewhat below these levels (particularly in Australia) in economies that have yet to move toward sequential cuts.

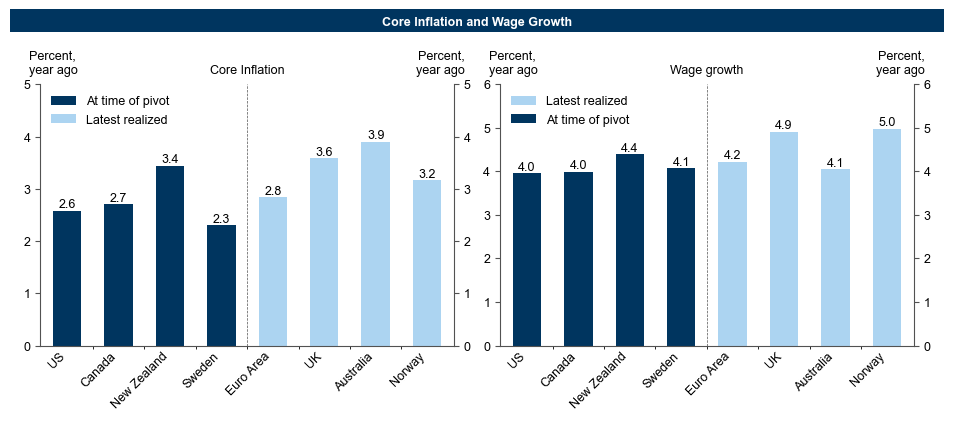
Exhibit 3: Pivots Toward Sequential Cuts Occurred When Taylor Rule Implied and Real Rates Were Very Elevated

3. Pivots Toward Sequential Cuts Occurred When Taylor Rule Implied and Real Rates Were Very Elevated. Data available on request.
Source: Haver Analytics, Goldman Sachs Global Investment Research
Third, countries that pivoted all did so after a deterioration in activity indicators. The left chart of Exhibit 4 shows that unemployment rates in major DMs that pivoted had risen by 1.3pp on average, while unemployment rates in other economies have been more moderate. Furthermore, the right chart of Exhibit 4 shows that pivots in the US and Canada both occurred following notable declines in our MAP indices, suggesting that downside growth surprises likely raised concerns around the growth outlook and catalyzed the acceleration in policy normalization.

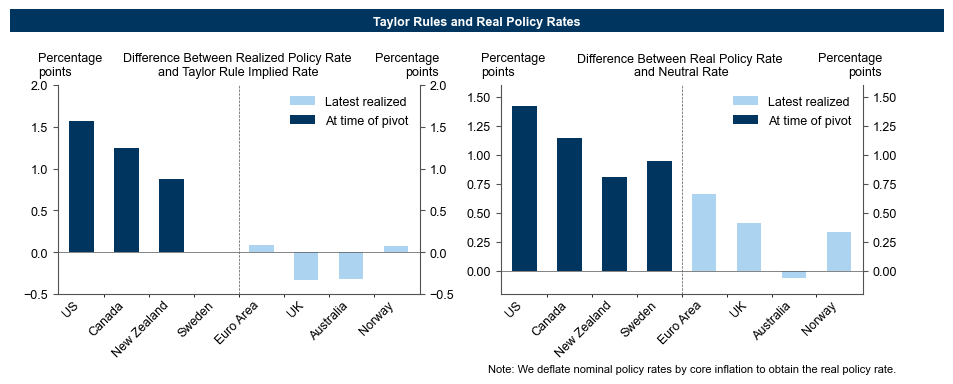
Exhibit 4: Deterioration in Unemployment and Activity Indicators Prompted Pivots Toward Sequential Cuts

4. Deterioration in Unemployment and Activity Indicators Prompted Pivots Toward Sequential Cuts. Data available on request.
Source: Haver Analytics, Goldman Sachs Global Investment Research
These data dashboards confirm the intuitive pattern that sufficient inflation progress is a necessary condition for DM central banks to move toward sequential cuts, while concerns around real rates and downside growth risks provide the catalyst to do so. What do these patterns imply for the possibility of an acceleration in policy normalization for DM central banks that haven’t pivoted yet?
Under our country team’s forecasts, the Euro Area will reach the average levels of core inflation and wage growth that permitted pivots in 2024Q4, the UK and Australia (which has a 2.5% inflation target) are likely to reach these levels in 2025H1, while Norway will likely reach them in 2025H2 or 2026 (Exhibit 5). And while we generally expect GDP growth to firm in these economies going forward, growth in these economies has recently been lackluster and our forecasts are somewhat bearish relative to central bank expectations (Exhibit 6).

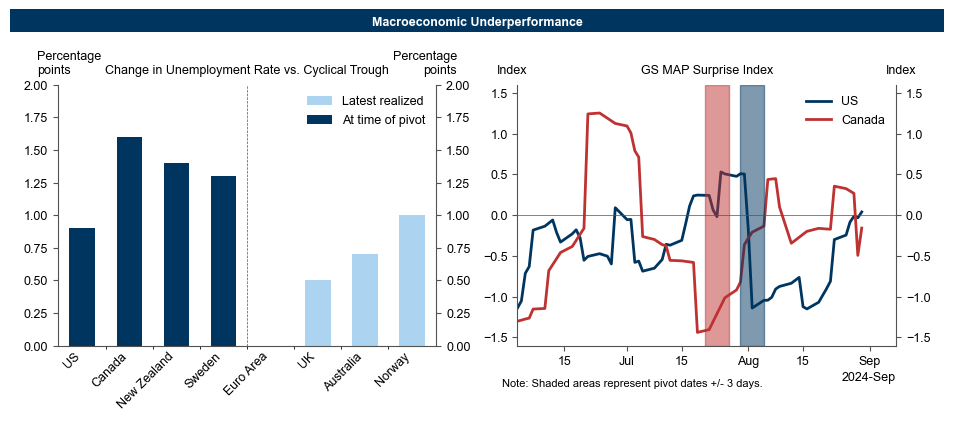
Exhibit 5: We Expect Core Inflation and Wage Growth to Reach the Levels Consistent with Observed Pivots in 2024Q4 in the Euro Area and 2025H1 in the UK and Australia

5. We Expect Core Inflation and Wage Growth to Reach the Levels Consistent with Observed Pivots in 2024Q4 in the Euro Area and 2025H1 in the UK and Australia. Data available on request.
Source: Haver Analytics, Goldman Sachs Global Investment Research

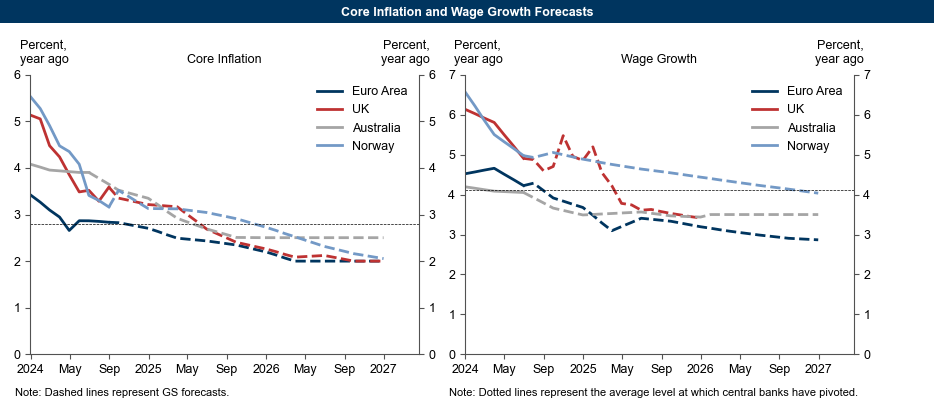
Exhibit 6: Our GDP Forecasts in Economies that Have Not Shifted Toward Sequential Cuts Are Somewhat Bearish Relative to Central Bank Expectations

6. Our GDP Forecasts in Economies that Have Not Shifted Toward Sequential Cuts Are Somewhat Bearish Relative to Central Bank Expectations. Data available on request.
Source: Haver Analytics, Goldman Sachs Global Investment Research
Overall, these patterns support our forecasts for a shift to sequential cuts for both the ECB (starting in December) and BoE (November). And while we forecast quarterly cuts in Australia (starting in February 2025) and Norway (December), we see risks in both economies as skewed toward faster easing, as continued progress on inflation will keep the door open to faster rate cuts in the event of even moderate incremental downside growth surprises.

Joseph Briggs

Megan Peters

  1. 1 ^ Since the RBNZ targets inflation of 1-3%, it may have a slightly greater tolerance for inflation above 3% than central banks that target inflation of 2% without an explicit range.

Investors should consider this report as only a single factor in making their investment decision. For Reg AC certification and other important disclosures, see the Disclosure Appendix, or go to www.gs.com/research/hedge.html.