Goldman Sachs Research
Americas Transportation: Eye on Freight: Potential Ramifications Should Labor Disruption Arise at East/Gulf Coast Ports - A Framework
Table of Contents
26 September 2024 | 8:31AM EDT | Research | Equity| By Jordan Alliger and others
More
Bottom Line: With no new contract in place between the International Longshoreman Association (ILA) and the US Maritime Alliance (USMX; an alliance of port operators and carriers), and contract expiry set for September 30, investors have been inquiring about the impact of the disruption on the congestion, trade and transportation. We analyzed the potential impact to trade value into the East Coast and Gulf Coast Ports if work disruption were to occur (we take no view on the likelihood of any outcome). Our illustrative analysis implies there could be upwards of $4.9bn per day at risk in international trade along the East and Gulf coasts along with the potential for supply chains to likely become less fluid due to emergent congestion, and in turn could result in a re-emergence of transport price inflation. As a reminder, the East and Gulf Coast ports employ about 45,000 ILA dockworkers and represent about 52% of inbound port traffic in 2023. We believe that key points to any new contract will include wage increases as well as addressing port automation based on precedent (for context the West Coast Longshoreman agreed to a contract in 2023, retroactive to 2022, that calls for a 32% increase over six years).

Assessing the Risk

While the purpose of this report is to assess the $ value of daily ocean trade that could be impacted by any work disruption (details on the estimated $4.9 bn per day below) - it is worth sharing at a high level our thoughts on various implications:
  • Even without any work disruption there has likely been some diversion to West Coast Ports and maybe even some Canadian ports (although likely not significant in Canada). In addition, various channel checks also suggest some pull forward in demand likely occurred both into the East/Gulf and West Coast to try to get ahead of any potential work disruption (and other political and geopolitical reasons). Exhibit 1 shows Strong West Coast port traffic as well as rail intermodal strength - possible inferences to early demand and/or diversion.

  • Looking at the growth YTD, now 67% through the year, we have seen 1.28mn more containers so far in 2024, or around 95% of the needed annual growth to catch up to where we would be if growth was at a normalized rate from 2019, which could be pointing toward 1) pull forward in demand and 2) diversion to the west coast. We also note that three of the four east/gulf coast ports that have reported August data have shown a lower seasonality from July to August, which could be showing the share shift to the west coast, as more and more shippers would likely have started to shift to the west coast as we near contract expiry.

  • China to WC shipping rates, while down 15% from July highs remain at very robust levels ($6,800-$6,900) - essentially 3.9x versus one year ago (Exhibit 3).

  • If there were to be a work disruption – then more traffic would likely be diverted to west coast ports. This could create additional logistical burdens on shippers, and we believe could lead to at least a short term spike in transport costs to the shipper – depending on how long any potential work disruption could last. This could also cause general inflation to be impacted.

  • In terms of companies, we see potential upside risk for those with heavy exposure to WC from added volumes initially – such as UNP/BNSF amongst rails. Although all the rails could see some business at some point - if more goods comes into WC and have to go to NY for instance – eventually there could be interchange with NSC or CSX. But the immediate positive impact would likely be for WC rails, and another heavy west coast participant could be JBHT – which handles intermodal with meaningful exposure to the WC as its main partner is BNSF.

  • Broadly a potential work disruption could likely tighten up transports markets and congestion could rise - meaning truckers could see price related upside as trucks and drivers at least initially could become constrained in the west coast.

  • From an air and forwarder perspective, work disruption has historically had a positive impact on forwarders, and to the extent shippers miss an ocean shipping window (it takes about 45 days door to door to move something from China to the USA) it could require them to utilize more air capacity. Tighter capacity in air could also have a positive impact on parcel players (FDX, UPS), as well as possibly heavier weight cargo.

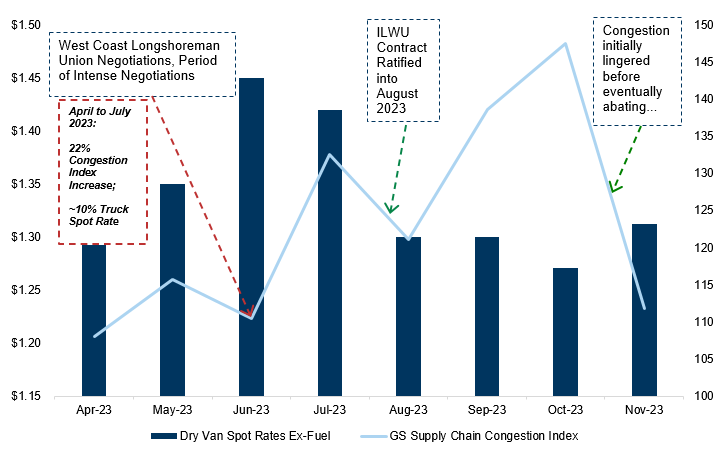
  • Overall supply chain congestion could likely rise. About two months ahead of the West Coast Longshoreman contract ratification on August 31, 2023, our Supply Chain Congestion tracker showed an approximate 40% sequential rise - dropping off post ratification (Exhibit 4). Note that while the initial impacts to transport providers could likely be favorable from a demand (depending on location) and price perspective (in the three months leading up to ratification spot truck rates rose about 12% sequentially) - certain network intensive sub-sectors (e.g. rails) could see networks become less fluid the longer a stoppage lasts as potentially goods back up at ports and/or warehouses - posing some risk to operations based on prior experience. Even if any work disruption lasts only a few days, it could take a week or more to clear up the congestion and eliminate the backlogs.

  • Bottom line, while we do not take a view on any potential outcome, we point out the various risks and potential upsides to a work disruption; and our analysis shows a risk to ocean goods value at up to $4.9bn per day.

Exhibit 1: Imports into the West Coast via the Big Three have averaged +23% YoY

Big Three Import Growth YoY
1. Imports into the West Coast via the Big Three have averaged +23% YoY. Data available on request.
Source: Port of Los Angeles, Port of Long Beach, Port of Oakland

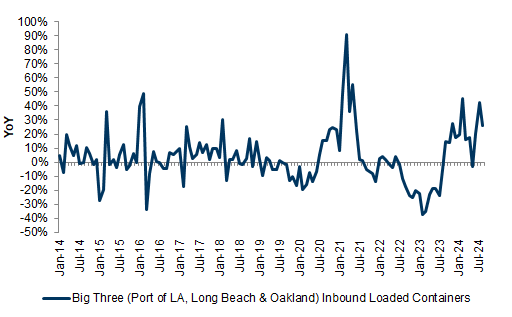
Exhibit 2: West Coast intermodal growth has been strong through 2024

West Coast Intermodal Carload Growth YoY
2. West Coast intermodal growth has been strong through 2024. Data available on request.
Source: AAR

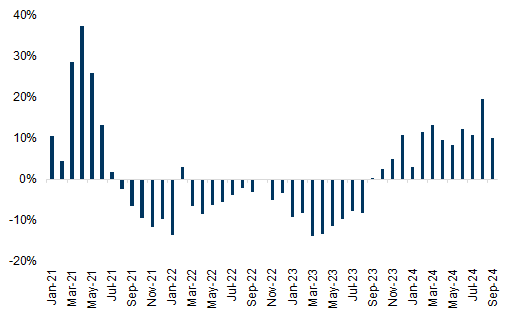
Exhibit 3: China to US West Coast rates remain elevated from 2023

China to West Coast Rates
3. China to US West Coast rates remain elevated from 2023. Data available on request.
Source: Freightos

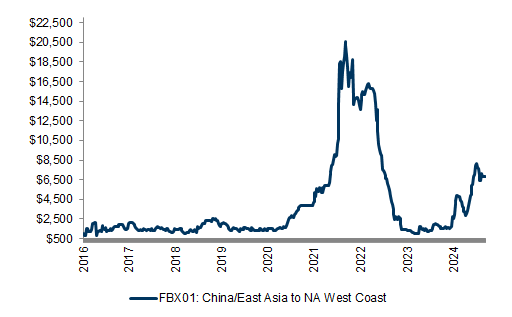
Exhibit 4: Congestion and rates rose leading up to contract ratification with the west coast union

Truck Spot Rates v. GS Supply Chain Congestion Index
4. Congestion and rates rose leading up to contract ratification with the west coast union. Data available on request.
Source: truckstop.com, Goldman Sachs Global Investment Research

Framing The Potential Trade Value Impact of A Work Disruption - An Illustrative Analysis

As we try to frame the impact of a work disruption, we attempt to understand what the trade value of a container (TEU) is, how many containers are at risk per day, and how much the hypothetical impact could be as a % total U.S. trade.
First, we utilize export and import trade data from the US Census Bureau, which reports 2023 US exports and imports as $2tn and $3.1tn, respectively, and 2022 US exports and imports as $2.1tn and $3.2tn, respectively, or $5.1tn in 2023 and $5.3tn in 2022. According to the Bureau of Transportation Statistics, Ocean trade made up 77% of U.S. trade by weight in 2022, but was 45% of the value of U.S. trade in 2022, or was about $2.3tn in trade in 2022. The top 25 ports in the U.S. moved 44mn loaded TEUs in 2022, meaning that each loaded container (TEU) on average in 2022 had a value of ~$52,000.
Narrowing down the average value of a container at ~$52,000, we are then able to understand how much freight on average would be delayed or at risk if a complete work disruption on the east coast took place. When we look at the top ports in the U.S., the East and Gulf coast have ~54% of total loaded TEU moves including imports and exports (using 2022 data) - implying total east coast and gulf coast loaded TEUs handled were ~23.8mn. We divide this by 250 workdays to arrive at ~95k TEUs handled each workday.
Applying the $52,000 value per container to the ~95k containers handled each day, we arrive at ~$4.9bn handled each day by the ports that could be affected by a potential work disruption (Exhibit 5). Depending on the length of the disruption, we see a scenario where trade impacted could reach $25bn after one work week, and $113bn through the end of October.

Exhibit 5: We estimate a daily impact of a disruption at $4.9bn

Daily $ Impact of an EC+GC Port Disruption
5. We estimate a daily impact of a disruption at $4.9bn. Data available on request.
Source: Census Bureau, US Bureau of Transportation Statistics (BTS), Goldman Sachs Global Investment Research
To put this in context, we compare this per day trade affected to total U.S. trade(Exhibit 6). To understand the potential impact on U.S. trade, we looked at historical seasonality from July to October from 2015-2019 (we stop at 2019 pre-covid to take out noise) and applied this to total imports and exports reported in July to arrive at ~$450bn in total U.S. trade implied for October 2024. Adjusting for the recent ~41% average of ocean trade on total U.S. trade implies October ocean trade at $186bn. October has 23 workdays which means there would be ~$8bn in ocean trade each day of October.
Using our implied daily ocean container value handled each day on the east coast, we estimate that a potential work disruption could impact ~61% of total U.S. ocean trade and 25% of total U.S. daily trade in October. That said, we note that given the appearance of a pull forward in demand and diversion to the West Coast, the impact could be mitigated, especially if shippers continue to re-route to the west coast.

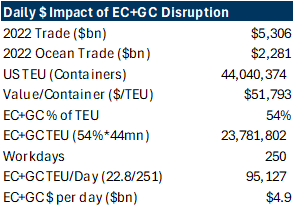
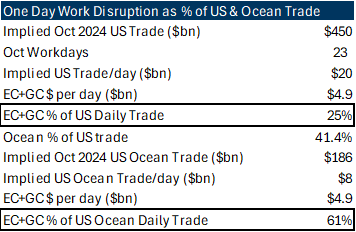
Exhibit 6: The closure of the EC+GC Ports would have a meaningful impact on ocean trade

Impact of one-day work disruption as % of US and Ocean Trade
6. The closure of the EC+GC Ports would have a meaningful impact on ocean trade. Data available on request.
Source: Census Bureau, US Bureau of Transportation Statistics (BTS), Goldman Sachs Global Investment Research

Goldman Sachs does and seeks to do business with companies covered in its research reports. As a result, investors should be aware that the firm may have a conflict of interest that could affect the objectivity of this report. Investors should consider this report as only a single factor in making their investment decision. For Reg AC certification and other important disclosures, see the Disclosure Appendix, or go to www.gs.com/research/hedge.html. Analysts employed by non-US affiliates are not registered/qualified as research analysts with FINRA in the U.S.