UK Weekly Kickstart
UK Equities: New York Calling
Table of Contents
- Intro
- Equity Performance (in GBP)
- FTSE 350 Sector Performance
- Earnings Expectations and Revisions
- FTSE 350 Valuation
- UK Sector Valuation
- Style Performance
- UK Style Valuation
- Volatility, Skew, Dispersion and Correlations
- Flows and Positioning
- Comparison of European Indices
- Global Strategy Views: Indices and Asset Classes
- UK Exposure
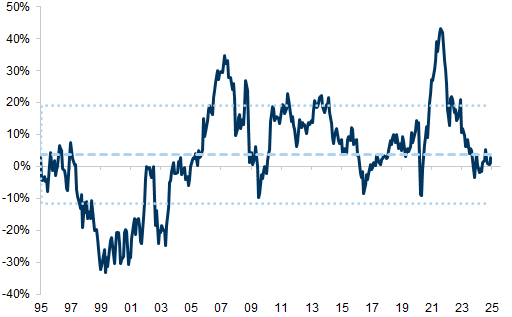
More UK companies are talking about moving their listing to the US (Ashtead is the latest to propose a move). The valuation gap to the US has become larger (Exhibit 1). And only a small proportion of this is due to sector distribution; every sector in the UK is on a double-digit P/E discount to its US counterpart sector (Exhibit 2). This discount is of course a Europe-wide phenomenon, but the gap between the UK and US is especially large.
US companies are far more profitable, but even relative to ROE, the UK market trades at a low multiple vis-a-vis other markets; the UK has roughly twice the ROE of Japan but a similar Price-to-Book (Exhibit 3).
A lack of allocation to UK equities by long-term domestic capital (pensions/insurance funds) and by households is a large reason for the discount, we think. Only about one-third of the UK equity market is held domestically, compared with over 80% in the mid-1990s.
Assuming we do not see fund flows into UK stocks, there are only so many ways to try to narrow the valuation gap to the US – relist, take-private (where valuation gaps are lower), be taken over or do more buybacks (if you think your shares are under-valued). We are seeing all of these happen. Indeed, UK equity supply is shrinking both via a lack of IPOs and a rise in buybacks/take-privates (Exhibit 4). We expect all four strategies to continue. But, of course, these create their own momentum, shrinking the UK market further and reducing total trading turnover.
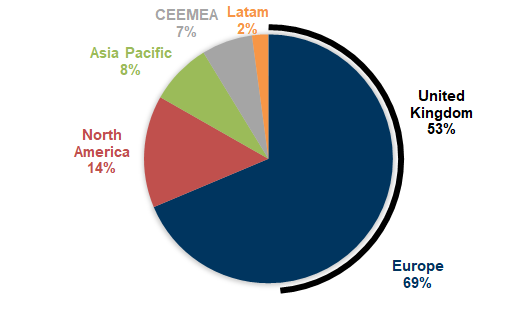
As we discuss in our Portfolio Passport, UK-listed companies are very international. Exposure to North America for FTSE 100 is in aggregate 29%, which is higher than UK exposure (22%) or Europe-ex UK (16%) (Exhibit 5). There are plenty of opportunities for UK stocks to re-list. That all being said, smaller stocks would find themselves tiny within the context of the much larger US market, while bigger stocks that hope to be in the S&P 500 would have no guarantee of inclusion and would likely face a long wait until it happened (the decision is committee-based).
In order to stem this migration and reduction in equity supply, there would need to be more allocation to equity by UK-based capital, in our view. This is something that both the current and previous governments have recognised, but material policy action has been lacking. Household savings flows are almost entirely into cash/deposits (Exhibit 6).
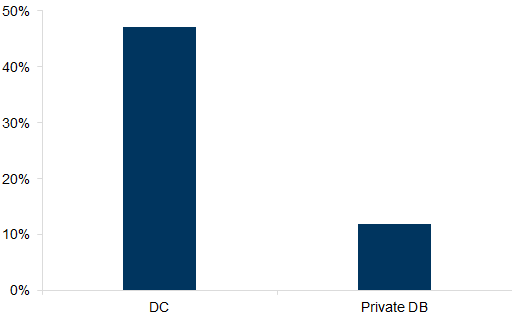
DB Pension funds have deserted equities (not just UK), and given aging beneficiaries and asset-liability matching rules they are unlikely to return to equity, in our view. Government plans to merge local authority pension funds could be a helpful move, but much depends on their willingness to take risk and allocate to UK equities. The good news is that DC pensions are growing (Exhibit 7) and the flows into these are larger than in DB – but the allocation is still conservative given the age of these beneficiaries (Exhibit 8).
It will take substantial commitment to reverse the outflow from UK equities that has been happening since the 1990s. Changing rules for insurance companies, reducing subsidies for allocating to cash/bonds and increasing those for allocating to equity could all be part of any remedy, in our view.
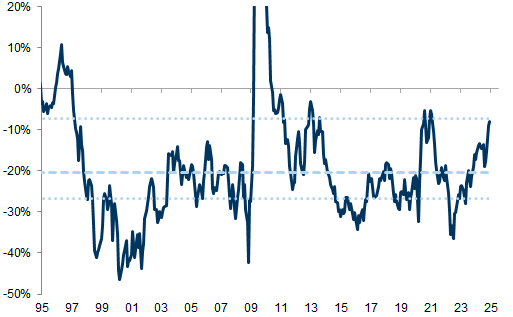
Exhibit 1: The UK trades at an extreme discount to the US
UK relative to US 12m forward P/E
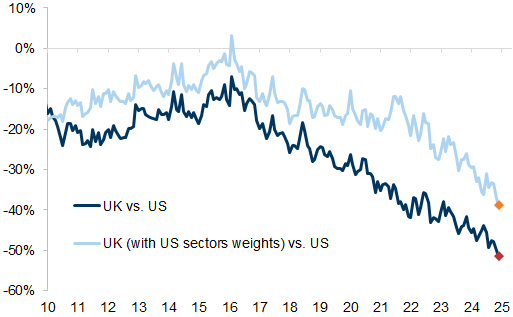
Source: Datastream, Goldman Sachs Global Investment Research
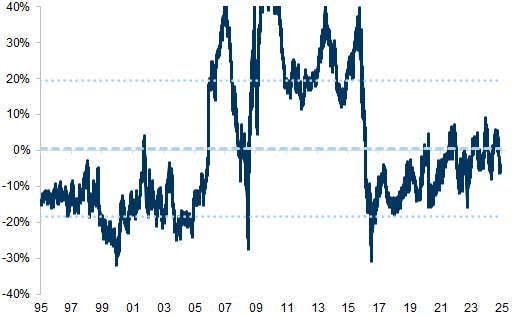
Exhibit 2: Every sector in the UK is on a discount, almost all in double-digits
MSCI UK vs. US 12m forward P/E discount and Median P/E discount, last 20 years
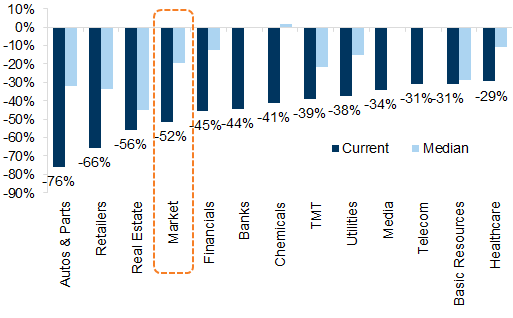
Source: Datastream, Goldman Sachs Global Investment Research
Exhibit 3: On a comparison of Price-to-book and ROE, the UK comes out as one of the cheapest regions globally
24m fwd Price-to-Book and 12m fwd Return on Equity, MSCI sectors
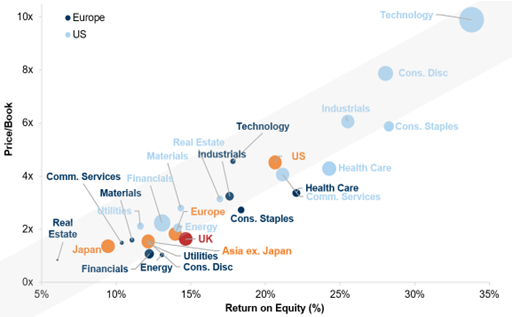
Source: FactSet, Goldman Sachs Global Investment Research
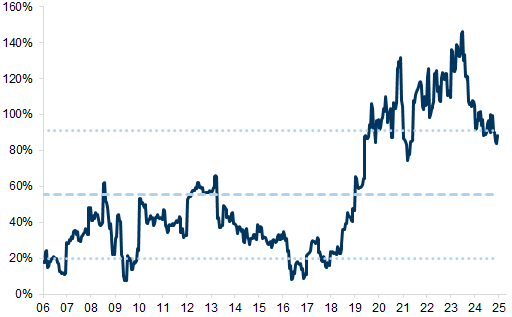
Exhibit 4: UK companies with access to cash are buying back their own shares to improve valuations
Rolling annual summation in local currency for UK buybacks
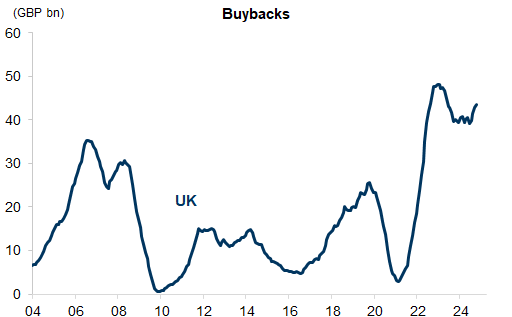
Source: Haver Analytics, Goldman Sachs Global Investment Research
Exhibit 5: Revenue exposure of the FTSE 100
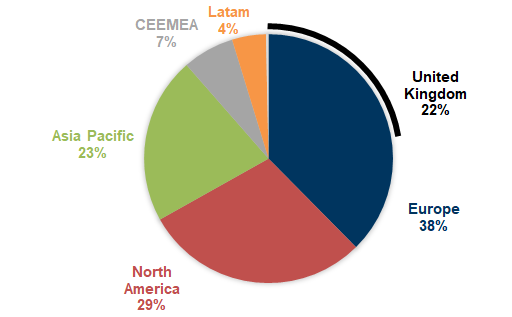
Source: FactSet, Goldman Sachs Global Investment Research
Exhibit 6: All of the pandemic savings went on deposits in the UK
Quarterly flows into financial assets (bn, GBP)
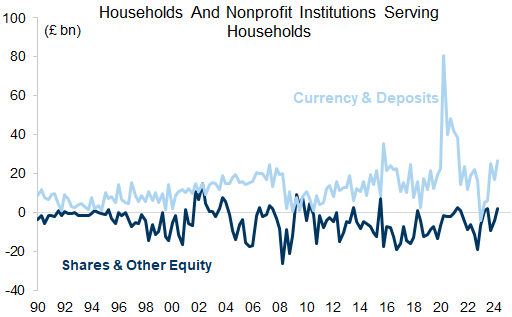
Source: Haver Analytics, Goldman Sachs Global Investment Research
Exhibit 7: DC funds are seeing net inflows of c. £5-6bn per quarter, but DB funds are seeing outflows (as benefits are paid out) of £8-10bn
Net contributions to Defined Benefit (DB) and Defined Contribution (DC) pension funds
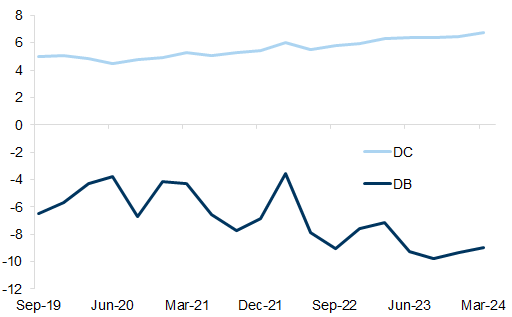
Source: ONS, Goldman Sachs Global Investment Research
Exhibit 8: Around a half of DC pension assets are in equity compared with c. 10% for Private DB funds
The share of equity investments in proportion to total assets (%)
Source: ONS, Goldman Sachs Global Investment Research
Equity Performance (in GBP)
Exhibit 9: UK equity performance - 1 week
Total Return Performance (GBP)
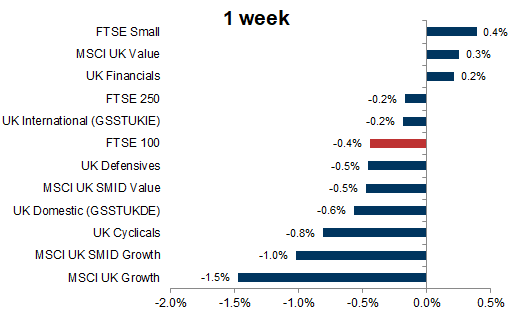
Source: Bloomberg, Datastream, FactSet, Goldman Sachs Global Investment Research
Exhibit 10: Global equity performance - 1 week
Total Return Performance (GBP)
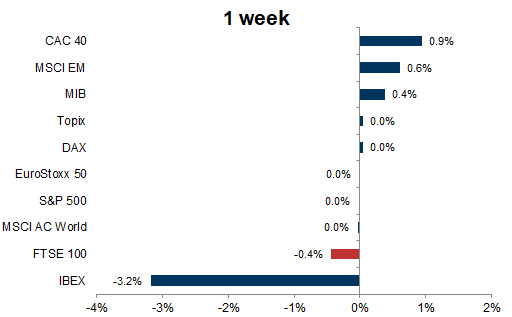
Source: Bloomberg, Datastream, STOXX, Goldman Sachs Global Investment Research
Exhibit 11: UK equity performance - YTD
Total Return Performance (GBP)
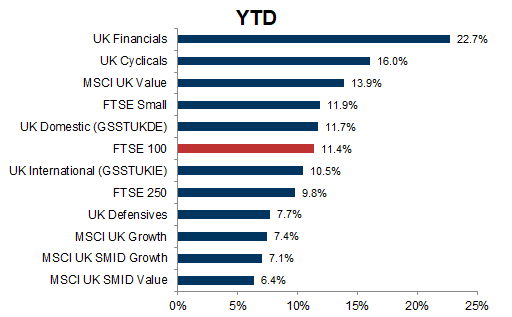
Source: Bloomberg, Datastream, FactSet, Goldman Sachs Global Investment Research
Exhibit 12: Global equity performance - YTD
Total Return Performance (GBP)
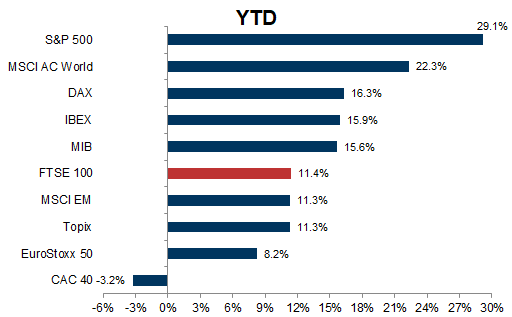
Source: Bloomberg, Datastream, STOXX, Goldman Sachs Global Investment Research
FTSE 350 Sector Performance
Exhibit 13: 1-week sector performance
Total Return - GBP
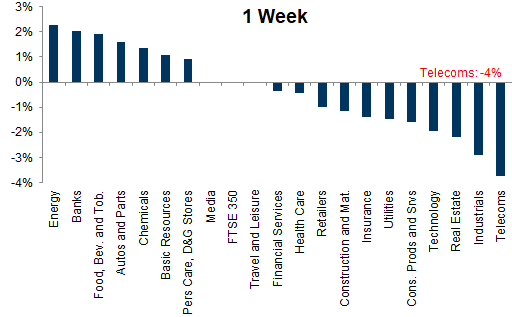
Source: Datastream, Goldman Sachs Global Investment Research
Exhibit 14: 1-month sector performance
Total Return - GBP
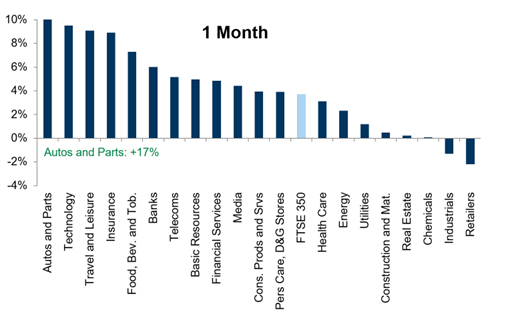
Source: Datastream, Goldman Sachs Global Investment Research
Exhibit 15: 3-month sector performance
Total Return - GBP
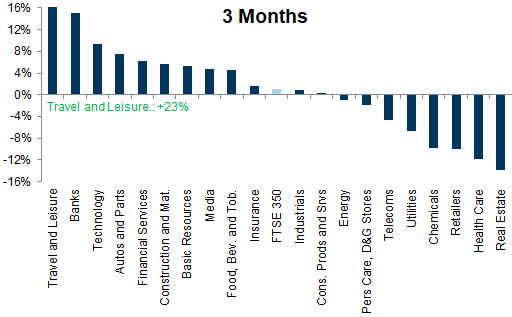
Source: Datastream, Goldman Sachs Global Investment Research
Exhibit 16: YTD sector performance
Total Return - GBP
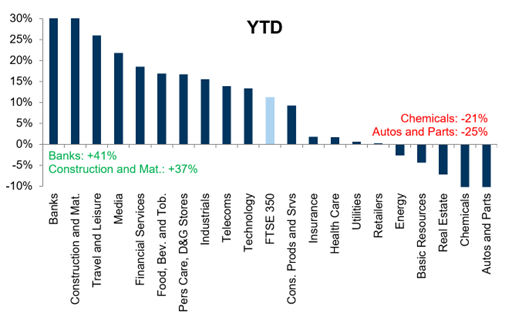
Source: Datastream, Goldman Sachs Global Investment Research
Earnings Expectations and Revisions
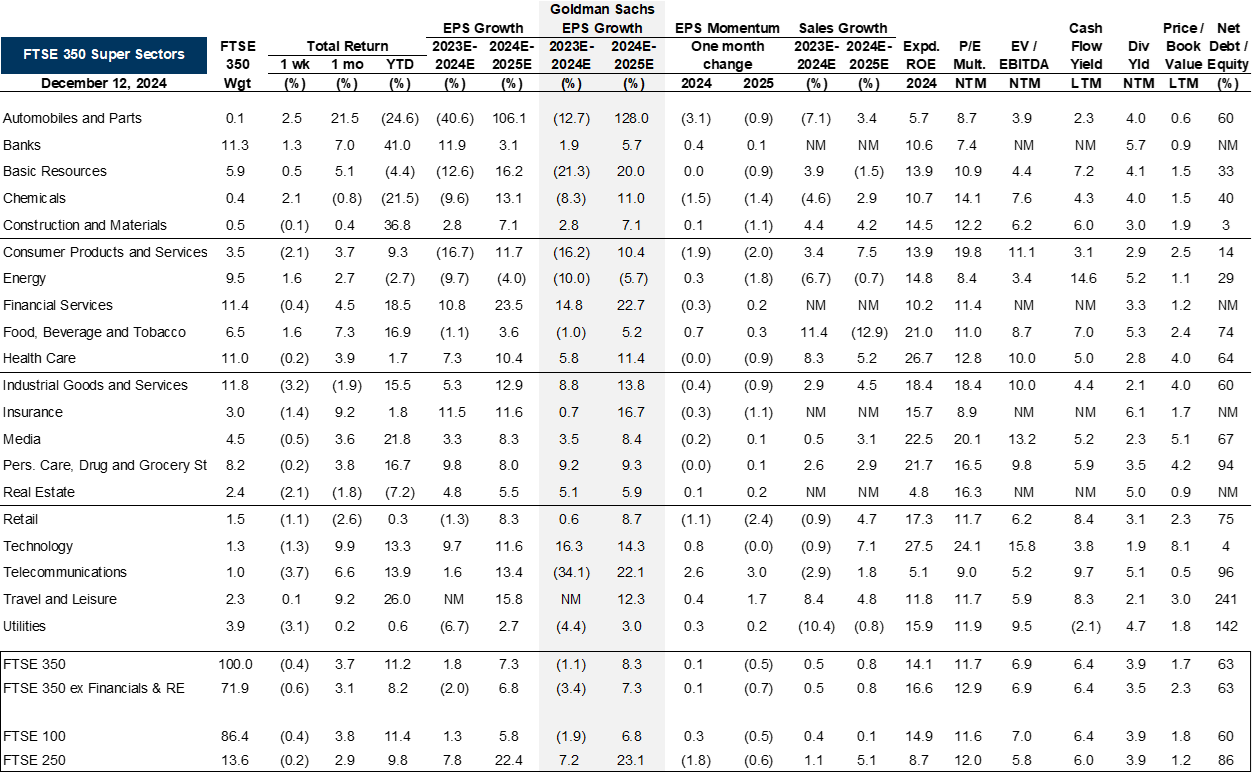
Exhibit 17: FTSE 350 expected earnings growth and revisions by sector (%)
Local currency
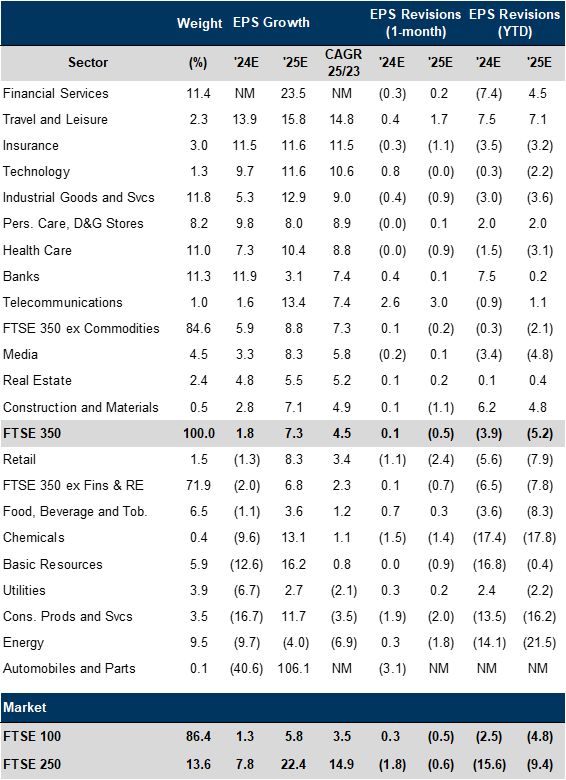
Source: FactSet, Goldman Sachs Global Investment Research
Exhibit 18: Cumulative change in earnings estimates for UK
GBP
Source: I/B/E/S, Datastream, Goldman Sachs Global Investment Research
FTSE 350 Valuation
Exhibit 19: UK valuations
FTSE 100 and 250 data from 2000 - FTSE 350 historical percentile from 1995
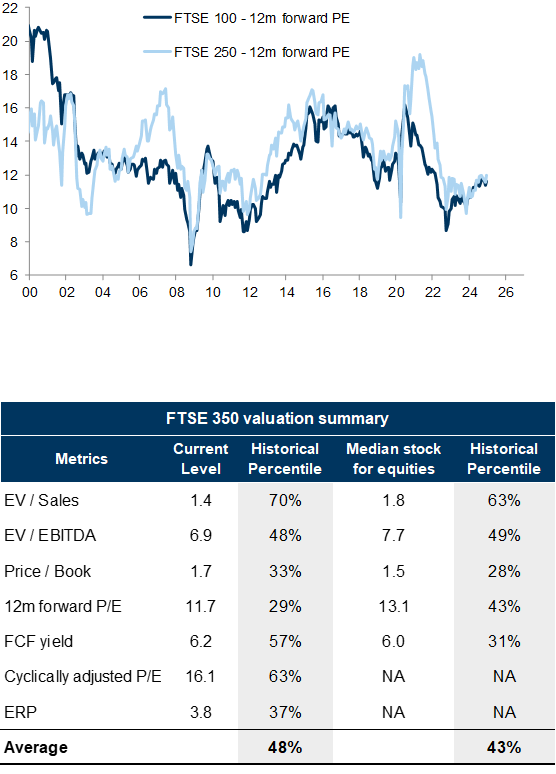
Source: Datastream, FactSet, Goldman Sachs Global Investment Research
Exhibit 20: FTSE 350 sector valuation
12m forward P/E over the past 10 years
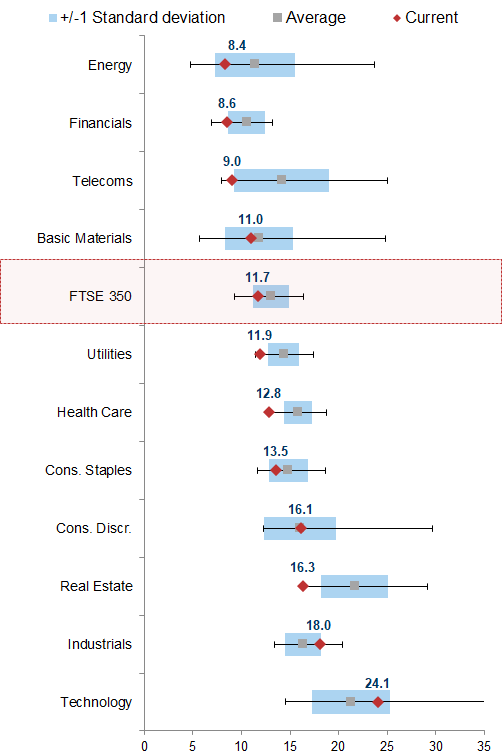
Source: Datastream, I/B/E/S, FactSet, Goldman Sachs Global Investment Research
UK Sector Valuation
Exhibit 21: UK sector valuation
Source: FactSet, Goldman Sachs Global Investment Research
Style Performance
Exhibit 22: Cyclicals vs. Defensives
UK and Euro Area - Cycl: Autos, Banks, Basic Res, Chem, Constr & Mats, Consumer Prd & Svs, Financial Svs, Industrials, Insurance, Tech, Travel & Leis. Defs: Drug & Groc, Food & Bev, Health Care, RE, Telcos, Utilities. US - please see: Cyclicals vs. Defensives: A global implementation
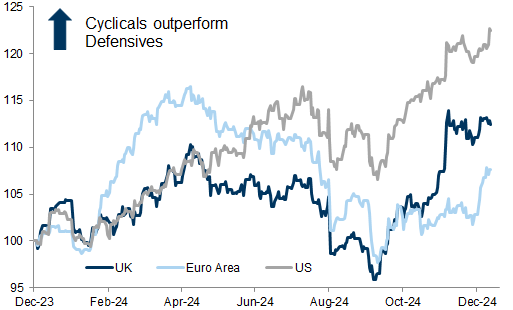
Source: Datastream, Worldscope, Bloomberg, Goldman Sachs Global Investment Research
Exhibit 23: Growth vs. Value
MSCI indices
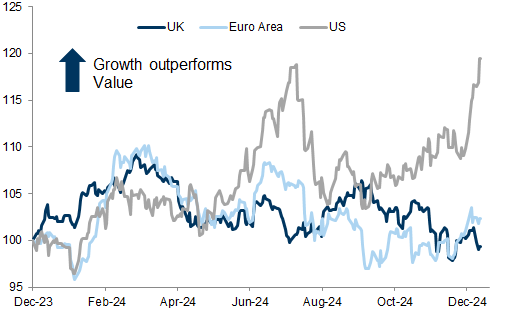
Source: Bloomberg, Goldman Sachs Global Investment Research
Exhibit 24: Domestic vs. International
UK: GSSTUKDE vs. GSSTUKIE; Euro area: GSSTDOME vs. GSSTINTL; US: GSTHAINT vs. GSTHINTL
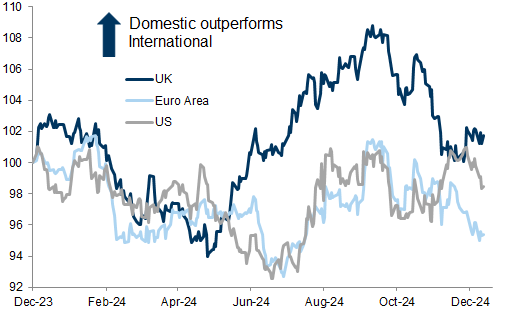
Source: Bloomberg, Goldman Sachs Global Investment Research
Exhibit 25: Small-cap vs. Large-cap
UK: FTSE 250 vs. FTSE 100; Euro Area: MSCI EMU Small vs. MSCI EMU Large; US: Russell 2000 vs. S&P 500
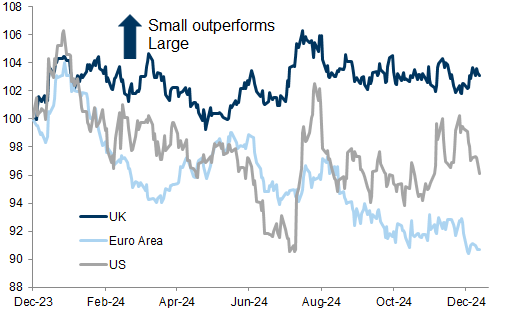
Source: Bloomberg, Goldman Sachs Global Investment Research
UK Style Valuation
Exhibit 26: UK Cyclicals vs. UK Defensives
12m forward P/E Premium/Discount
Source: Datastream, Worldscope, Goldman Sachs Global Investment Research
Exhibit 27: MSCI UK Growth vs. MSCI UK Value
12m forward P/E Premium/Discount
Source: FactSet, Goldman Sachs Global Investment Research
Exhibit 28: Domestic (GSSTUKDE) vs. International (GSSTUKIE)
12m forward P/E Premium/Discount
Source: Datastream, I/B/E/S, Goldman Sachs Global Investment Research
Exhibit 29: FTSE 250 vs. FTSE 100
12m forward P/E Premium/Discount
Source: Datastream, I/B/E/S, FactSet, Goldman Sachs Global Investment Research
Volatility, Skew, Dispersion and Correlations
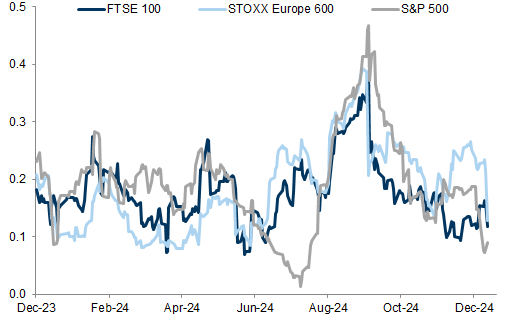
Exhibit 30: Implied volatility (3-month ATM)
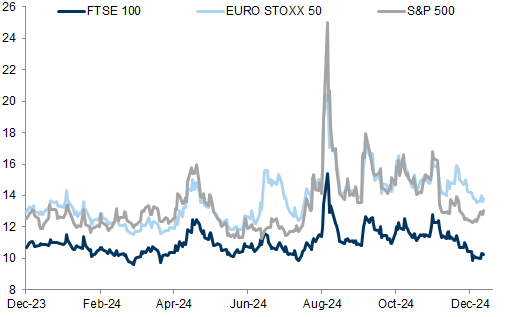
Source: Bloomberg, STOXX, Goldman Sachs Global Investment Research
Exhibit 31: Normalised skew (3 month, 25 delta)
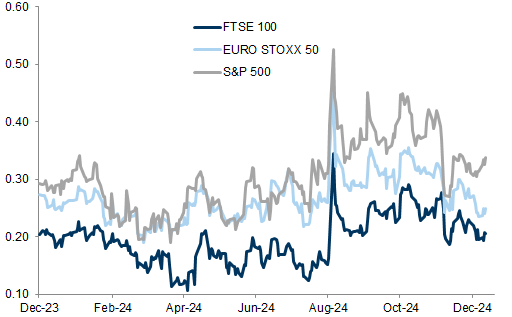
Source: Bloomberg, STOXX, Goldman Sachs Global Investment Research
Exhibit 32: FTSE 350 return dispersion
6-month average of monthly return dispersion
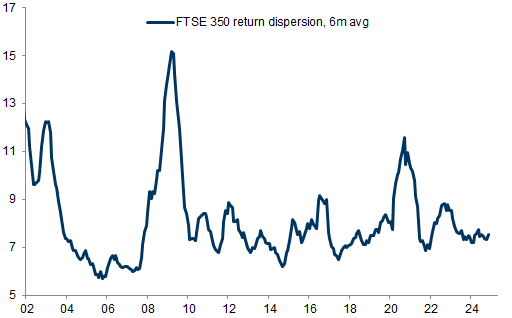
Source: Datastream, Goldman Sachs Global Investment Research
Exhibit 33: 1-month pairwise correlation
Source: Bloomberg, STOXX, Goldman Sachs Global Investment Research
Flows and Positioning
Exhibit 34: Monthly flows from Global investors into UK equity funds
Weekly flows, EPFR Country Flows
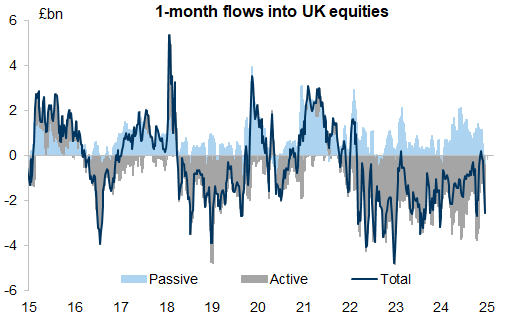
Source: EPFR, Haver Analytics, Goldman Sachs Global Investment Research
Exhibit 35: 3m flows from Global investors into UK equity funds
Weekly flows, EPFR Country Flows
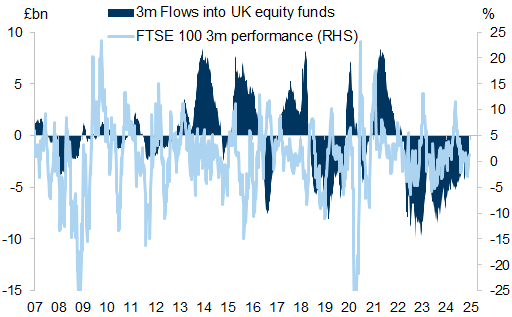
Source: EPFR, Haver Analytics, Goldman Sachs Global Investment Research
Exhibit 36: Calendarised flows from Global investors into UK equity funds
Weekly flows, EPFR Country Flows
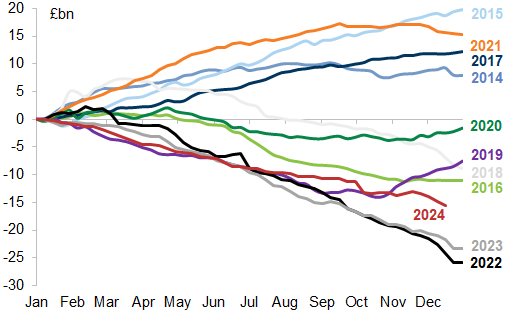
Source: EPFR, Haver Analytics, Goldman Sachs Global Investment Research
Exhibit 37: Cumulative flows from Global investors into UK equity funds
Indexed to 0 in Jan-07. Weekly flows, EPFR Country Flows
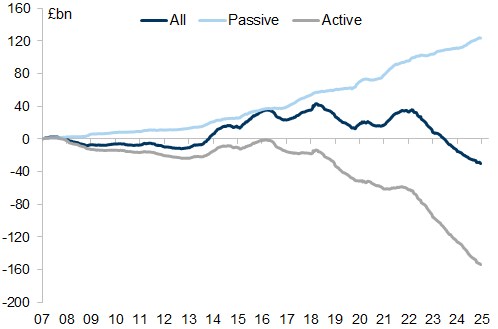
Source: EPFR, Haver Analytics, Goldman Sachs Global Investment Research
Comparison of European Indices
Exhibit 38: European indices valuation
Local currency
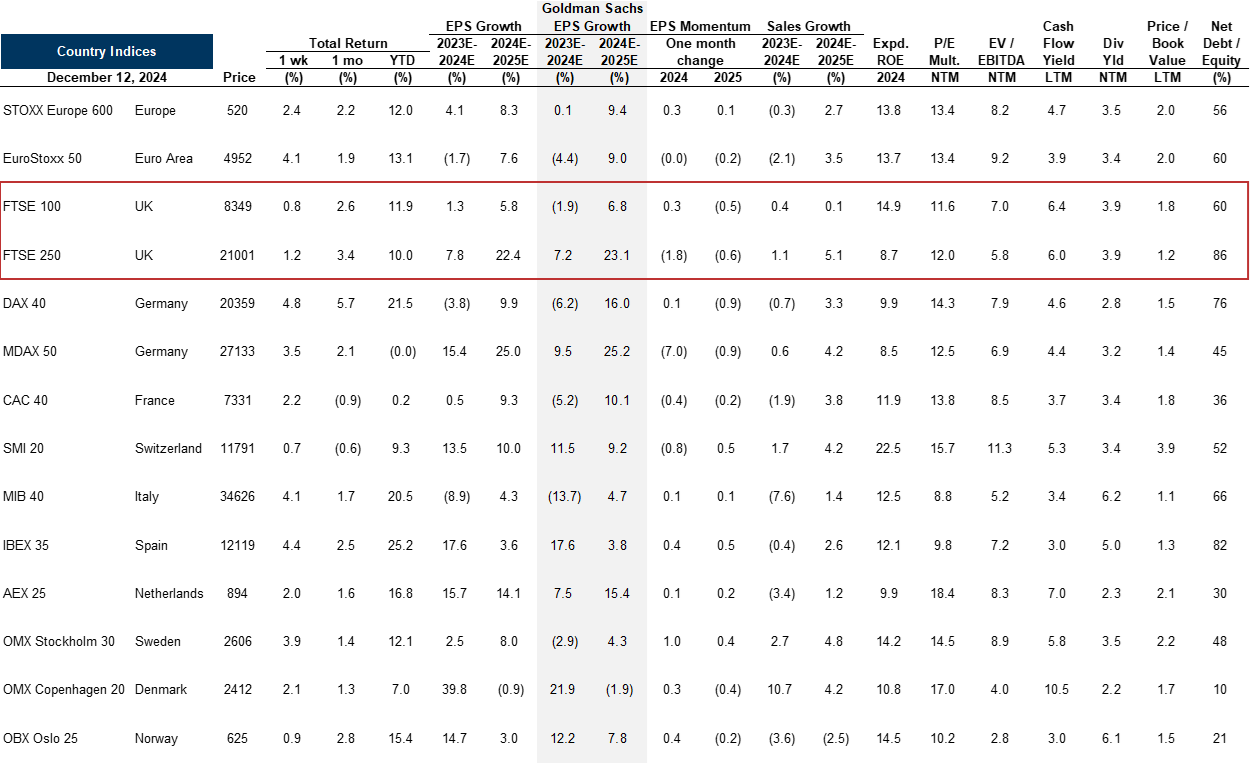
Source: FactSet, STOXX, Goldman Sachs Global Investment Research
Global Strategy Views: Indices and Asset Classes
Exhibit 39: GS forecasts across assets
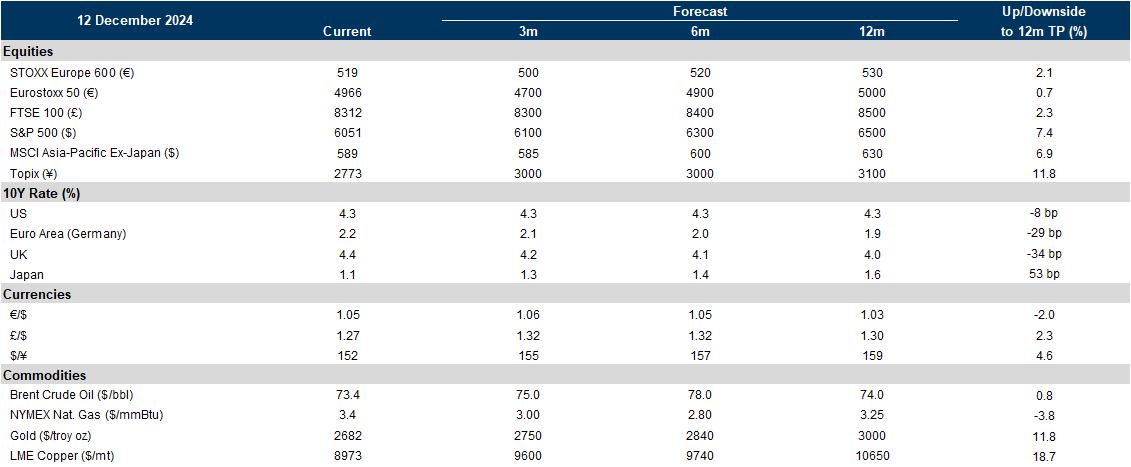
Source: Datastream, STOXX, Goldman Sachs Global Investment Research
Exhibit 40: Valuation metrics across regions
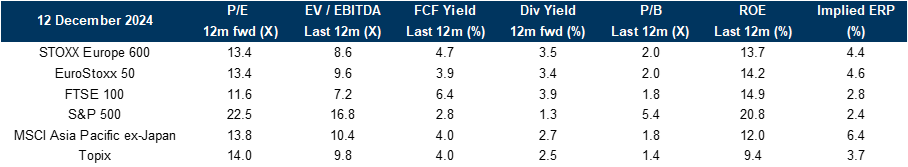
Source: FactSet, I/B/E/S, STOXX, Goldman Sachs Global Investment Research
UK Exposure
Exhibit 41: Geographical sales exposure of FTSE 100 constituents
FY 2023 - See Europe Portfolio Passport (13 Dec, 2024)

Source: FactSet, Goldman Sachs Global Investment Research
Exhibit 42: Geographical sales exposure of FTSE 250 constituents
FY 2023 - See Europe Portfolio Passport (13 Dec, 2024)
Source: FactSet, Goldman Sachs Global Investment Research
Exhibit 43: Composition of FTSE 100 by sector
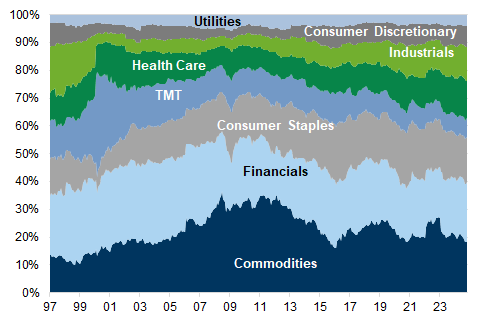
Source: Datastream, Goldman Sachs Global Investment Research
Exhibit 44: Composition of FTSE 250 by sector
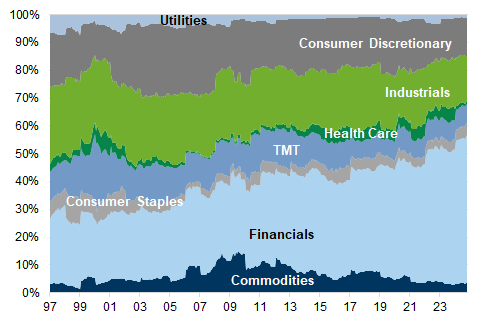
Source: Datastream, Goldman Sachs Global Investment Research
Investors should consider this report as only a single factor in making their investment decision. For Reg AC certification and other important disclosures, see the Disclosure Appendix, or go to www.gs.com/research/hedge.html.