Global Strategy Views
Concentration & Correction – what to do next
1. The equity markets' correction, triggered by news of the DeepSeek LLM model, has been the first fall of more than 3.5% of the Magnificent 7 since last Autumn. In our view this is a correction and not the start of a sustained bear market. Most bear markets are triggered by expectations of falling profits driven by fears of recession. Our economists remain confident about world growth and remain above consensus on their forecasts for the US, putting the probability of recession in the next 12 months at 15%. We also expect interest rates to be cut, albeit modestly this year, alongside more progress on inflation moderation – and a cheaper entrant into the AI space might increase confidence in this trend. This combination of macro conditions has historically been supportive of risk assets (Exhibit 1).
Exhibit 1: The current combination of macro conditions has historically been supportive of risk assets
Global equities around Fed cut with and without recession
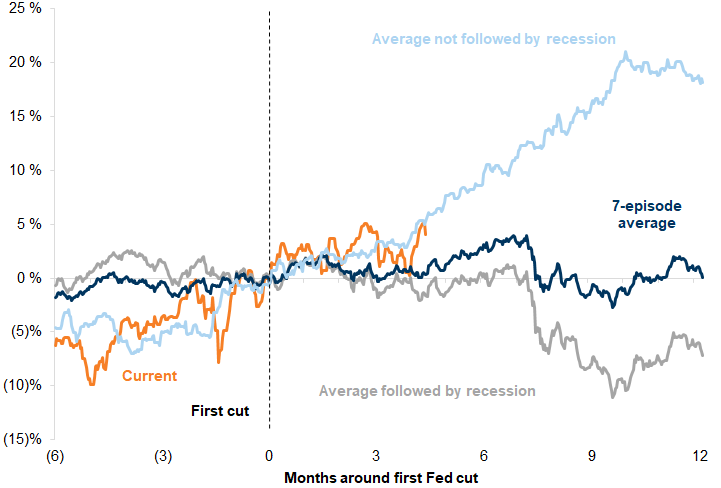
Source: Datastream, Goldman Sachs Global Investment Research
2. Nevertheless, we have argued that context is important and that equity markets came into the year priced for perfection, leaving them vulnerable to disappointments. Returns in equity markets, led by the US, have been unusually strong over the past couple of years, and particularly since October 2023 (Exhibit 2) as investors began to become more optimistic about the prospects for lower inflation and interest rates alongside a soft landing.
Exhibit 2: Returns in equity markets, led by the US, have been unusually strong over the past couple of years and particularly since October 2023
2 year calendarized S&P 500 performance starting in January. Data since 1928
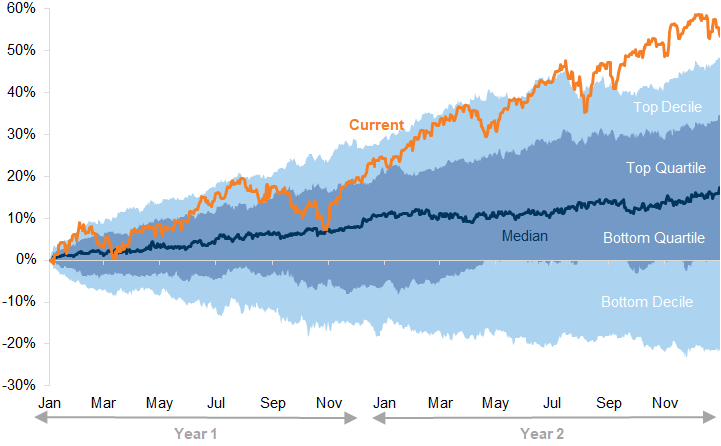
Source: Bloomberg, Datastream, Goldman Sachs Global Investment Research
3. Overall levels of valuation had reached very high levels, particularly in the US, and P/E multiples have increased meaningfully since Q4 2023 (see Exhibit 3). In the case of the US, while much of this reflects the largest technology companies, the equity market remains expensive relative to history even if we exclude large cap technology (the second column). Furthermore, while other equity markets around the world are much cheaper than the US, most are not particularly cheap relative to their own history. The main exception is China.
Exhibit 3: The US has a valuation at its 20-year peak and this remains true even if we exclude the largest technology companies
12m fwd P/E, MSCI regions; data since 2003
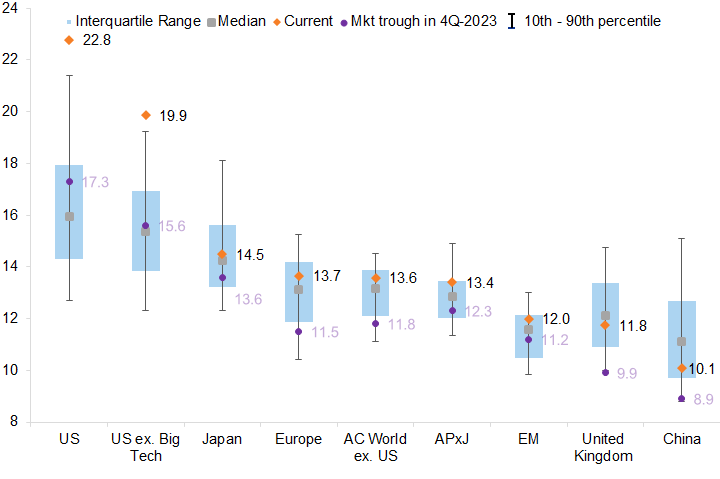
Source: FactSet, Goldman Sachs Global Investment Research
4. While surging equity returns coupled with high valuation provide fertile conditions for a correction, it is also the concentration of equities as an asset class that has left equity investors vulnerable to disappointments. The rising concentration in equities has taken three forms (see The Concentration Conundrum; What to do about market dominance, 11 March 2024): the growing dominance of the US equity market in the global index, the ascent of the technology sector, and the rise in single stock concentration (particularly in the US).
To be clear, these factors have emerged as a function of strong fundamentals, not as the result of speculation or irrational exuberance. The growing dominance of the US equity market has simply mirrored its relative profit growth since the financial crisis (Exhibit 4).
Exhibit 4: The growing dominance of the US equity market has simply mirrored its relative profit growth since the financial crisis
Price return and 12m fwd EPS in local currency. Indexed to 100 in Jan-2014
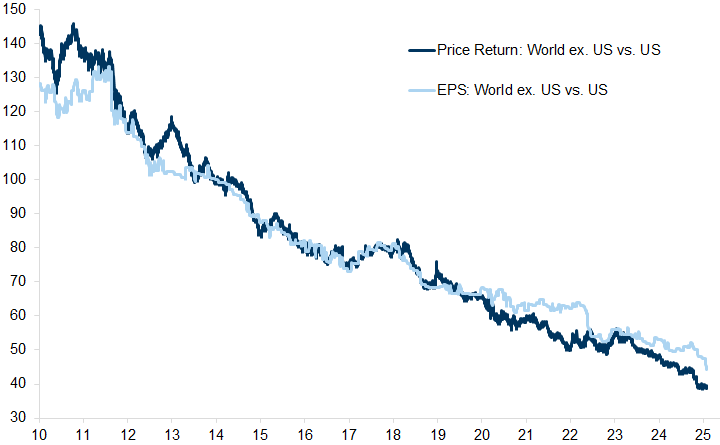
Source: Datastream, STOXX, Goldman Sachs Global Investment Research
Meanwhile, the growing influence of technology on market returns reflects the significant outpacing of technology profits relative to other industries over the same period (Exhibit 5).
Exhibit 5: The growing influence of technology on market returns reflects the significant outpacing of technology profits relative to other industries over the same period
12m Trailing EPS (USD). Indexed to 100 on Jan-2009.
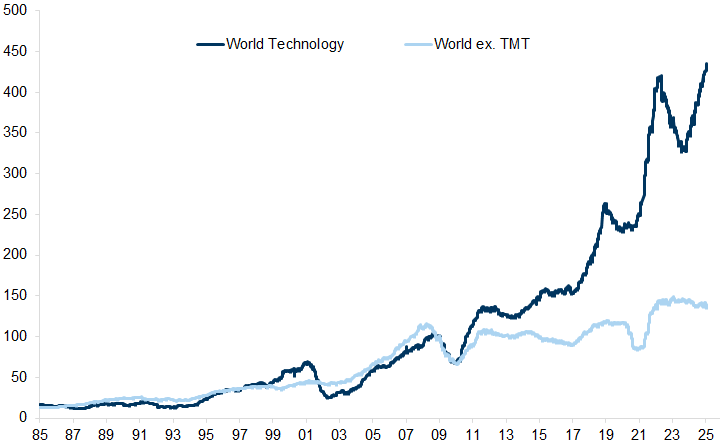
Source: Datastream, Worldscope, Goldman Sachs Global Investment Research
Furthermore, the dominance of the biggest companies in the US equity market is a function of their vastly superior earnings power over the past decade (Exhibit 6).
Exhibit 6: The dominance of the biggest companies in the US equity market is a function of their vastly superior earnings power over the past decade
Magnificent Seven and S&P 500, 12m trailing EPS. Indexed to 100 on Jan-2005
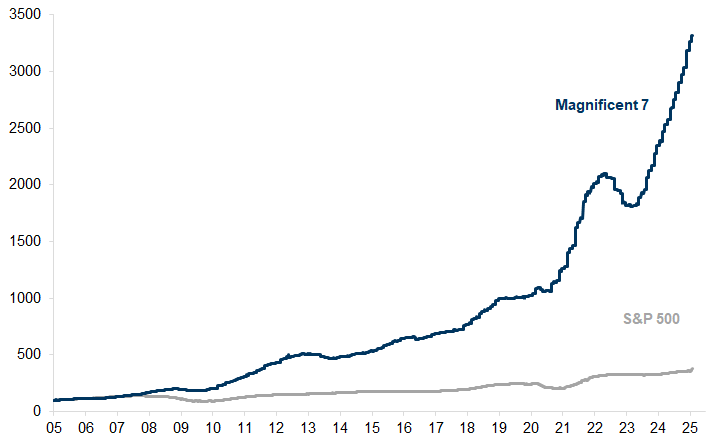
Source: FactSet, Goldman Sachs Global Investment Research
5. The dominance of US equity market, technology sector, and dominant companies does not represent a bubble based on irrational exuberance but is rather a reflection of superior fundamentals. Nevertheless, while stronger growth has justified the patterns of returns that have driven equity markets over the recent past, they do not tell us about the future expectations or returns.
On a forward-looking basis, while the US equity market is likely to move higher based on solid earnings growth, its superior earnings growth at the index level is set to fade, opening up opportunities for more diversification. For this year at the index level our top-down forecasts are similar across all regions (except for Europe) (Exhibit 7), suggesting more opportunity for geographic diversification.
Exhibit 7: For this year at the index level our top-down forecasts are similar across all regions (except for Europe)
GS top-down vs. consensus bottom-up estimates of 2025 EPS growth
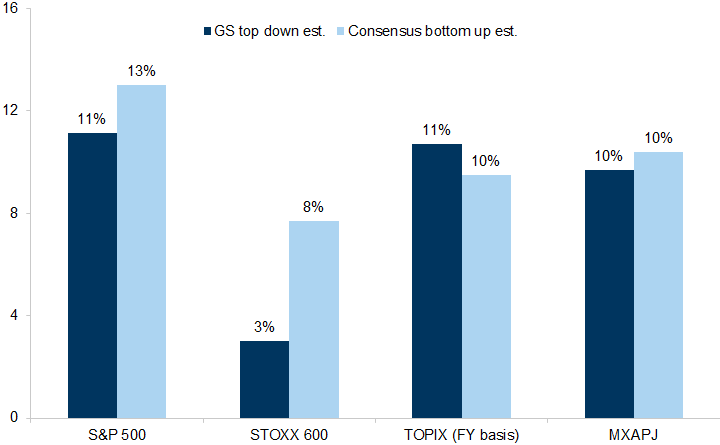
Source: I/B/E/S, Toyo Keizai, STOXX, MSCI, Goldman Sachs Global Investment Research
At the same time, our US strategists expect the strong pace of earnings growth of the dominant technology companies to continue but also to moderate on a relative basis (see 2025 US Equity Outlook: The Art of the Deal, 18 November 2024) (Exhibit 8).
Exhibit 8: Our US strategists expect the strong pace of earnings growth of the dominant technology companies to continue but also to moderate on a relative basis
Annual earnings growth
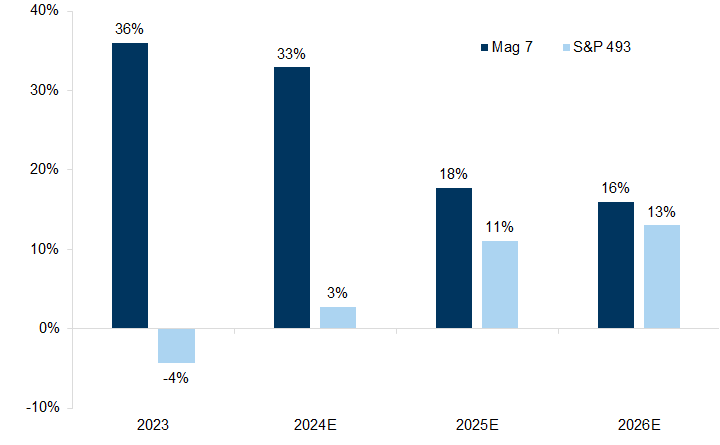
Magnificent 7 is a list of companies including: Meta, Amazon, Apple, Microsoft, Alphabet, Tesla, NVIDIA
Source: Datastream, Goldman Sachs Global Investment Research
The dominant companies are still expected to see superior growth but the gap is narrowing. We have argued that this leaves a risk in such a concentrated market. The price action of the GRANOLAS in Europe last year, provides a good use-case for the risk of high concentration in the US with the Magnificent 7. Despite their earnings continuing to grow faster than the rest of the European market, the GRANOLAS valuations have significantly declined, resulting in flat year-over-year performance. This derating has negatively impacted the overall market due to the size of these companies (see Strategy Espresso: GRANOLAS, worth another bite?, 17 January 2025).
6. The acceleration in the vast sums of money that the dominant technology companies are spending on capex raises two important questions. First, whether the optimism around future growth generated by AI would accrue to the current dominant companies that were spending the money on the capex. Second, whether the optimistic growth rates of leading technology companies could be achieved without complementary growth in companies in other industries – often with much lower valuations – that could facilitate the roll out of infrastructure and increased electrification.
History provides some useful lessons. First, the original capex spenders on revolutionary technology are not always the biggest beneficiaries; the experience of the Telecom companies in the late 1990s is a good example. Second, even very dominant companies eventually succumb to competition – often from new companies in the same sector – just as AMD and Intel experienced, for example, with the ascent of Nvidia. The extent to which these observations are relevant to the current market setup is still not clear. But the news around DeepSeek has been a wake up call that has shaken the confidence that was reflected in market pricing. Indeed, our technology analysts argue “DeepSeek has introduced pricing competition into the foundational model layer at a point in time where models are just about good enough for many enterprise use cases”. The revelation of a cheaper competitor entering the AI space has exposed the risk of concentration. This is relevant because equity markets are not typically driven by absolute outcomes, but rather by outcomes relative to expectations.
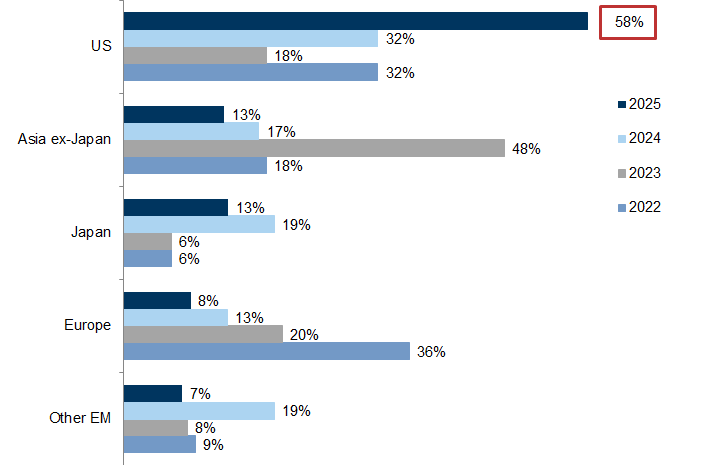
7. We noted last week that the polling responses to questions asked at our annual Global Strategy Conferences revealed a very strong consensus that the patterns of leadership that drove the returns over the past couple of years is set to continue, leaving room for disappointment. For example, at our London conference, 58% of the votes – the highest ever – were for the US equity market to be the best performer in 2025. This marks an increase from 32% last year and 18% the year before. Meanwhile, Europe remains the least preferred, receiving only 8% of the votes compared to 13% last year (Exhibit 9). We find similar examples of US exceptionalism as a driver of outperformance in the responses at our Asia Strategy conference where a record low 3% believed Europe would outperform.
Exhibit 9: Which region will perform best in 2025 (in local currency terms)?
Based on respondents at our GS Global Strategy conference, London January 2022, 2023, 2024 & January 2025
Source: Goldman Sachs Global Investment Research
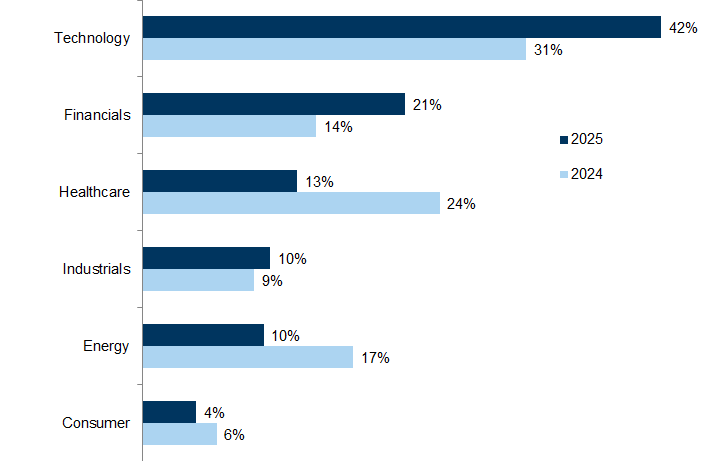
There was a similar degree of confidence in the ongoing dominance of the technology sector as the likely winner this year (Exhibit 10).
Exhibit 10: Which sector will perform best in 2025?
Based on respondents at our GS Global Strategy conference, London January 2025
Source: Goldman Sachs Global Investment Research
At the same time, the outperformance of cyclical sectors – a reflection of growing investor confidence in growth – has also led them to become expensive and vulnerable to any slowing of growth.
Exhibit 11: The strength in equities in recent months has reflected higher growth expectations
Cyclicals vs. defensives price performance. Indexed to 100 on 01-Jan 2023
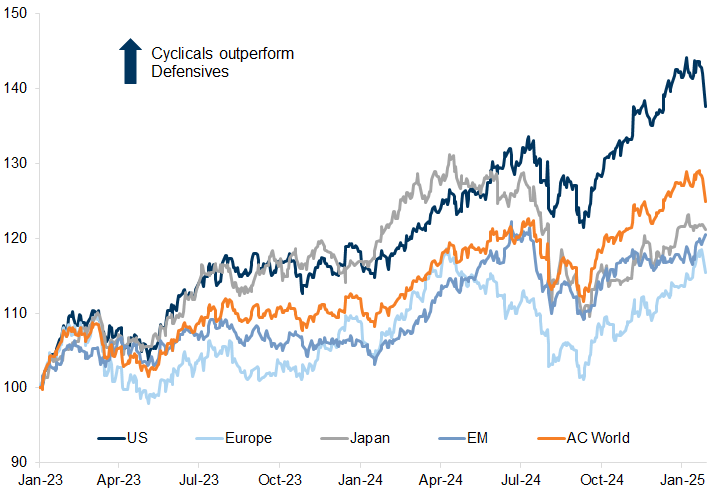
For details on the construction of the indices, please see: Cyclicals vs. Defensives: A global implementation
Source: Datastream, Worldscope, Goldman Sachs Global Investment Research
8. While the macro set up for equities remains supportive, we have been recommending that investors stay invested but diversify to improve risk adjusted returns. This takes several forms. First, from an asset allocation perspective, we have recommended staying long equities but hedging the downside risk while also being overweight bonds. Second, within the US, we have recommended focusing on the equally weighted S&P or the S&P 400. Third, from a sector perspective, we have also favoured global growth compounders outside of the technology sector (our list of EX Tech Compounders); these have the advantage of being cheaper than technology but also more diversified. Fourth, geographically we have called for more breadth in investor exposure.
9. Some of these opportunities have begun to pay off triggered by the events this week, and we would anticipate further opportunities to diversify. Bonds, for example, have generally rallied while equities have sold off. Despite expectations so far non-US equity markets have been outperforming since the start of this year (Exhibit 12). Our forecasts point to similar total returns across most regions in 2025, providing a broader scope for diversification.
Exhibit 12: Despite expectations, so far non-US equity markets have been outperforming since the start of this year
1-month returns in USD. % of market cap
Source: Datastream, Goldman Sachs Global Investment Research
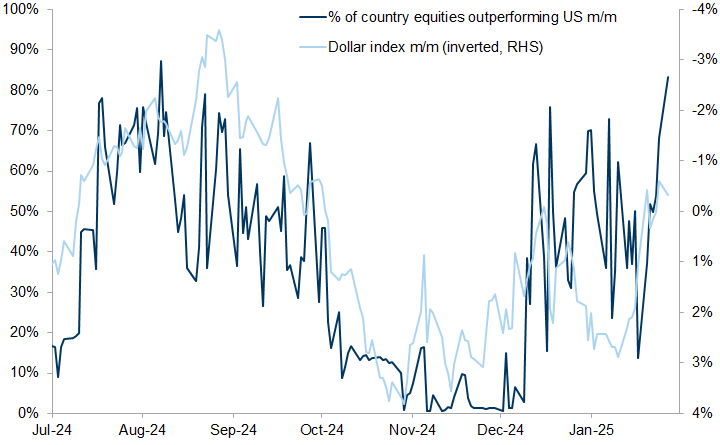
Europe – which was the least favoured market this year according to our survey – has been the best performing (Exhibit 13) so far. It has benefited from a lower currency but also (as it did in 2022), lower exposure to technology.
Exhibit 13: Europe outperformed YTD, also thanks to the contribution from a weaker dollar
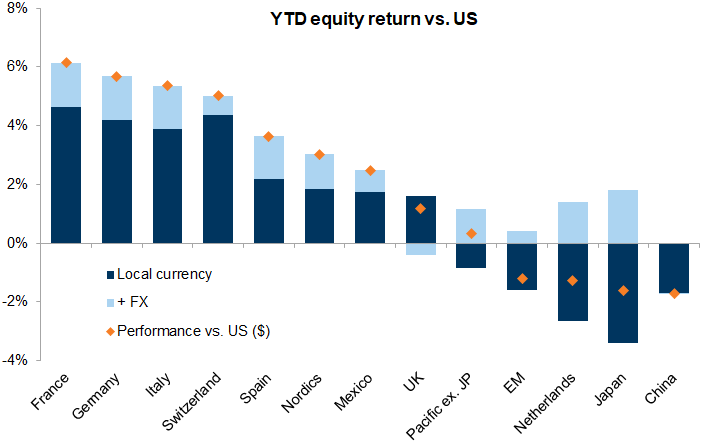
Source: Datastream, Goldman Sachs Global Investment Research
The hit to the technology sector has also resulted in the outperformance of our Ex Tech Compounders (ETCs) list, many of which are relatively defensive companies that remain relatively cheap (Exhibit 14 and Exhibit 15).
Exhibit 14: The hit to the technology sector has also resulted in the outperformance of our Ex Tech Compounders list (ETCs)...
Performance of Ex-Tech Compounders vs. the Magnificent 7 (indexed to 100 in Jan 2023)
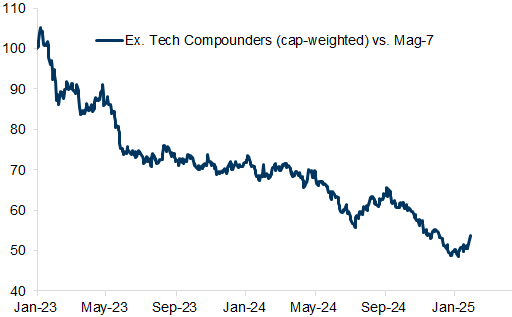
Source: Datastream, Goldman Sachs Global Investment Research
Exhibit 15: ...many of which are relatively defensive companies that remain relatively cheap
12m fwd P/E premium
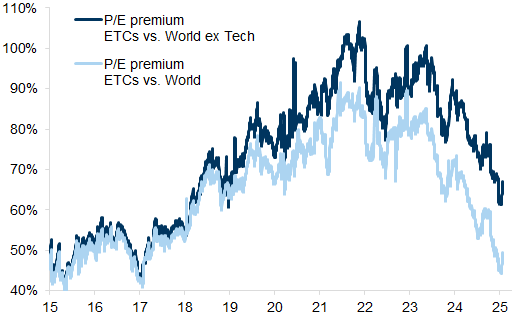
Source: Datastream, Goldman Sachs Global Investment Research
We have also been suggesting that the bifurcation of growth versus value – a pattern that has dominated equity returns over recent years – is also breaking down in favour of a more eclectic mix of value and growth. While technology grabs much of the headlines, for example, over the past couple of years US technology has outperformed together with European banks, from a total return standpoint (Exhibit 16). This is a mix of value and growth that we have not seen for many years.
Exhibit 16: While technology grabs much of the headlines, over the past couple of years US technology has outperformed together with, for example, European banks
Total return; Indexed to 100 in Jan 2022
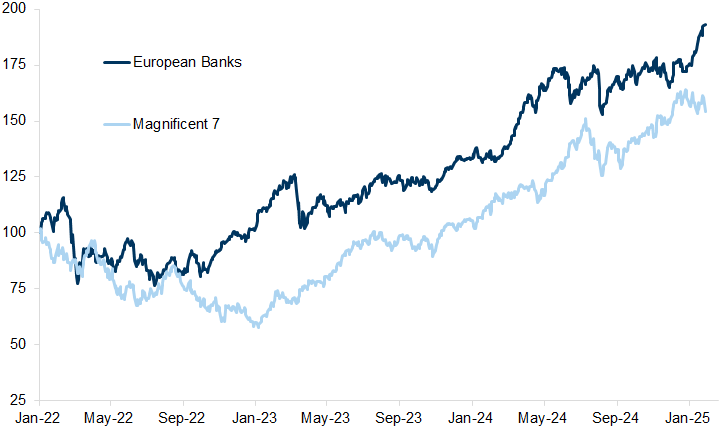
Source: Datastream, Goldman Sachs Global Investment Research
10. Despite the market moves this week, we reiterate our view that this is not a bear market and there remain attractive opportunities both within the US and also in technology. Interestingly, the PEG ratio for technology versus the World stock market – which had risen sharply in recent months – has now converged (Exhibit 17). This suggests that we are not at the start of a major rotation out of all that has performed best into everything that has lagged, but rather are at the start of a longer period of market broadening. This could also provide opportunities for the Hyperscalers as costs come down, and they are less constrained by the supply of chips. It is also noteworthy that our US strategy team's recommendation of broadening out within the technology space into their Phase 3 of the AI evolution with the potential to monetize AI by generating incremental revenues (GSCBAIP3) has outperformed over the past couple of days.
Exhibit 17: The PEG ratio for technology versus the World stock market – which had risen sharply in recent months – has now converged
PEG ratio (12m fwd P/E divided by second 12m fwd EPS growth)
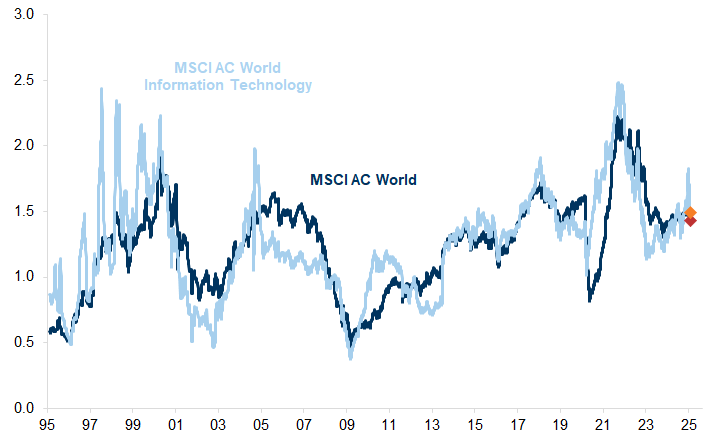
Source: Datastream, Goldman Sachs Global Investment Research
Our view remains that this is an opportunity for selectivity and, as stock correlation falls (Exhibit 18) – the year of the Alpha Bet.
Exhibit 18: Pairwise correlations on a 12-month rolling basis have fallen, suggesting a more attractive opportunity set for alpha generation
12m average pairwise correlation
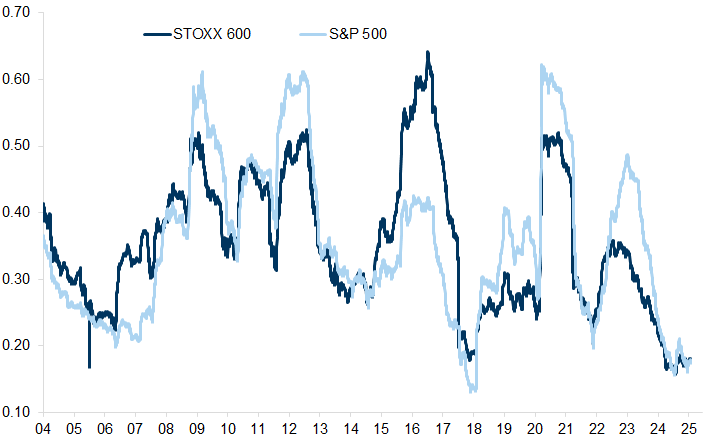
Source: Bloomberg, Goldman Sachs Global Investment Research
Investors should consider this report as only a single factor in making their investment decision. For Reg AC certification and other important disclosures, see the Disclosure Appendix, or go to www.gs.com/research/hedge.html.