- Intro
- 5 key points from the Goldman Sachs Hedge Fund Trend Monitor
- Performance, leverage, and short interest
- Concentration, crowding, and turnover
- Thematic and factor tilts
- Sector positions
- The Hedge Fund VIP List: "The stocks that matter most"
- The most concentrated hedge fund positions
- Rising and falling stars
- ETF ownership
- Appendix A: Hedging the Hedge Fund VIP List
- Appendix B: Hedge fund data tables
- Change in popularity: Largest increase and decrease in number of hedge fund owners
- Concentrated shorts: Highest short interest outstanding as a percentage of market cap
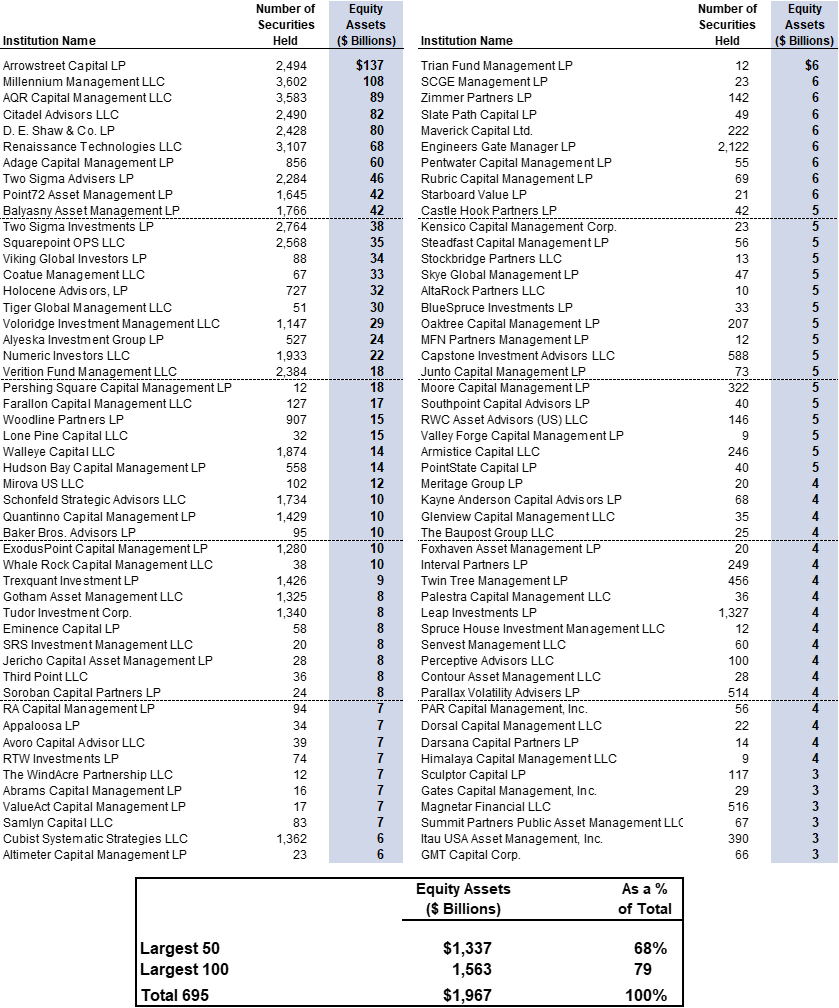
- Appendix C: 100 largest hedge funds in our analysis ranked by equity assets
- Appendix D: Drawbacks of our hedge fund holding analysis
5 key points from the Goldman Sachs Hedge Fund Trend Monitor
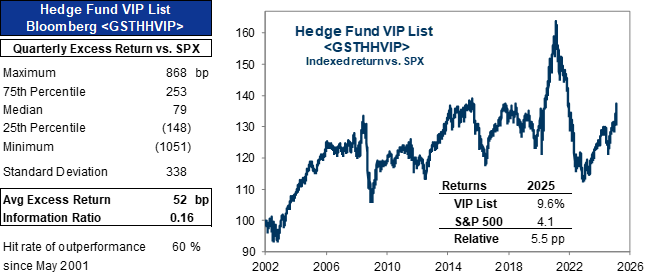
PERFORMANCE: Popular hedge fund long positions have supported US equity long/short hedge fund returns of +3% YTD. Our Hedge Fund VIP list of the most popular long positions (ticker: GSTHHVIP) has returned +10% YTD, outperforming the S&P 500 (+4%), the equal-weight S&P 500 (+3%) and the most shorted stocks (GSCBMSAL, +4%). Hedge fund VIPs have outperformed the S&P 500 by 11 pp during the last 6 months, the largest magnitude of outperformance since 2021.
LEVERAGE AND SHORT INTEREST: Hedge funds have continued to lift gross and net leverage. Fundamental long/short hedge fund gross and net leverage now rank in the 100th and 73rd percentiles vs. the last five years. Funds continue to use macro products on both sides of their portfolios. Both the ETF share of the hedge fund long portfolio and hedge fund equity futures shorts are large relative to history.
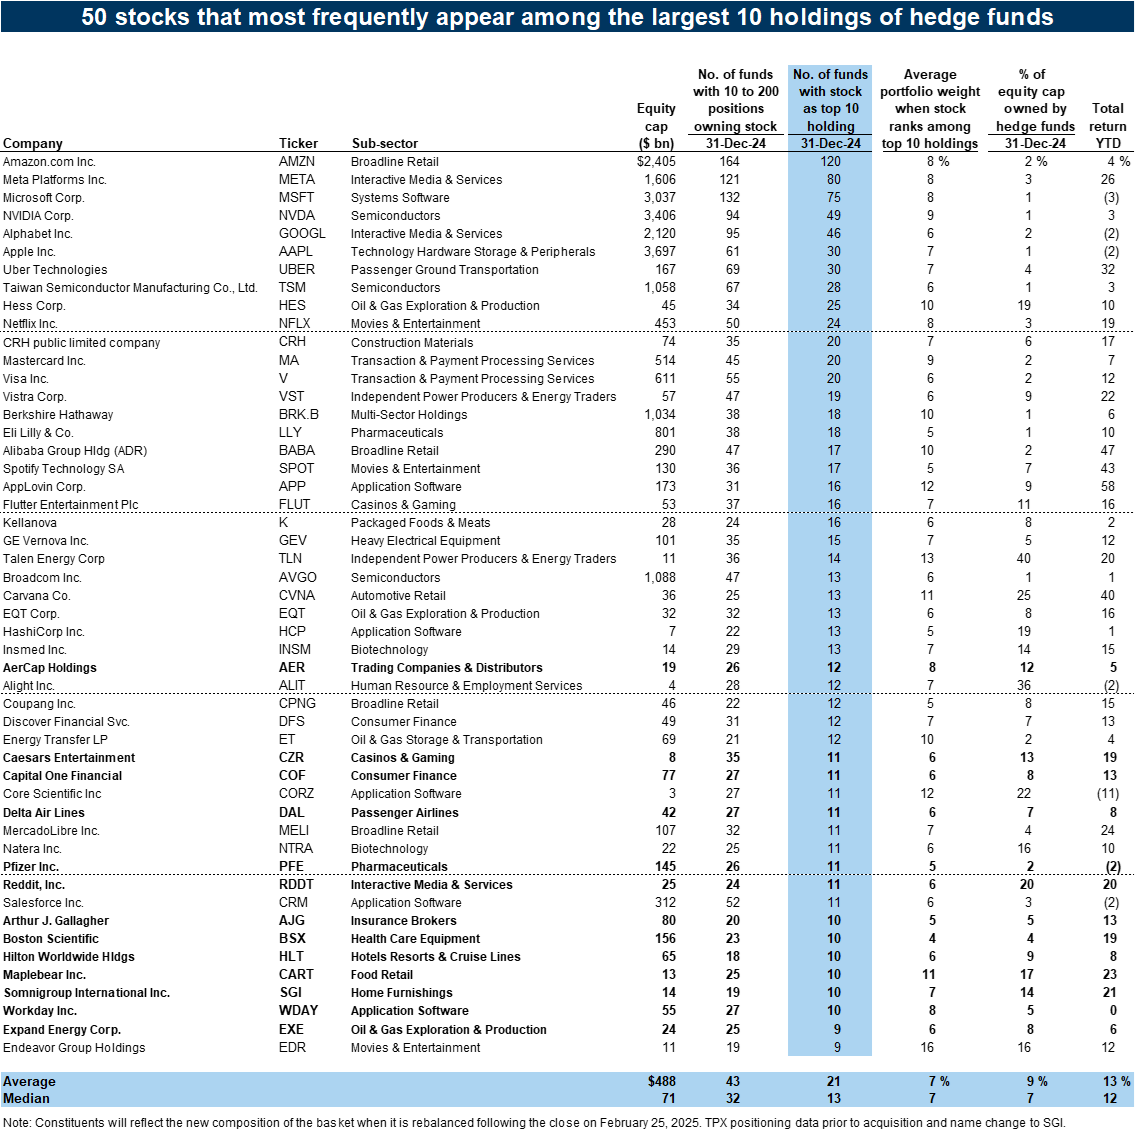
HEDGE FUND VIPS: The mega-caps continue to sit atop our list of the most popular hedge fund long positions. AMZN, META, MSFT, NVDA, GOOGL, and AAPL remain as the six most popular stocks. The VIP list contains the 50 stocks that appear most often among the top 10 holdings of fundamental hedge funds. The basket has outperformed the S&P 500 in 60% of quarters since 2001 with an average quarterly excess return of 52 bp. 13 new constituents: AER, AJG, BSX, CART, COF, CZR, DAL, EXE, HLT, PFE, RDDT, SGI, WDAY.
THEMATIC ROTATIONS: Hedge funds participated in post-election rotations. During 4Q hedge funds lifted the average ownership of potential deregulation beneficiaries, stocks exposed to small businesses, and stocks with domestic sales. In contrast, funds reduced ownership of stocks exposed to China and tariffs. QRVO, a company exposed to supply chains in China, ranked among our list of Falling Stars with the largest decrease in hedge fund popularity. Hedge funds also rotated into companies with AI-enabled revenues. Funds boosted the weight of the Software industry in the hedge fund long portfolio to 11%, the largest weight since 3Q 2023. Semiconductors MU and AMD joined our list of Falling Stars.
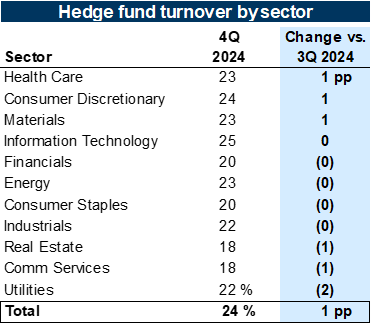
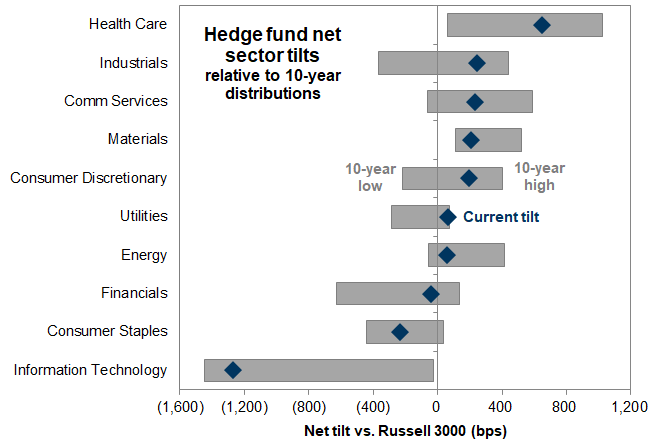
SECTORS: Hedge funds flipped to underweight Financials during 4Q and lifted exposure to Health Care and Comm Services. The reduction in Financials net tilt followed sharp outperformance after Election Day. However, many Financials stocks entered our list of Hedge Fund VIPs and Rising Stars. Consistent with the theme of getting selective, Health Care and Comm Services are two sectors with high dispersion scores offering opportunities for stock-pickers.
Performance, leverage, and short interest
Exhibit 1: Equity hedge funds have returned 3% YTD
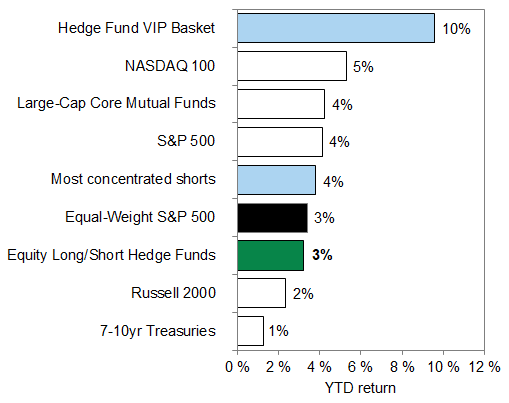
Exhibit 2: Popular hedge fund positions have fared well YTD
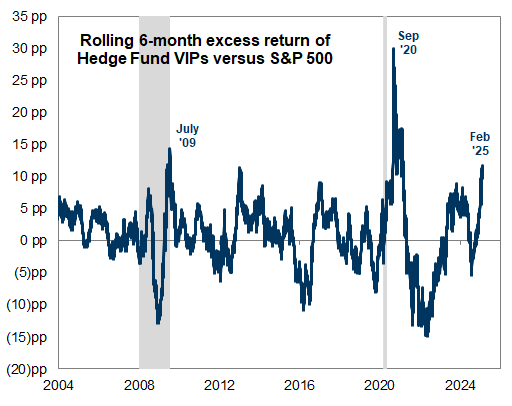
Exhibit 3: The most popular hedge fund long positions have outperformed in most sectors YTD
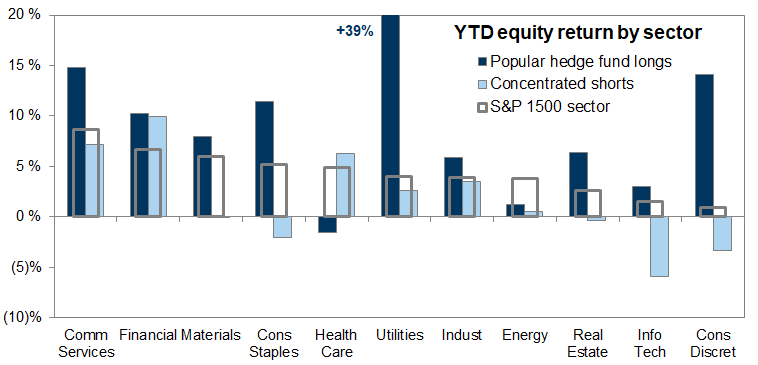
Exhibit 4: Hedge fund gross and net leverage
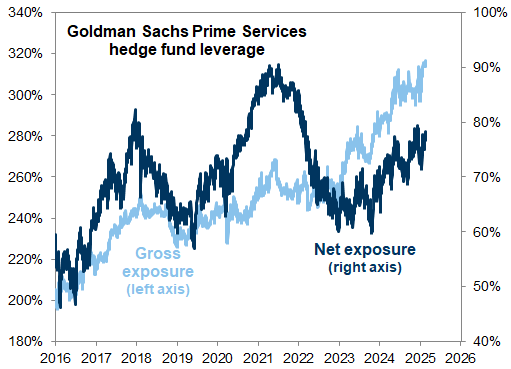
Exhibit 5: Hedge fund leverage relative to recent history
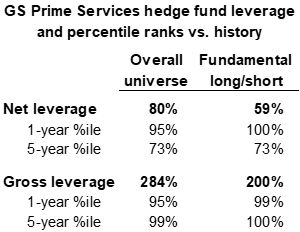
Exhibit 6: Short interest for the typical stock remains low vs. history
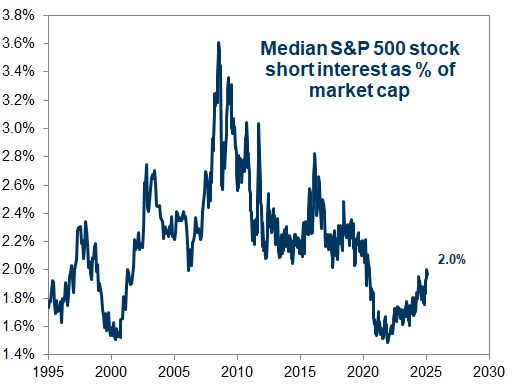
Exhibit 7: Short interest is most elevated in defensive sectors
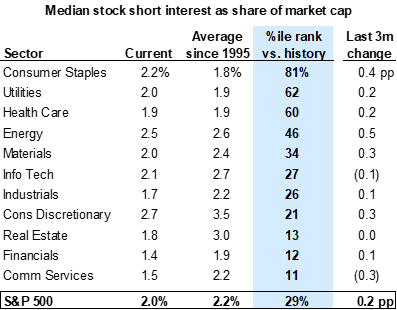
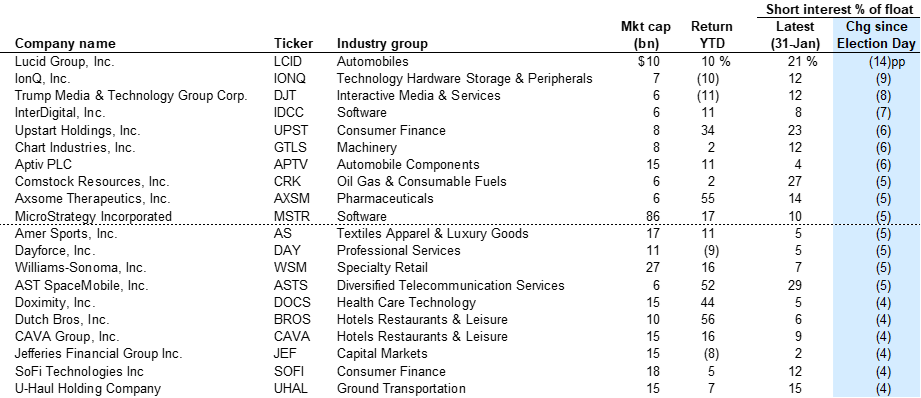
Exhibit 8: Stocks with largest increases in short interest since Election Day
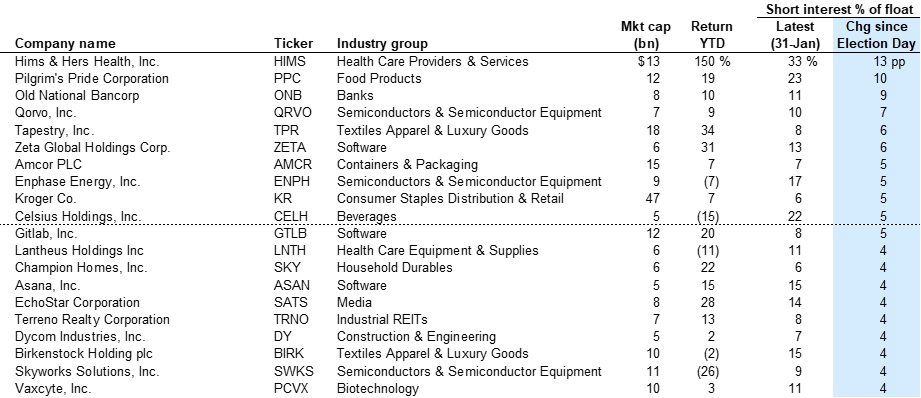
Exhibit 9: Stocks with largest decreases in short interest since Election Day
Concentration, crowding, and turnover
Exhibit 10: Hedge fund portfolio density remained elevated in 4Q
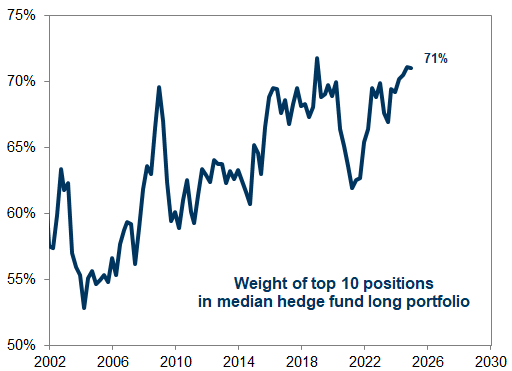
Exhibit 11: Crowding across hedge funds increased in 4Q
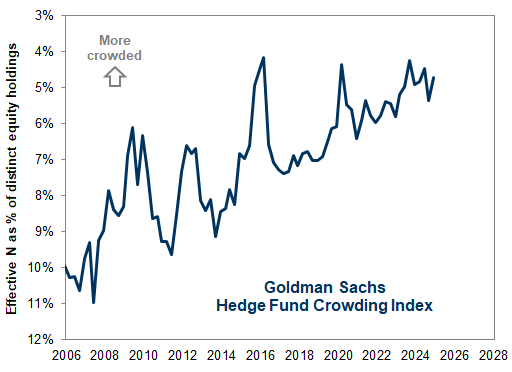
Exhibit 12: Portfolio turnover increased in 4Q
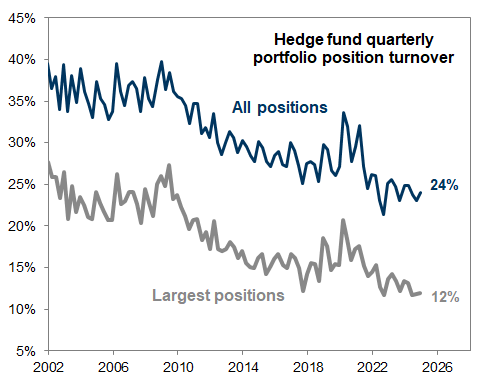
Exhibit 13: Portfolio turnover increased the most in Health Care
Thematic and factor tilts
Exhibit 14: Hedge funds increased exposure to "Trump trades" during 4Q
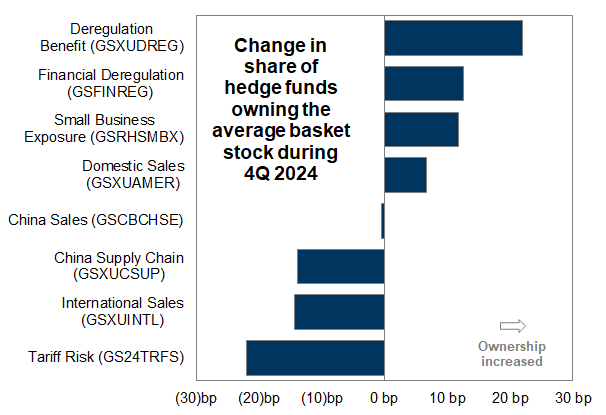
Exhibit 15: Short interest of US Government Exposure Risk constituents (GSXUDOGE)
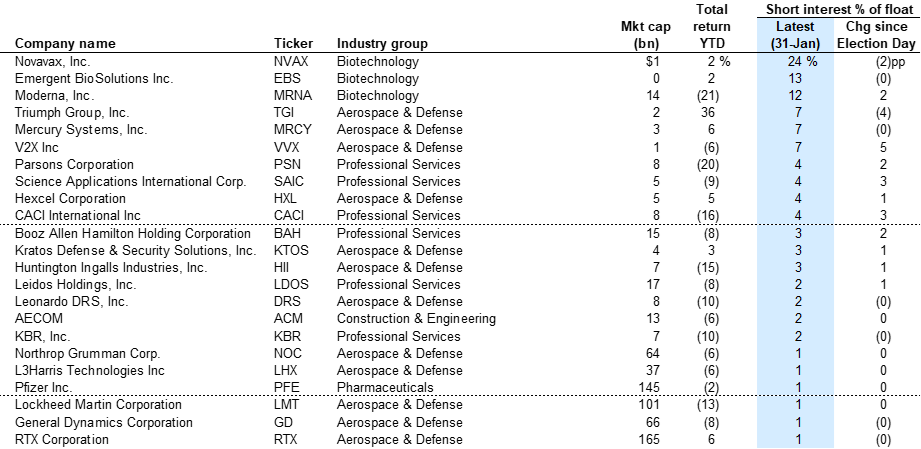
Exhibit 16: Hedge fund ownership of select AI-exposed stocks in recent quarters
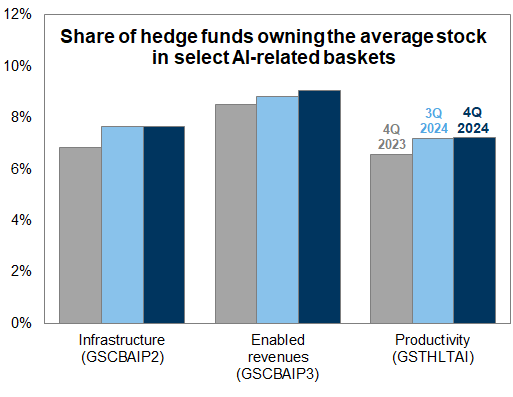
Exhibit 17: AI Phase 3 (enabled-revenues) stocks have outperformed YTD
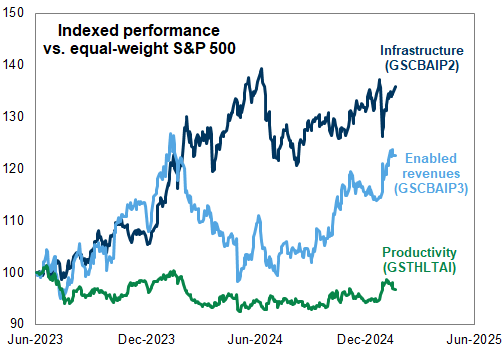
Exhibit 18: Hedge funds trimmed positions on net in the Magnificent 7 during 4Q 2024
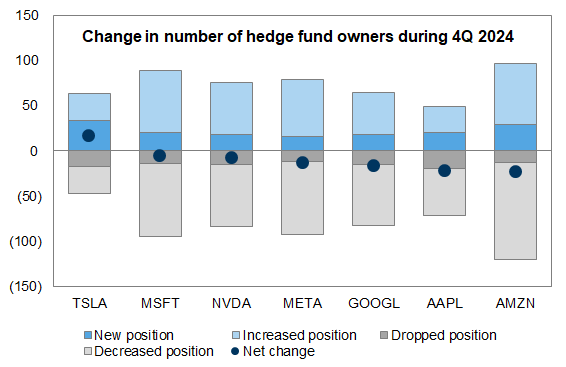
Exhibit 19: Hedge funds continued to shift toward Cyclicals vs. Defensives
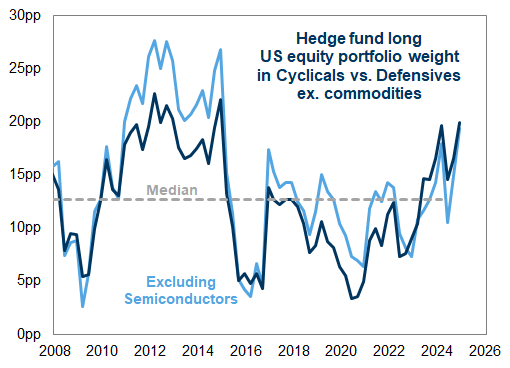
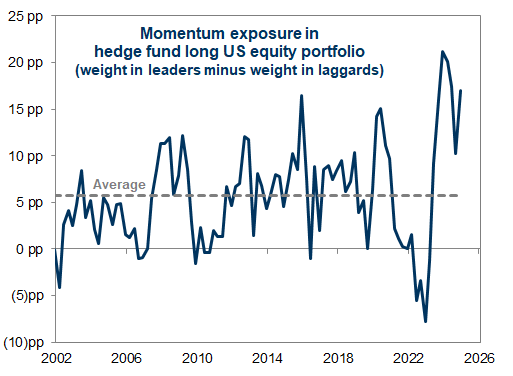
Exhibit 20: Funds rotated sharply toward Momentum during 4Q
Sector positions
Exhibit 21: Hedge fund sector allocations relative to the Russell 3000 and large-cap mutual funds
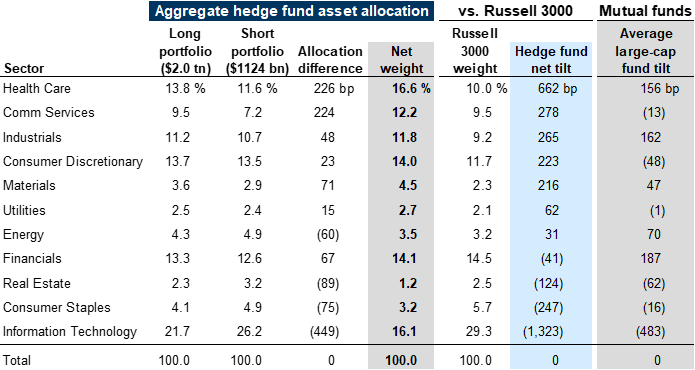
Exhibit 22: Changes in hedge fund sector tilts vs. Russell 3000 during 4Q
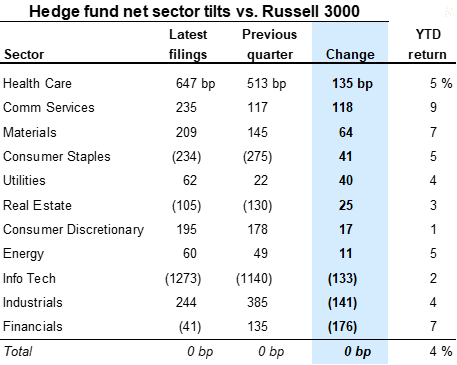
Exhibit 23: Hedge funds rotated away from Financials
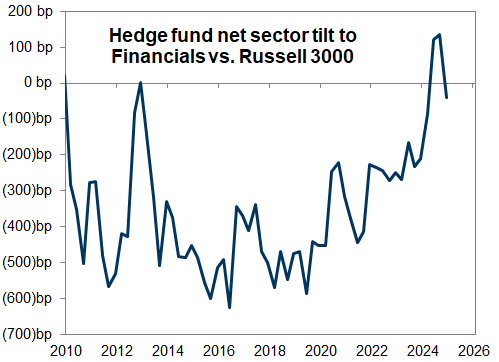
Exhibit 24: Subsector tilts and changes in tilts
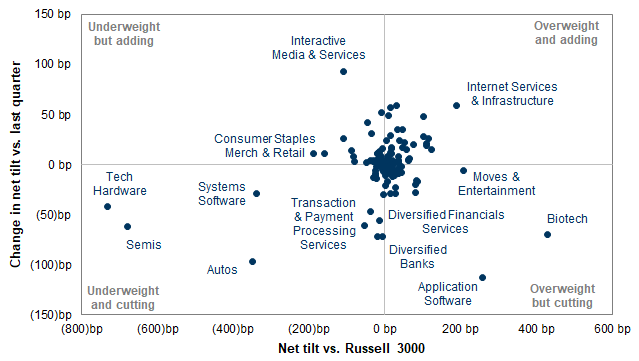
Exhibit 25: Financials stocks with the largest net increases and decreases in hedge fund popularity last quarter
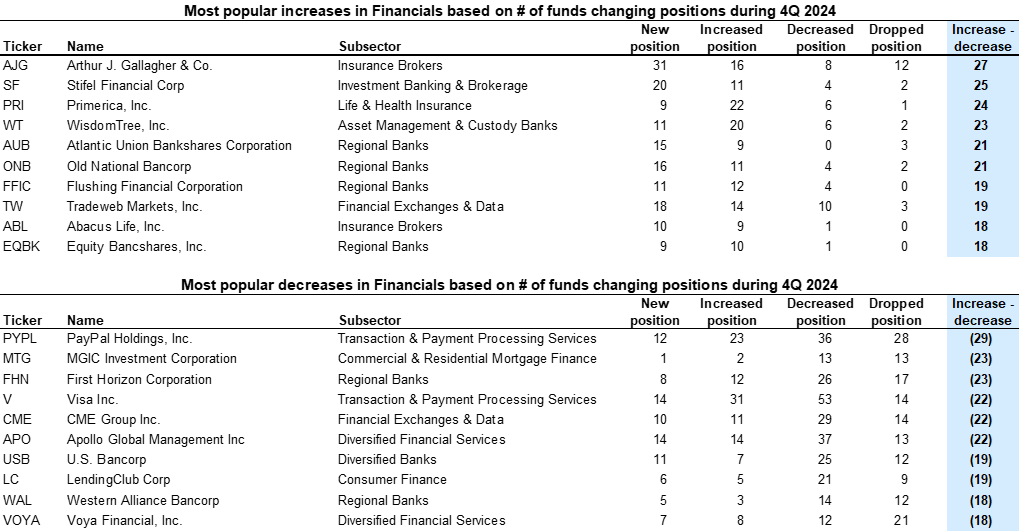
Exhibit 26: Hedge fund net sector tilts relative to past decade
The Hedge Fund VIP List: "The stocks that matter most"
Exhibit 27: Hedge fund VIPs have outperformed by 52 bp on average each quarter since 2001 (95 quarters)
GSTHHVIP: The 50 stocks that matter most to hedge funds
Exhibit 28: Very Important Positions (VIP) for hedge funds
The most concentrated hedge fund positions
Exhibit 29: The most concentrated stocks have outperformed the S&P 500 by 4 pp YTD
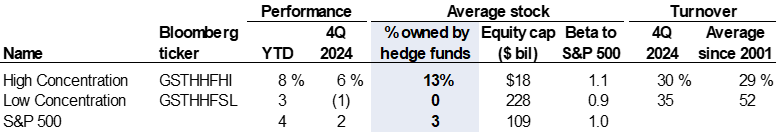
Goldman Sachs S&P 500 hedge fund concentration baskets
Exhibit 30: The 20 S&P 500 stocks with the most concentrated hedge fund ownership <ticker: GSTHHFHI>
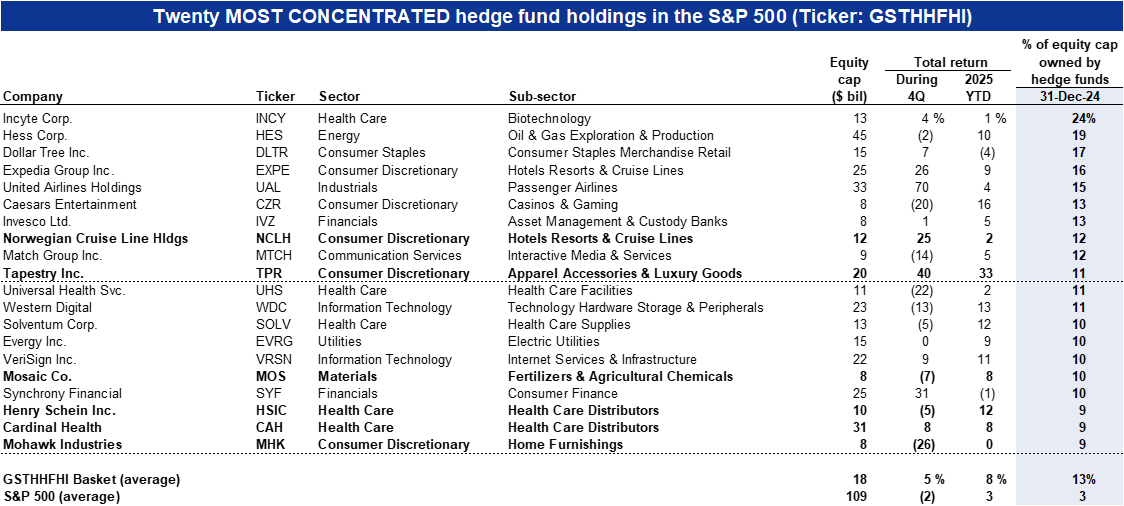
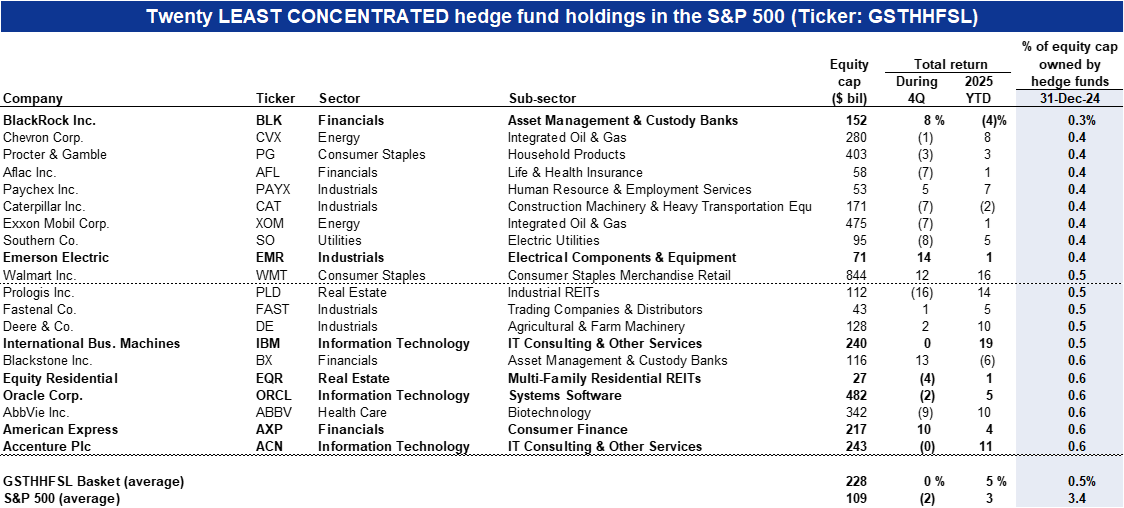
Exhibit 31: The 20 S&P 500 stocks with the least hedge fund concentration <ticker: GSTHHFSL>
Rising and falling stars
Exhibit 32: Rising stars: Russell 1000 stocks with the largest increase in number of hedge fund owners during 4Q 2024
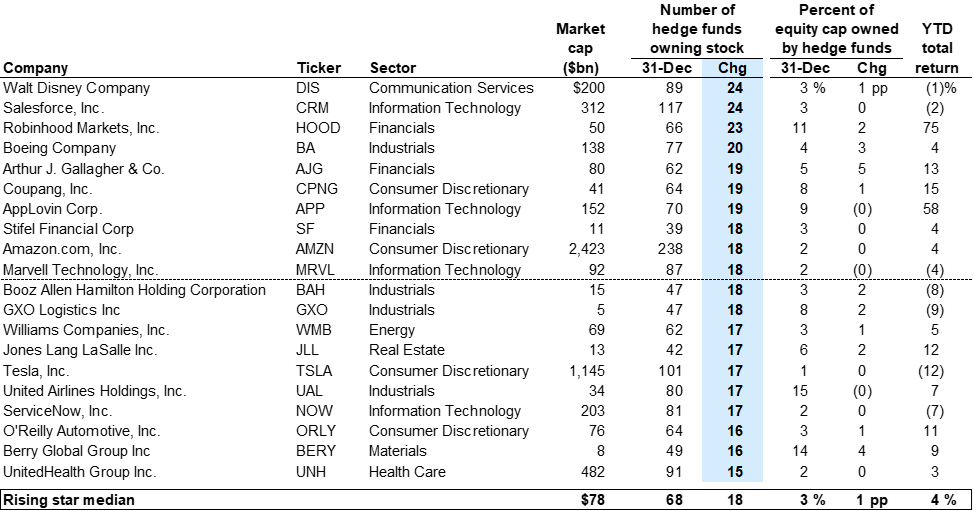
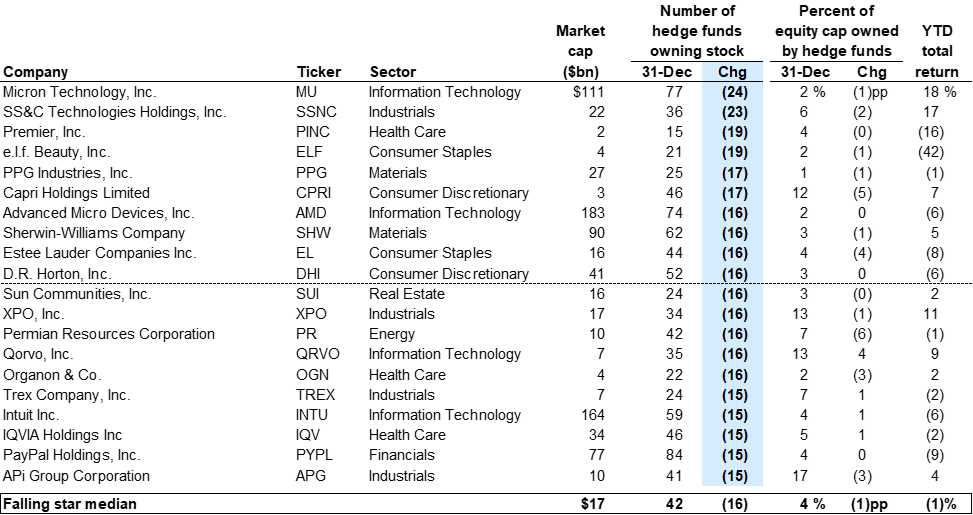
Exhibit 33: Falling stars: Russell 1000 stocks with the largest decrease in number of hedge fund owners during 4Q 2024
ETF ownership
Exhibit 34: Hedge fund ETF long exposure
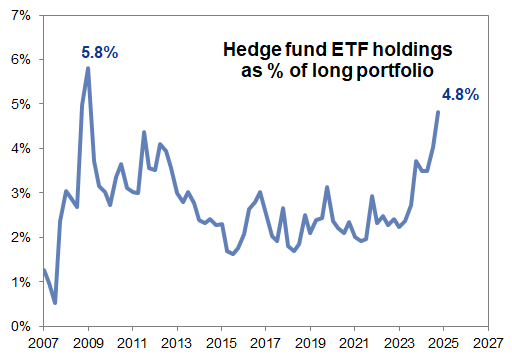
Exhibit 35: Hedge fund positions in sector ETFs
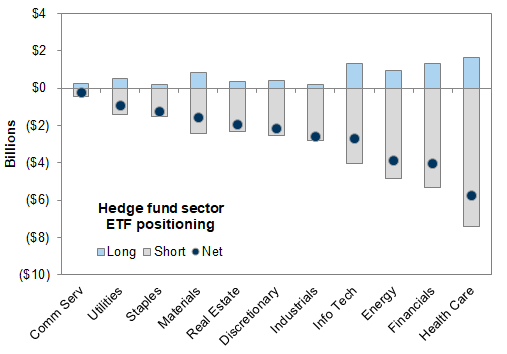
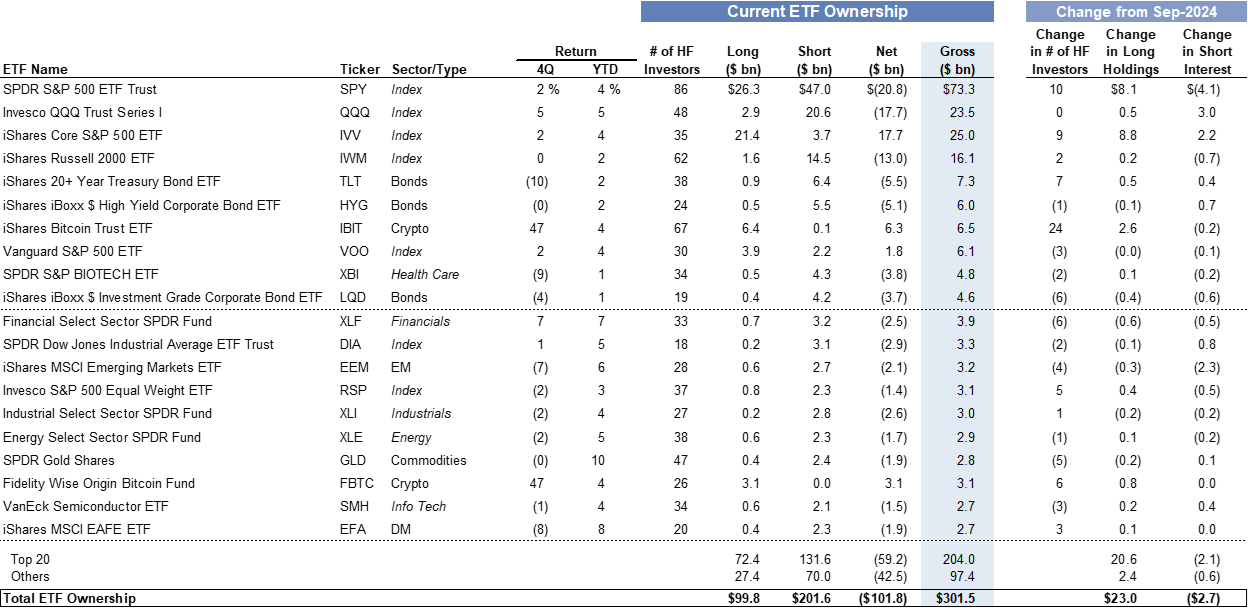
Exhibit 36: Top 20 ETFs by hedge fund ownership (long and short)
Appendix A: Hedging the Hedge Fund VIP List
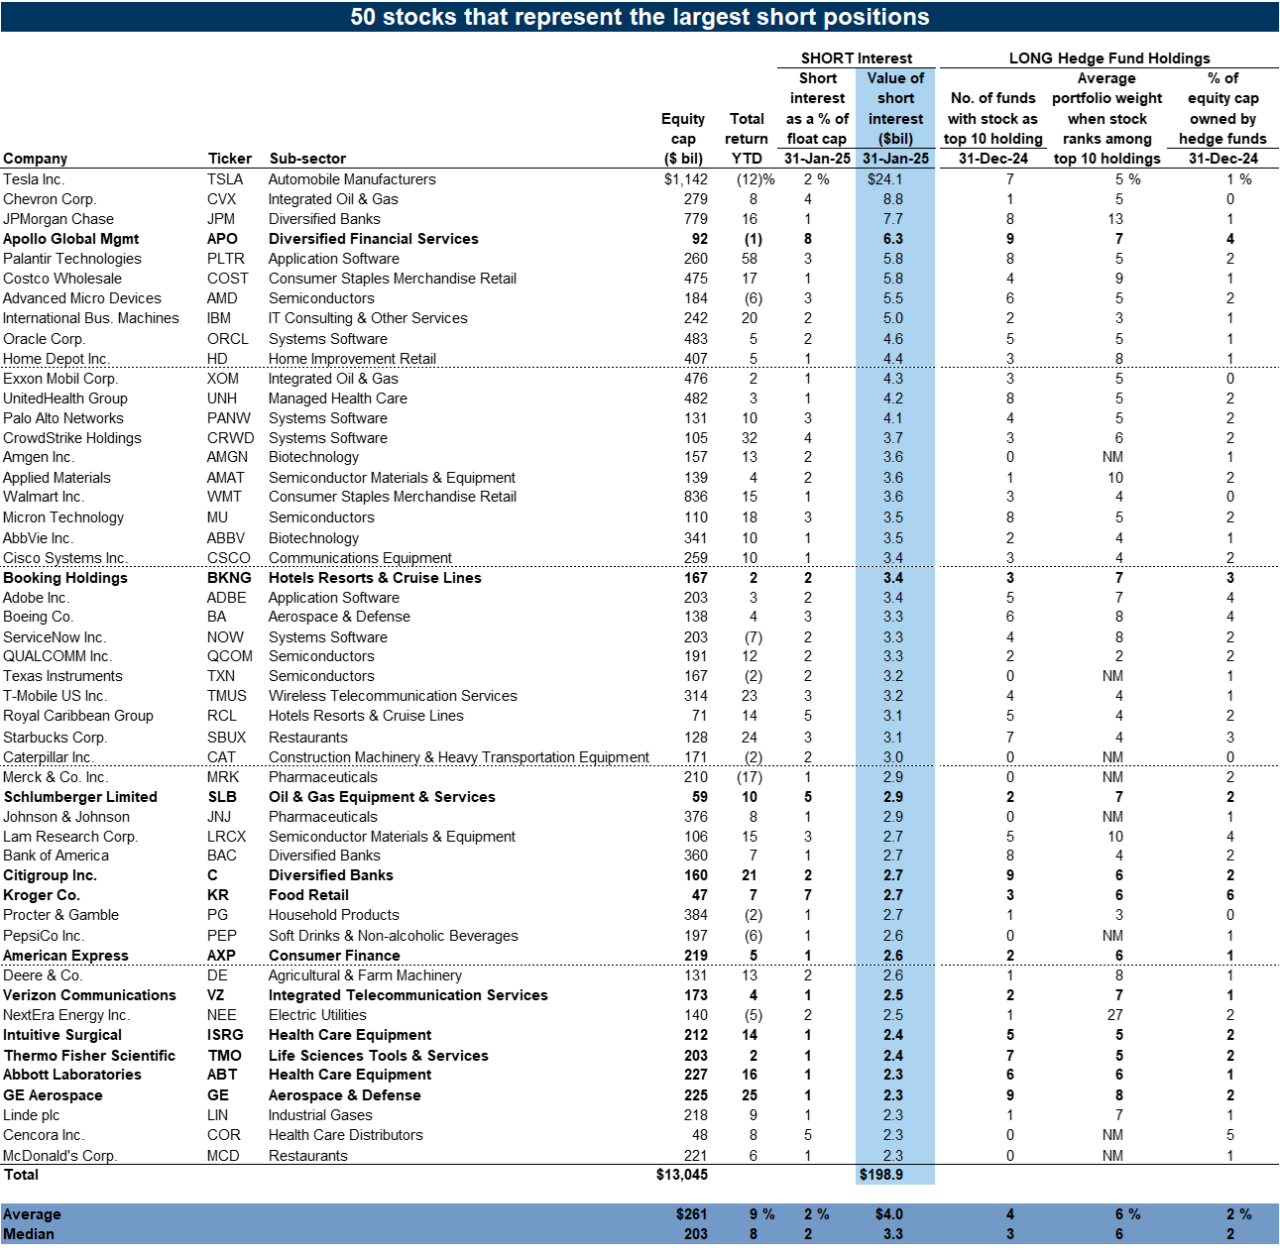
Exhibit 37: Our Very Important Short Positions (VISP) basket
Appendix B: Hedge fund data tables
Change in popularity: Largest increase and decrease in number of hedge fund owners
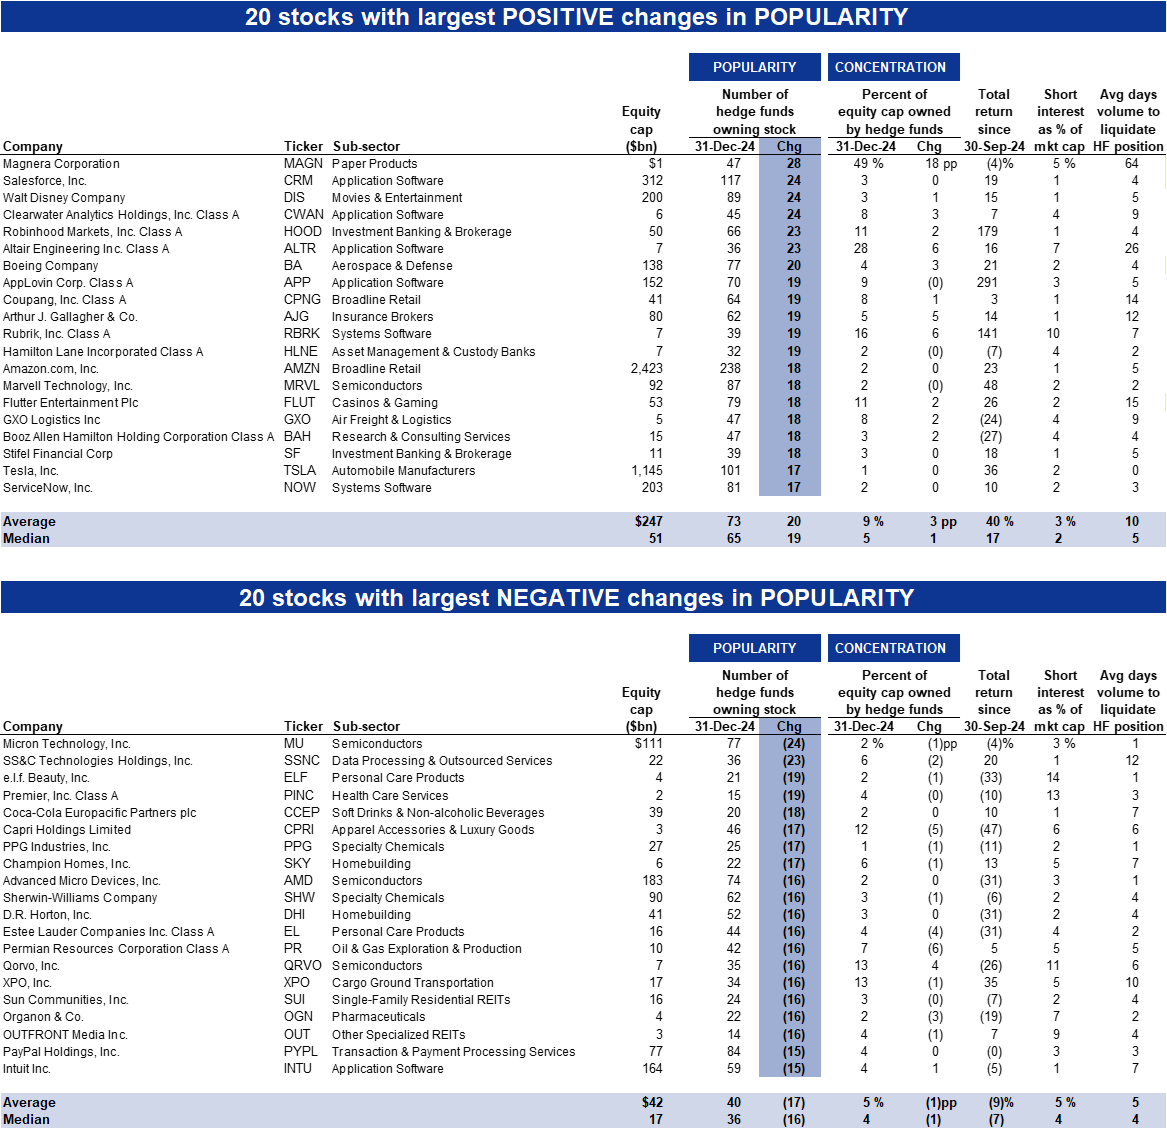
Exhibit 38: Change in popularity during 4Q 2024
Concentrated shorts: Highest short interest outstanding as a percentage of market cap
Exhibit 39: Highest short interest: Stocks over $25 billion in market cap
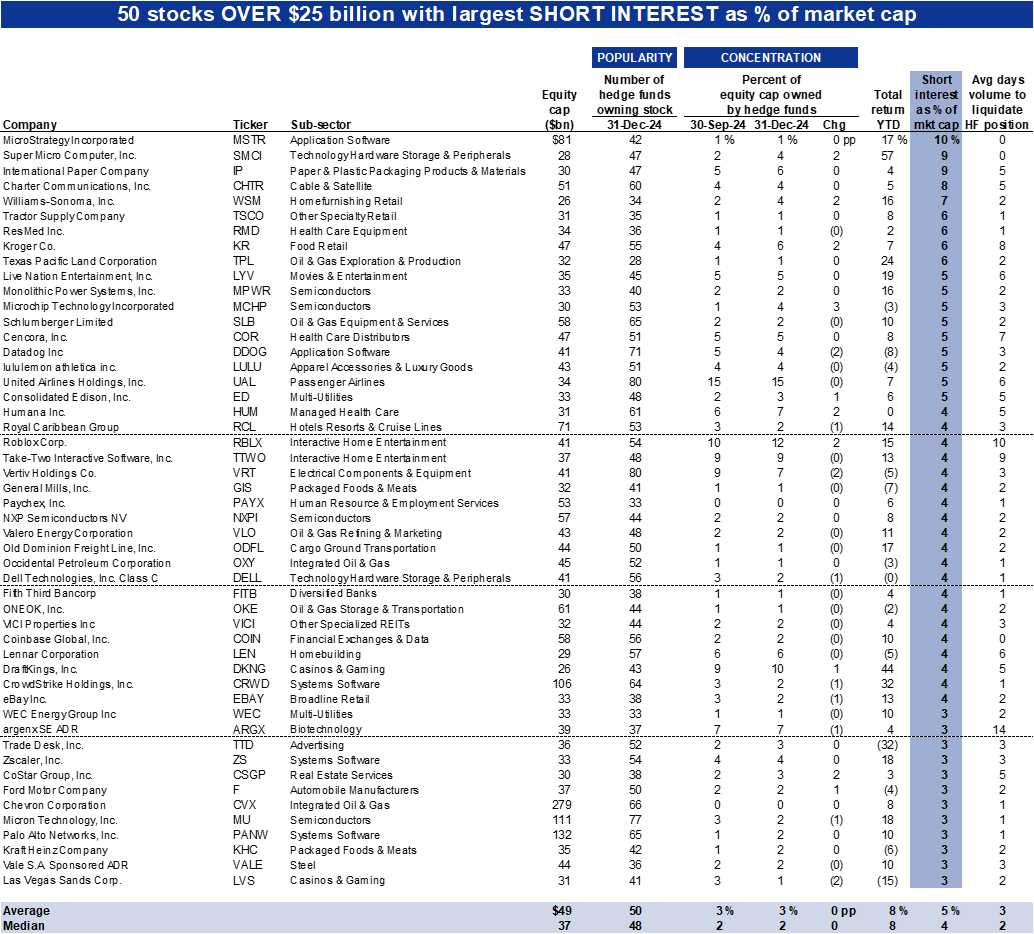
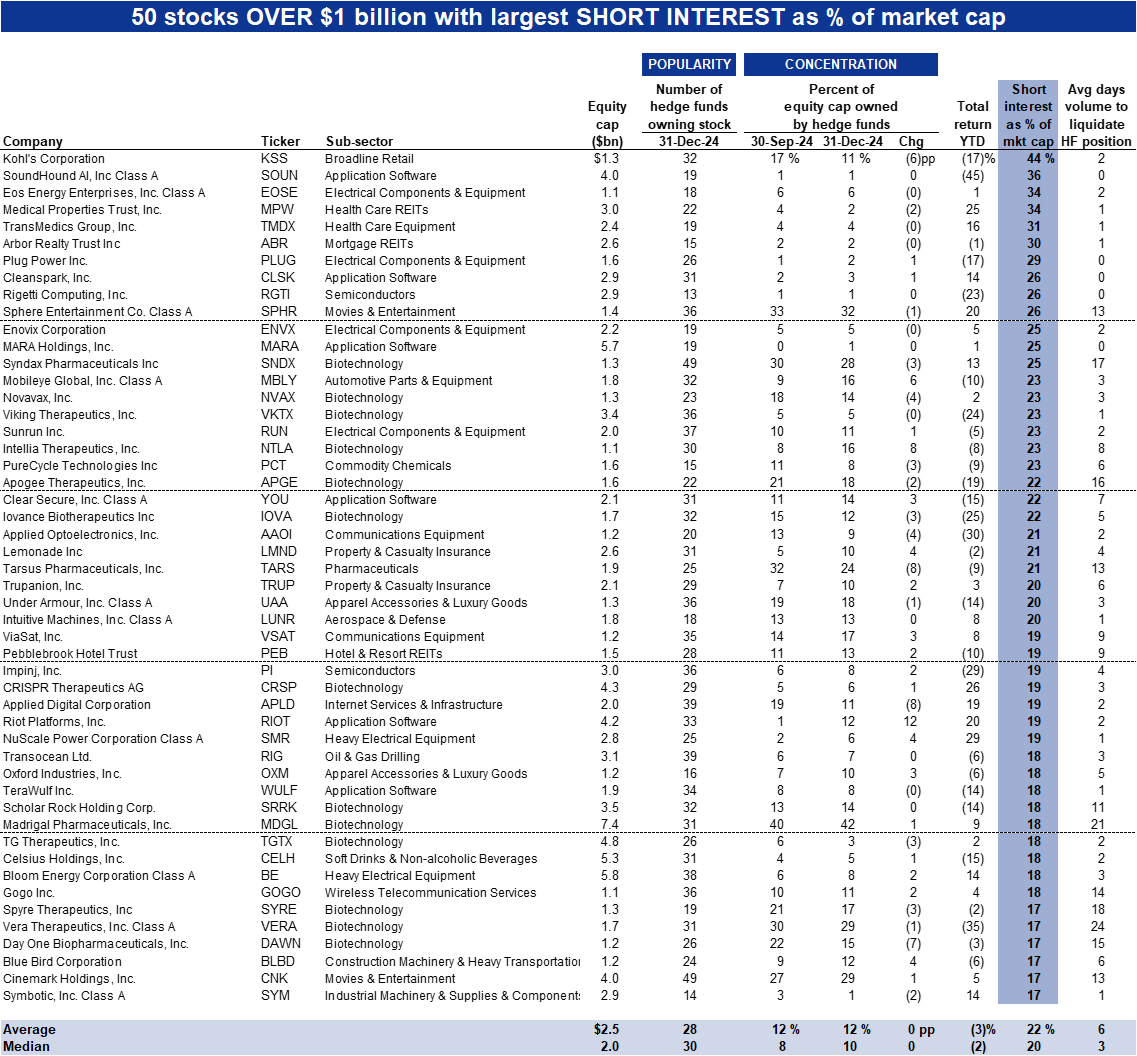
Exhibit 40: Highest short interest: Stocks over $1 billion in market cap
Appendix C: 100 largest hedge funds in our analysis ranked by equity assets
Appendix D: Drawbacks of our hedge fund holding analysis
Data limitations
Lack of international holdings
Incomplete reporting of short positions
Timeliness
Investors should consider this report as only a single factor in making their investment decision. For Reg AC certification and other important disclosures, see the Disclosure Appendix, or go to www.gs.com/research/hedge.html.