- Intro
- Conversations we are having with clients: The 5% S&P 500 drawdown
- S&P 500 earnings and return forecasts
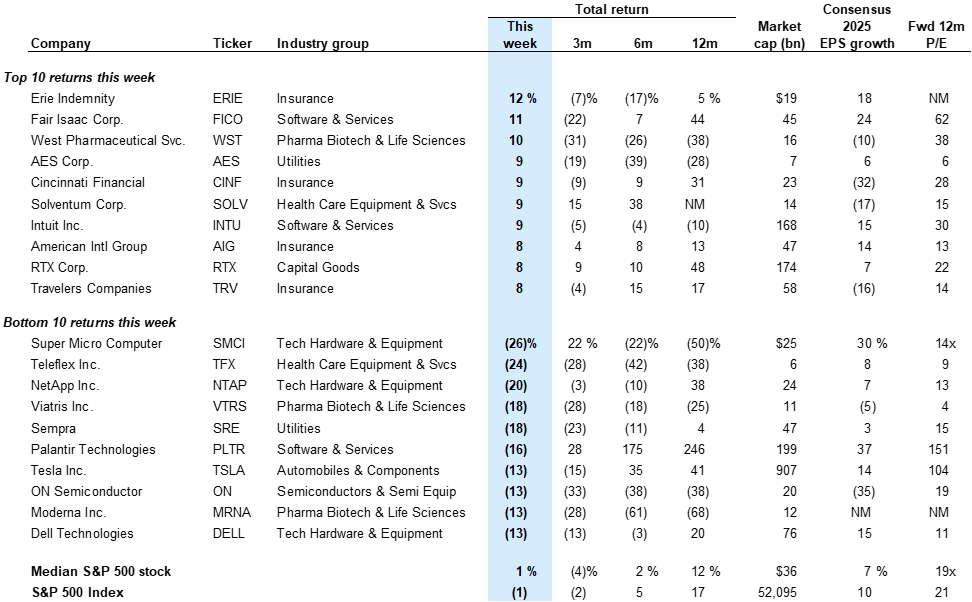
- Biggest stock movers this week
- Sentiment and flows
- Economic growth
- Interest rates and financial conditions
- Market breadth and concentration
- Correlation and volatility
- IPO Barometer and mutual fund performance
- Earnings growth
- Valuations
- YTD absolute and risk-adjusted returns
- Sector returns, earnings, and valuations
- Thematic baskets
- Factors
- Goldman Sachs global macro research cross-asset forecasts
The S&P 500 sold off by 5% during the past week, driven by both an unwind of elevated positioning and economic growth concerns. Within the equity market, Cyclicals have lagged Defensives by 9% and our Momentum factor has declined by 7%.
Our Sentiment Indicator stands at -0.4, substantially below the highs in late November but above levels that have historically signaled tactical upside as a result of depressed positioning. As a result, we believe an improvement in the US economic growth outlook will be required to fully reverse the recent equity market rotations. Next Friday's jobs report will be a key test. Policy signals that boost the growth outlook could also lift the market, but uncertainty remains high.
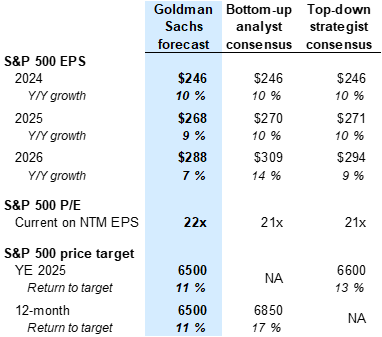
We revise our 2025 EPS growth forecast from 11% to 9% and maintain our 2026 growth forecast of 7%. The levels of our 2025 and 2026 EPS estimates remain unchanged at $268 and $288 following better-than-expected 2024 EPS growth but softer-than-expected economic data in 2025. The consensus bottom-up 2025 EPS estimate has been lowered by 1% since the start of the year but is now roughly in line with our top-down estimate. Elevated policy uncertainty creates risks in both directions around our forecast.
Looking further ahead, we maintain our year-end S&P 500 price target of 6500 (+9% from today). The equity market's pricing of the economic growth outlook is now in the ballpark of our economists' baseline economic growth forecasts, and the S&P 500 P/E of 21.5x is in line with our year-end S&P 500 P/E multiple forecast. We continue to expect equity returns will be more modest than last year and match the trajectory of earnings growth.
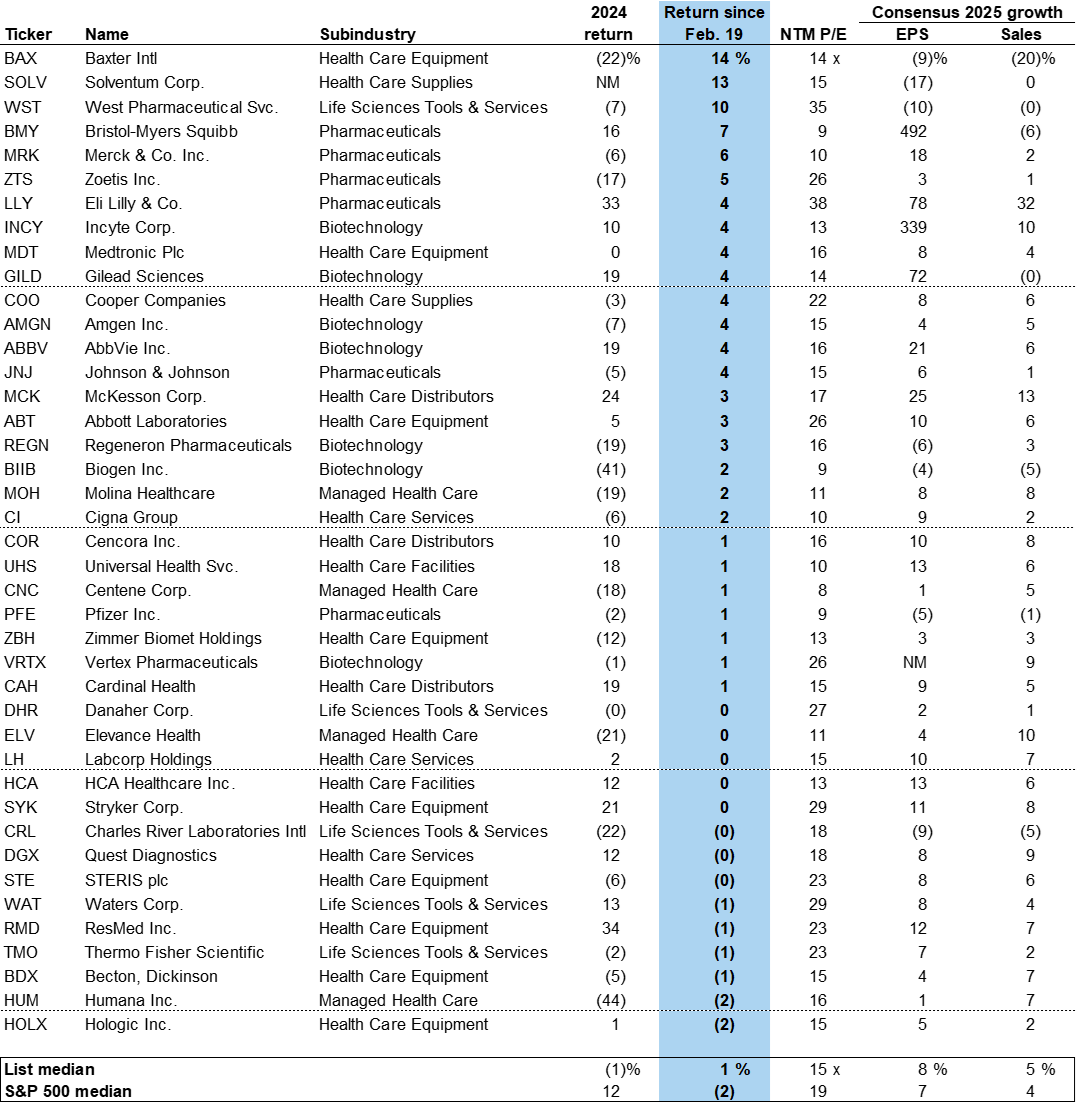
We continue to recommend investors own Health Care, which offers a defensive tilt and trades at historically low valuations despite outperforming the market by 7 pp YTD.
Conversations we are having with clients: The 5% S&P 500 drawdown
Exhibit 1: Our Sentiment Indicator has declined to -0.4
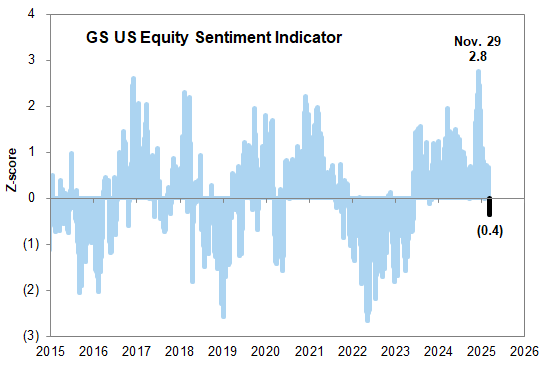
Exhibit 2: Performance of our Momentum factor
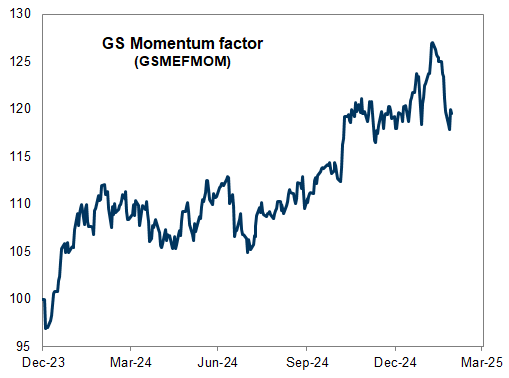
Exhibit 3: Our Momentum factor has sold off sharply
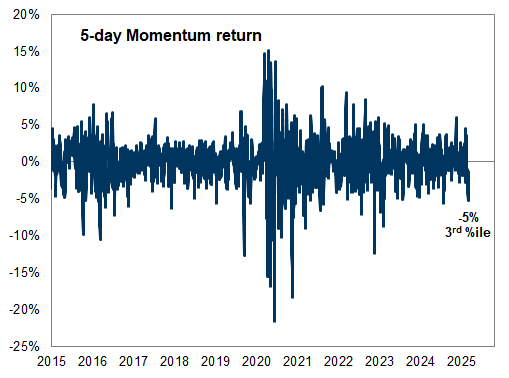
Exhibit 4: Cyclicals have sharply underperformed Defensives in recent weeks
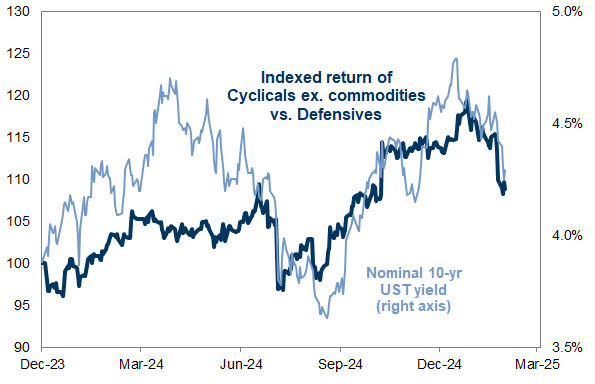
Exhibit 5: Previous sharp 1-week Momentum drawdowns
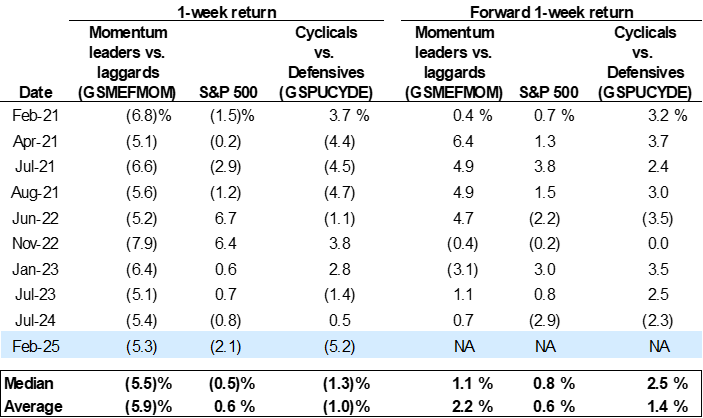
Exhibit 6: The S&P 500 P/E multiple is roughly in line with macro-implied fair value
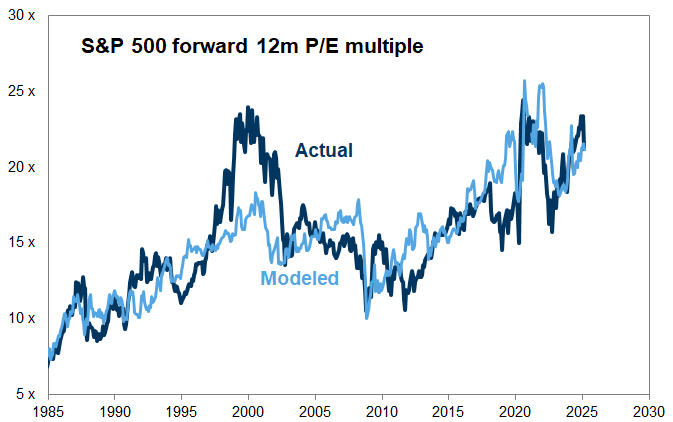
Exhibit 7: Economic growth is the primary driver of S&P 500 EPS growth
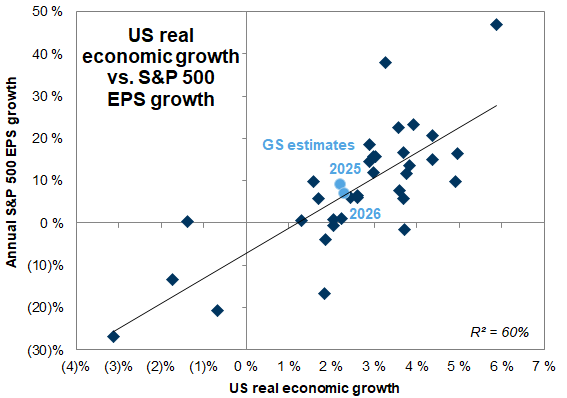
Exhibit 8: Consensus 2025 EPS growth estimates have come down recently
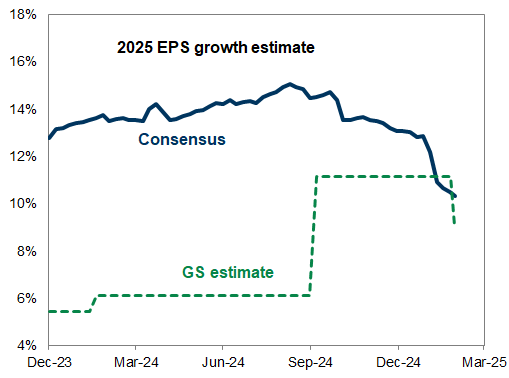
Exhibit 9: Cyclicals have had the most negative EPS revisions
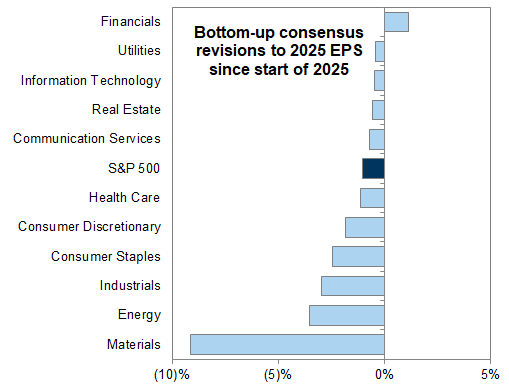
Exhibit 10: Positive Magnificent 7 EPS revisions have stalled
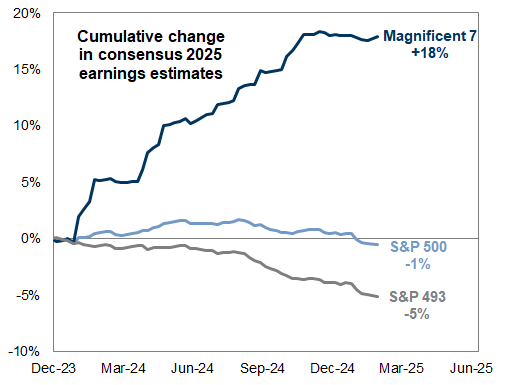
Exhibit 11: The magnitude of NVDA sales surprises has diminished
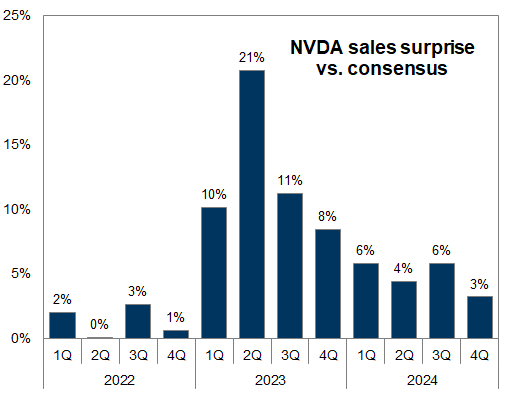
Exhibit 12: Path of consensus EPS estimates
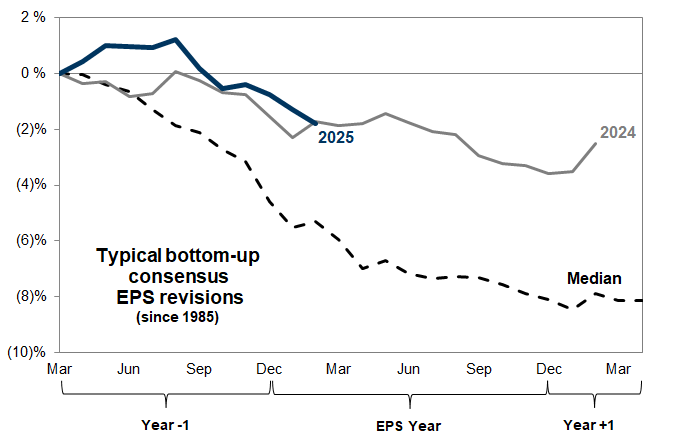
Exhibit 13: Absolute and relative sector valuations
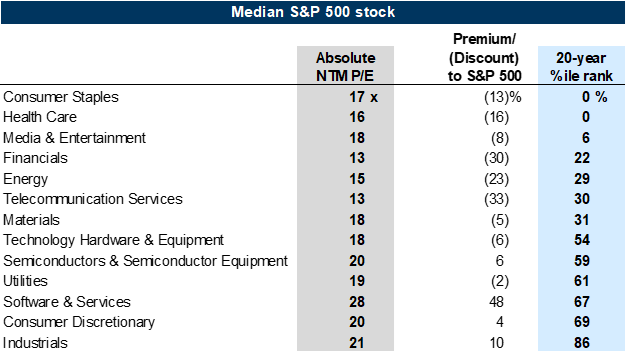
Exhibit 14: S&P 500 Health Care stocks that have outperformed the median S&P 500 stock since the Feb. 19 peak
S&P 500 earnings and return forecasts
Exhibit 15: Goldman Sachs top-down S&P 500 forecasts
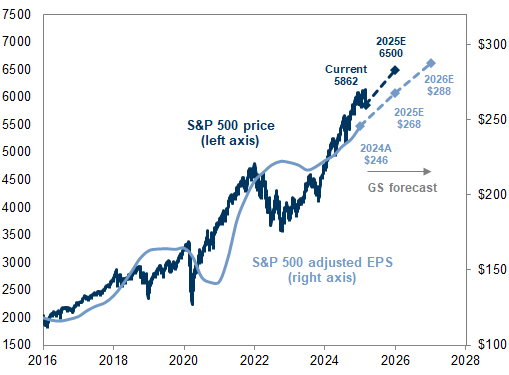
Exhibit 16: Goldman Sachs and consensus forecasts for S&P 500 earnings and returns
Biggest stock movers this week
Exhibit 17: S&P 500 stocks with the largest moves this week
Sentiment and flows
Exhibit 18: GS US Equity Sentiment Indicator of investor positioning
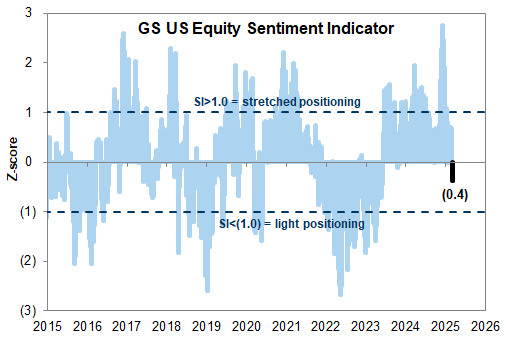
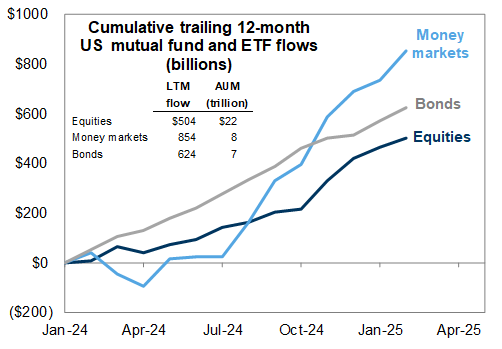
Exhibit 19: Recent mutual fund and ETF flows
Economic growth
Exhibit 20: US equity market internal pricing of economic growth
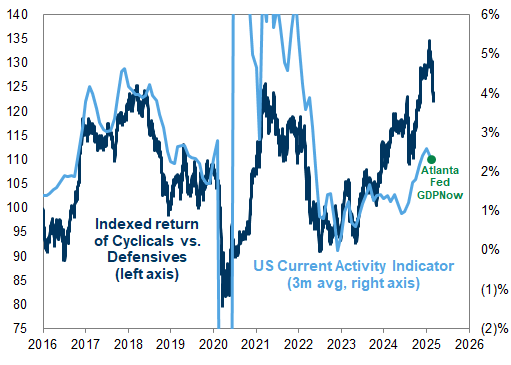
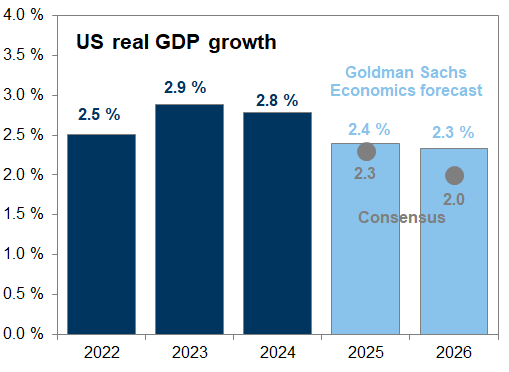
Exhibit 21: Goldman Sachs and consensus forecasts for US real GDP growth
Interest rates and financial conditions
Exhibit 22: Market pricing of near-term and long-term interest rate outlook
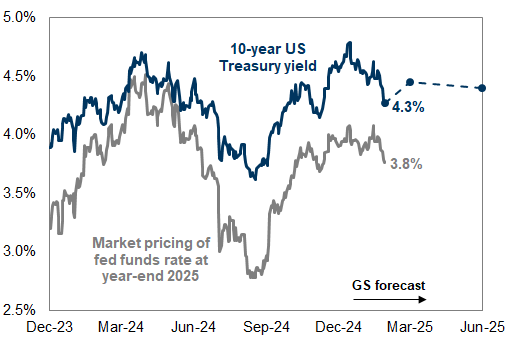
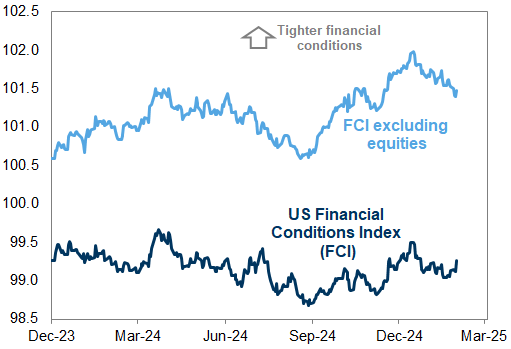
Exhibit 23: Goldman Sachs Financial Conditions Index
Market breadth and concentration
Exhibit 24: S&P 500 52-week market breadth
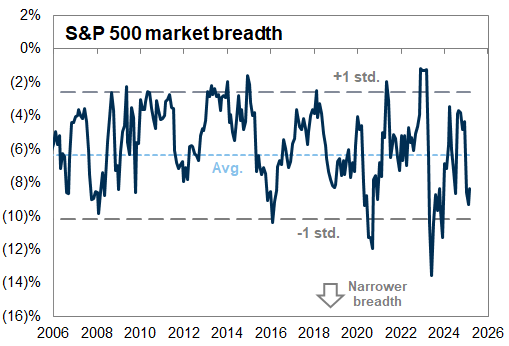
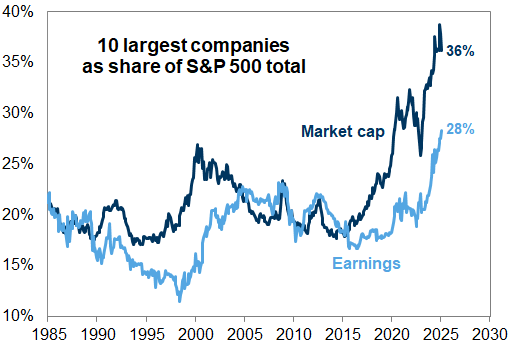
Exhibit 25: Concentration of S&P 500 market cap and earnings in the 10 largest index constituents
Correlation and volatility
Exhibit 26: S&P 500 realized average stock correlation
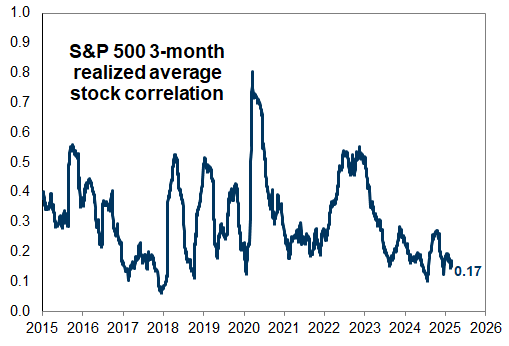
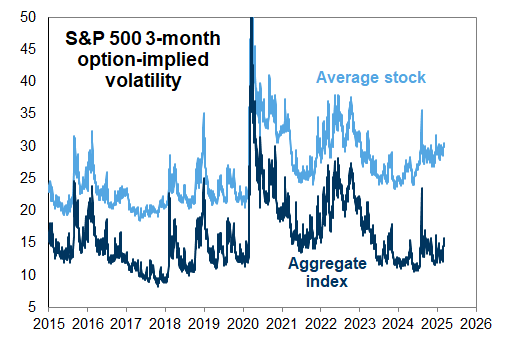
Exhibit 27: S&P 500 implied volatility
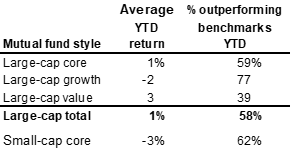
IPO Barometer and mutual fund performance
Exhibit 28: Goldman Sachs IPO Barometer
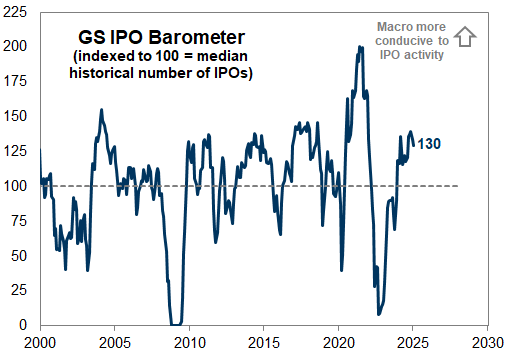
Exhibit 29: US equity mutual fund returns relative to benchmarks
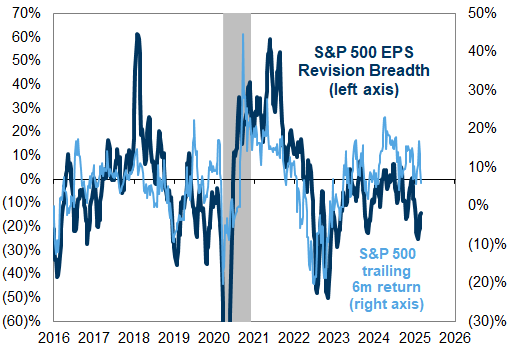
Earnings growth
Exhibit 30: Realized and consensus EPS growth for select US equity indices
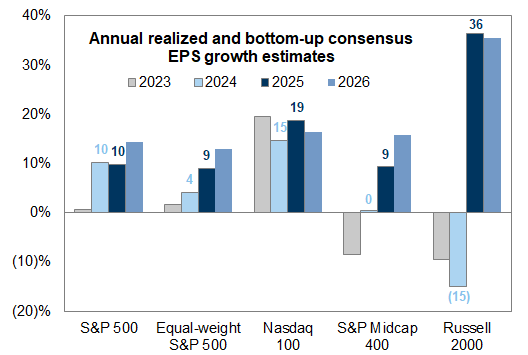
Exhibit 31: Realized and consensus year/year S&P 500 EPS growth
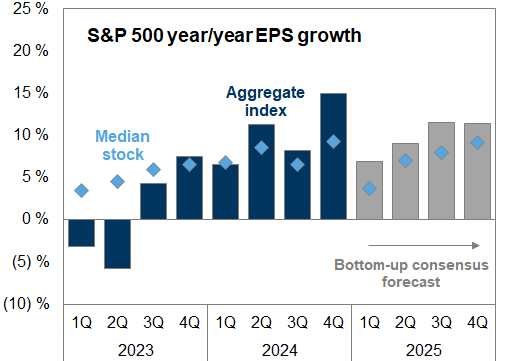
Exhibit 32: S&P 500 FY2 earnings revision breadth
Valuations
Exhibit 33: US equity index P/E valuations vs. history
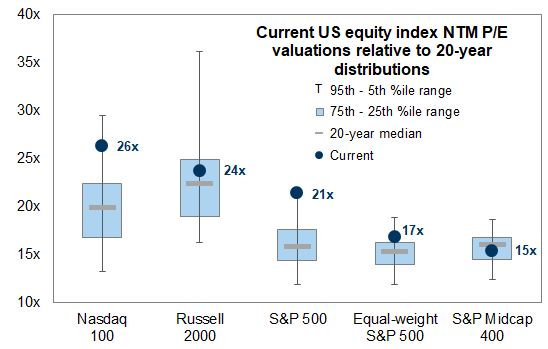
Exhibit 34: S&P 500 consensus forward 12-month P/E
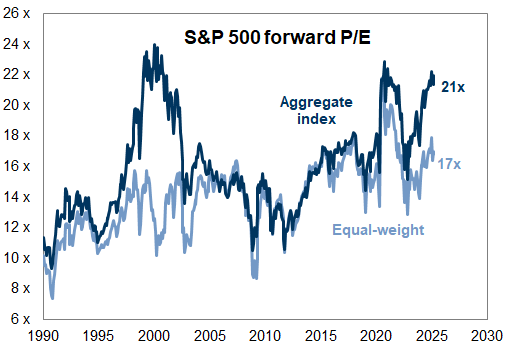
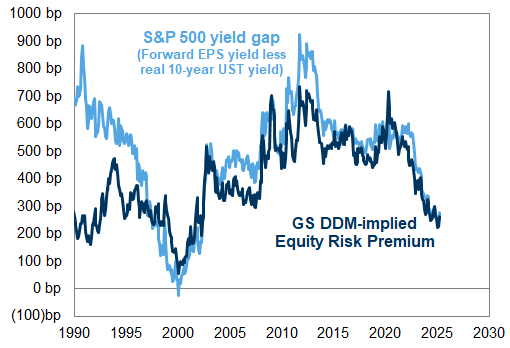
Exhibit 35: S&P 500 valuation relative to US Treasury yields
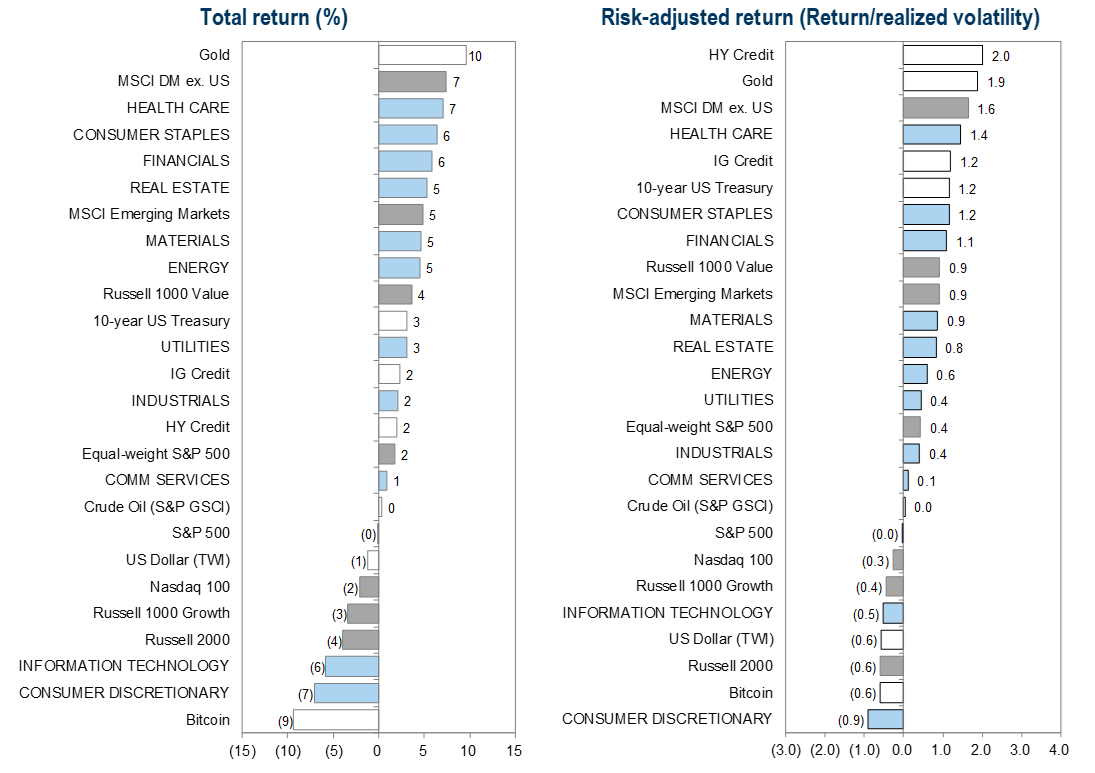
YTD absolute and risk-adjusted returns
Exhibit 36: YTD asset returns and return/volatility ratios
Sector returns, earnings, and valuations
Exhibit 37: Sector and industry group returns
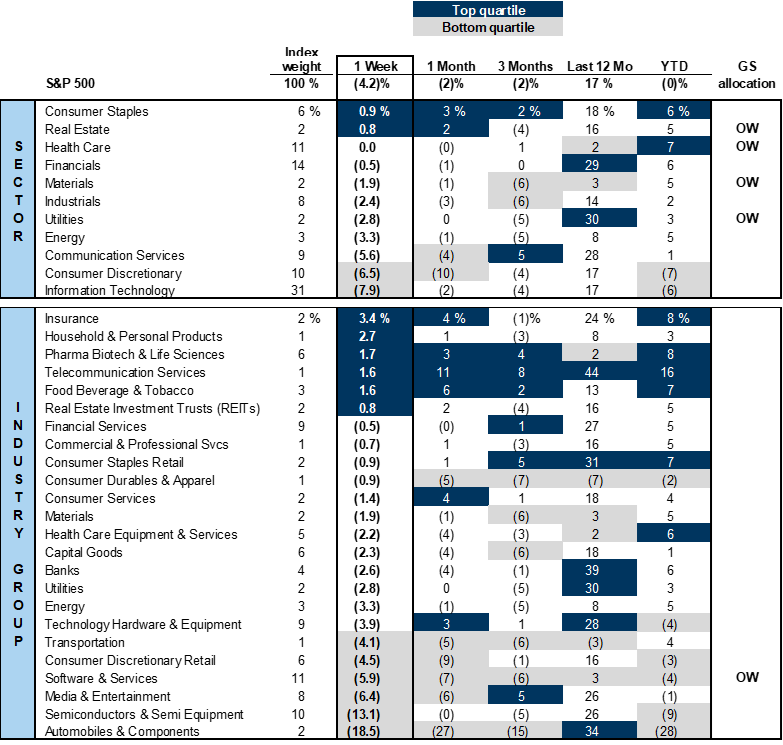
Exhibit 38: Earnings contributions and growth by S&P 500 sector
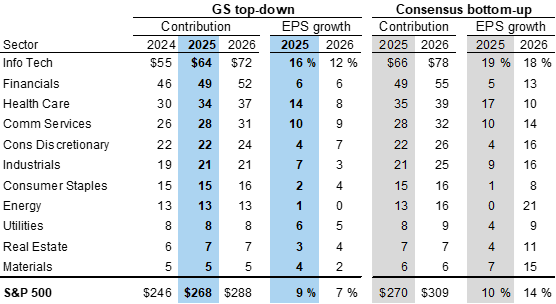
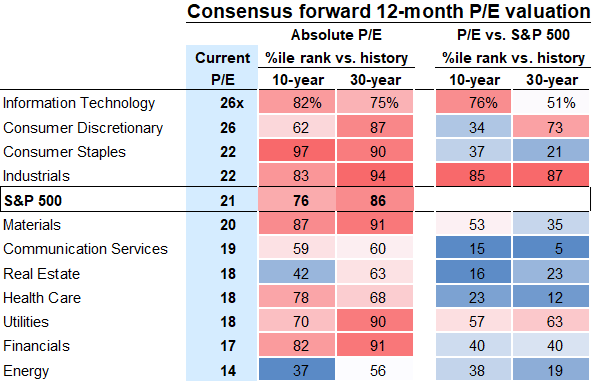
Exhibit 39: S&P 500 sector P/E valuations relative to history
Thematic baskets
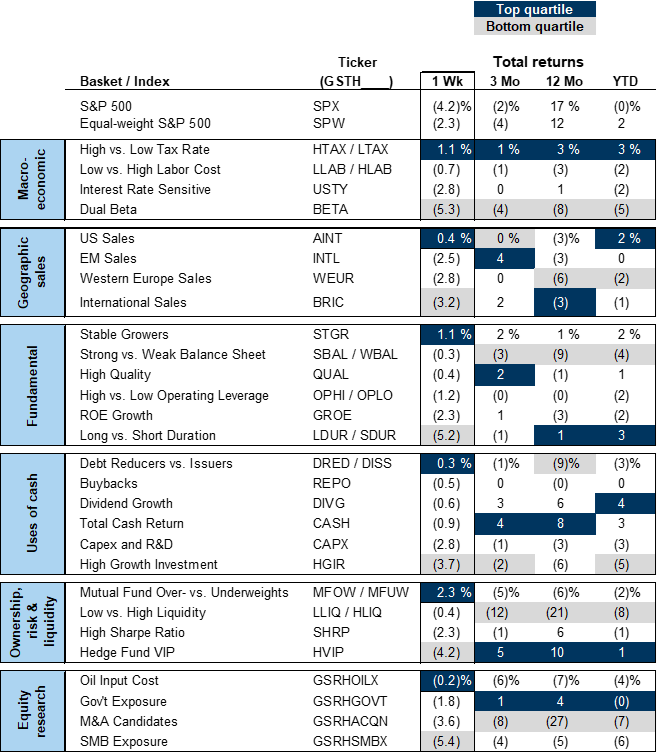
Exhibit 40: Recent performance of select Goldman Sachs Research baskets
Factors
Exhibit 41: Indexed return of select equity factors
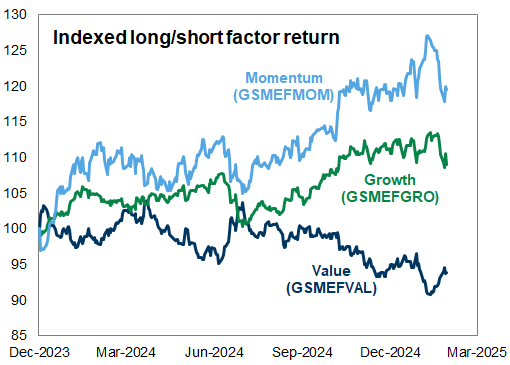
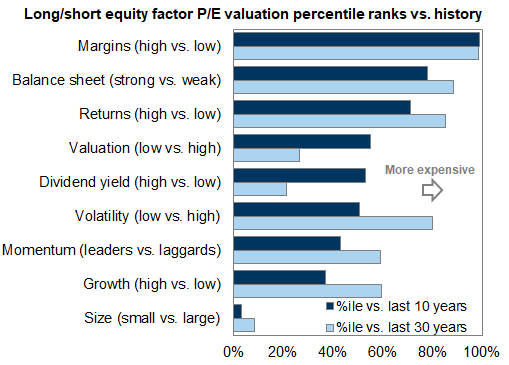
Exhibit 42: Equity factor valuations relative to history
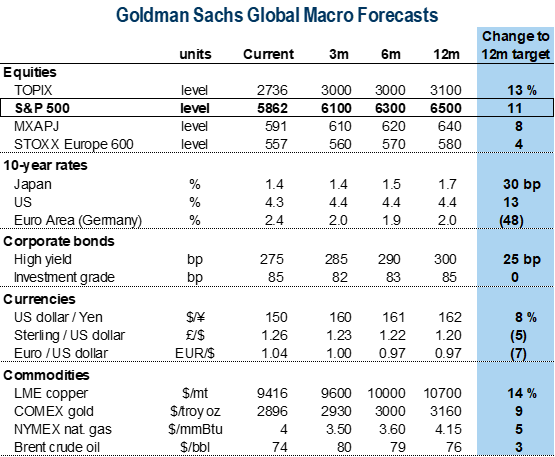
Goldman Sachs global macro research cross-asset forecasts
Exhibit 43: Goldman Sachs macro research asset forecasts
Investors should consider this report as only a single factor in making their investment decision. For Reg AC certification and other important disclosures, see the Disclosure Appendix, or go to www.gs.com/research/hedge.html.