Most equities have entered, or are on the cusp of, a bear market.
Not all bear markets are the same. The type of bear market has some bearing on the triggers, timing and speed of the recovery.
Our framework identifies 3 types: 'Structural' bear markets – triggered by structural imbalances and financial bubbles; 'Cyclical' bear markets – typically triggered by rising interest rates, impending recessions and falls in profits; 'Event-driven' bear markets – triggered by a one-off 'shock' that either does not lead to a domestic recession or temporarily knocks a cycle off course. Cyclical bear markets are the most common, with falls averaging 30%.
Bear market rallies are common, but a sustained trough typically requires a combination of cheap valuations, extreme negative positioning, policy intervention and a slowing of macro deterioration. Our Bull/Bear indicator (GSBLBR) remains elevated.
We would argue that we are in an event-driven bear market (triggered by tariffs). However, it could easily morph into a cyclical bear market given growing recession risk. The average falls of around 30% are similar for both event-driven and cyclical bear markets, while they differ in terms of duration with event-driven downturns being shorter with a faster recovery profile.
Over the medium term, secular inflection points in the 'Post Modern Cycle', including less globalisation, higher budget deficits, higher cost of capital and constraints on corporate profit margins, are likely to weigh on returns on investment, increasing the case for diversification.
Bear Market Anatomy - the path and shape of the bear market
Exhibit 1: Recent shifts in policy are reflected in macro surprises
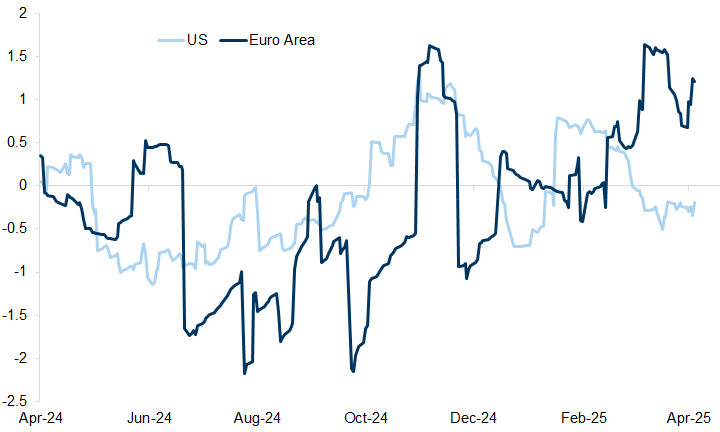
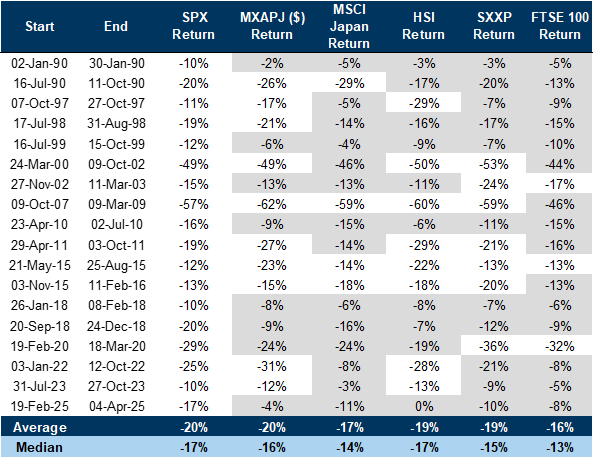
Exhibit 2: Broadly, all equity markets tend to fall when the US experiences a correction above 10%
How far and how deep?
Structural bear markets – triggered by structural imbalances and financial bubbles. Very often there is a 'price' shock such as deflation and a banking crisis that follows.
Cyclical bear markets – typically triggered by rising interest rates, impending recessions and falls in profits. They are a function of the economic cycle.
Event-driven bear markets – triggered by a one-off 'shock' that either does not lead to a domestic recession or temporarily knocks a cycle off course. Common triggers are wars, an oil price shock, an EM crisis or technical market dislocations. The principal driver of an event-driven bear market is higher risk premia rather than a rise in interest rates at the outset.
Exhibit 3: US Bear markets & Recoveries since the 1800s
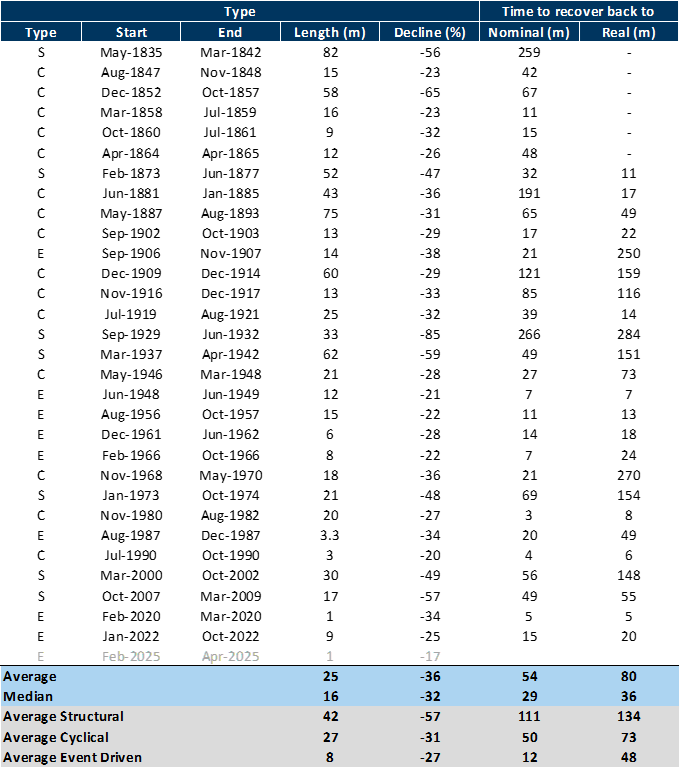
Exhibit 4: US bear markets and recoveries since the 1800s
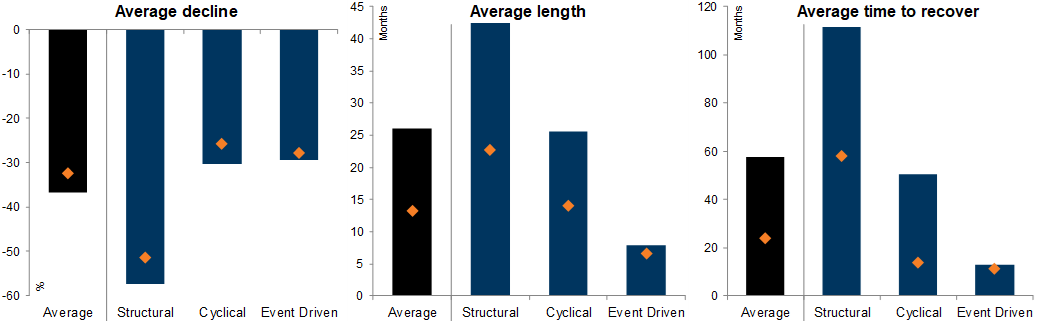
Exhibit 5: GS Bull/Bear Market Indicator (GSBLBR)
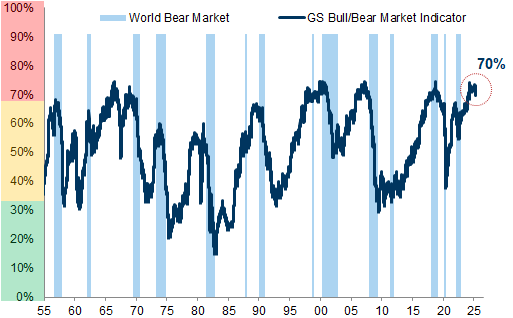
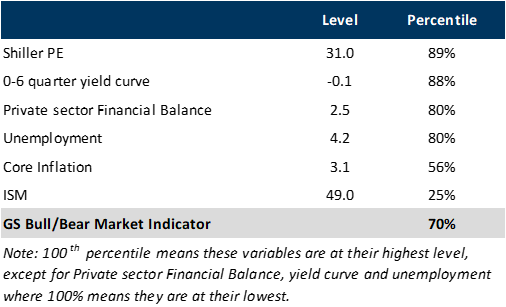
Exhibit 6: Details of components of the GS Bull/Bear Market Indicator
The Bear Market Bounce
Exhibit 7: Historical examples of bear market rallies
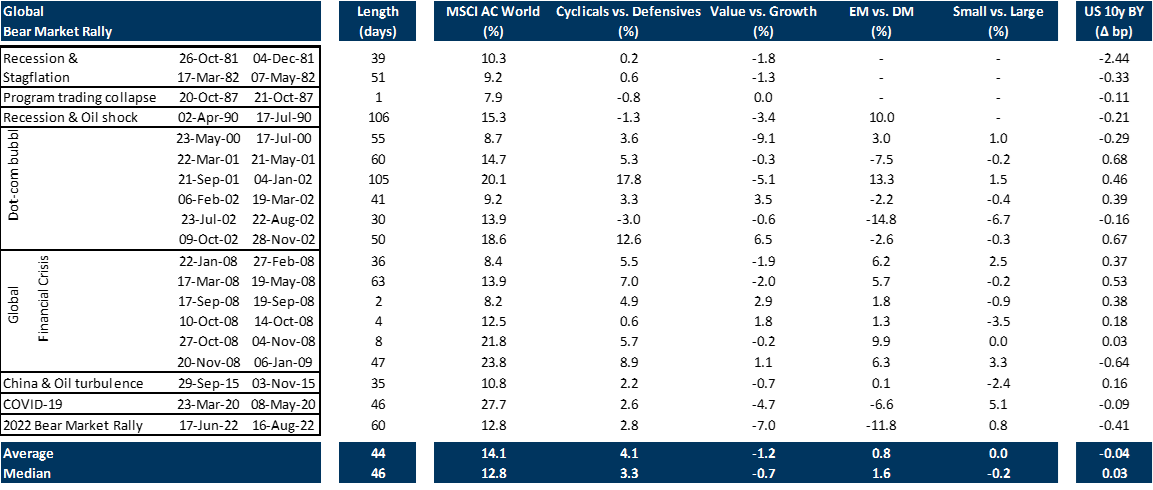
Exhibit 8: Duration of bear market rallies
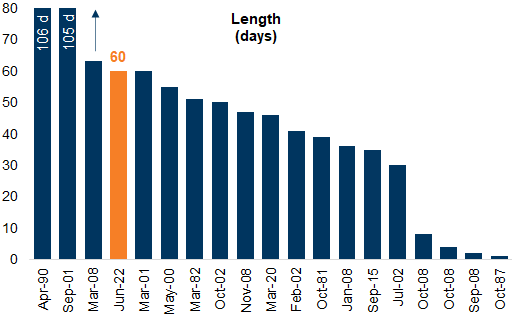
Exhibit 9: Performance of bear market rallies
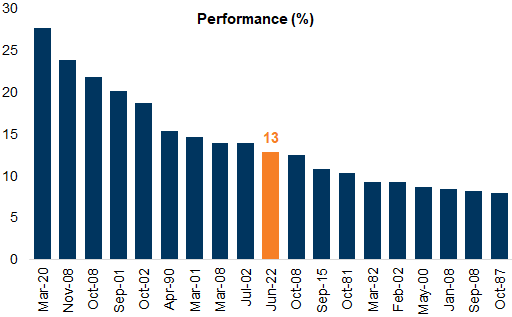
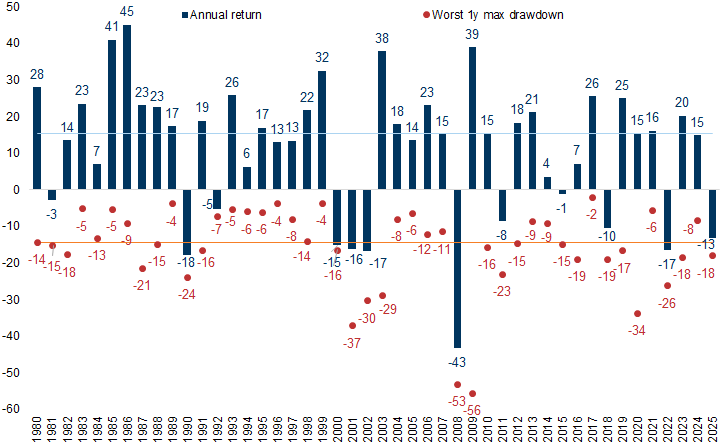
Exhibit 10: Despite median intra-year drops of 15%, the annual returns were positive in 34 of the last 45 years
Conditions for a recovery
Attractive valuations
Extreme positioning
Policy support
A sense that the second derivative of growth is improving
Valuations remain expensive
Exhibit 11: The US equity market has seen its market capitalisation outpace its economy, reaching a record-high valuation relative to GDP
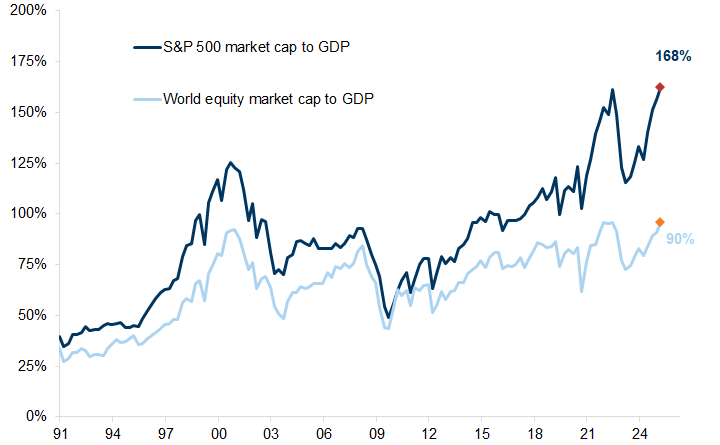
Exhibit 12: Valuations are neither expensive (as in the US) nor cheap
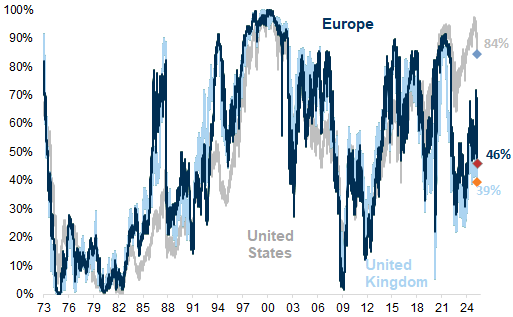
Exhibit 13: Non-US markets, while cheap relative to the US, are not particularly inexpensive relative to their own history
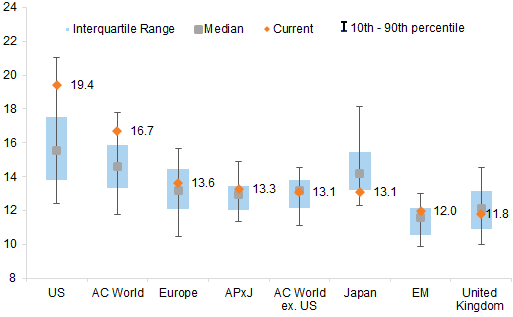
Exhibit 14: Higher bond yields have pushed down Equity Risk Premia
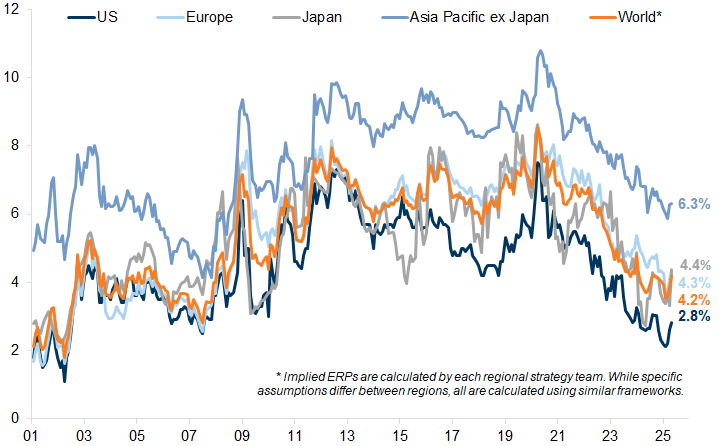
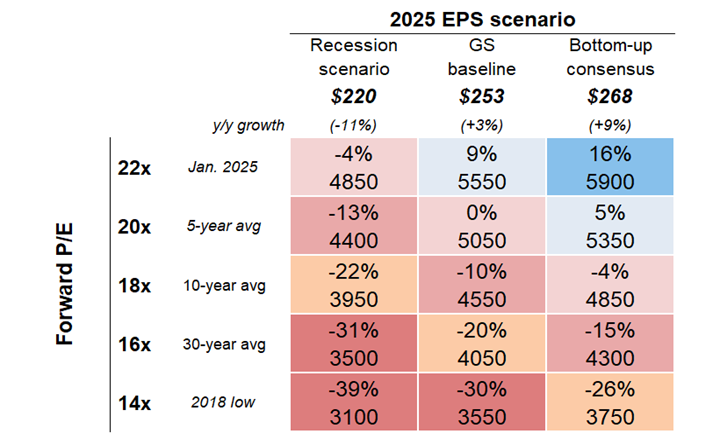
Exhibit 15: Central forecasts around valuation estimates are highly sensitive
Interest rates
Cyclical bear markets around 'soft landings' are likely to end around a move lower in interest rates.
Cyclical bear markets associated with 'hard landings' are not likely to be resolved by interest rates alone. Interest rate cuts are an important part of the recovery puzzle, but a slowing in the second derivative of growth, together with depressed valuations, also tends to be important.
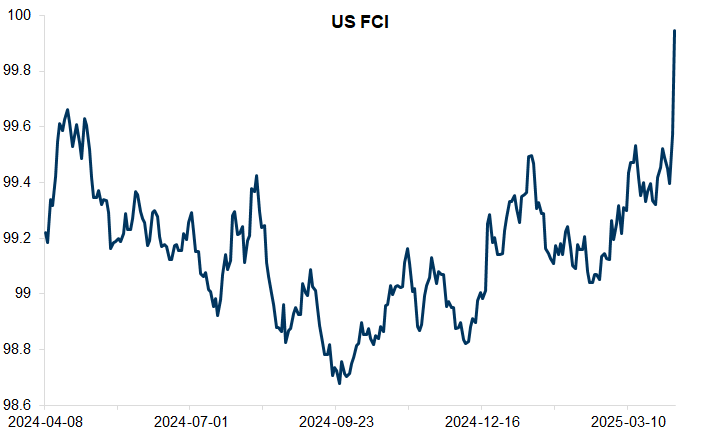
Exhibit 16: Financial conditions appear to be a greater headwind to growth this year
Growth momentum
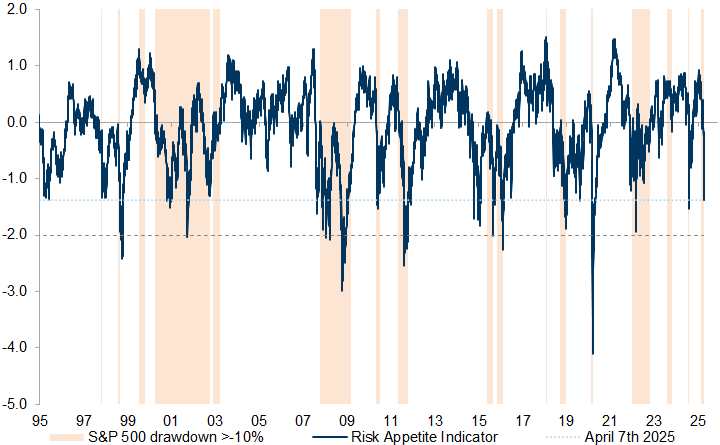
Positioning
Exhibit 17: While already at c.-1.4, the RAI troughed closer to (or below) -2.0 during previous S&P 500 drawdowns
Structural changes and the post-modern cycle
Long-term fall in interest rates and the cost of capital
Long-term rise in margins and profit shares of GDP
Secular rise in world trade growth
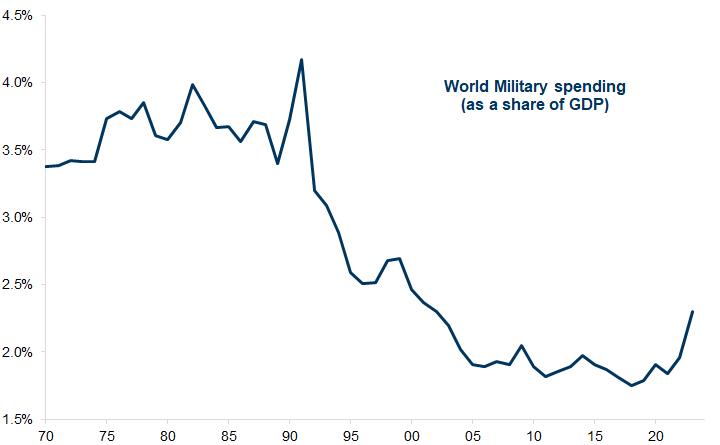
Structural decline in government spending on defense
Long-term interest rates
Exhibit 18: Nominal interest rates have risen from record-low levels
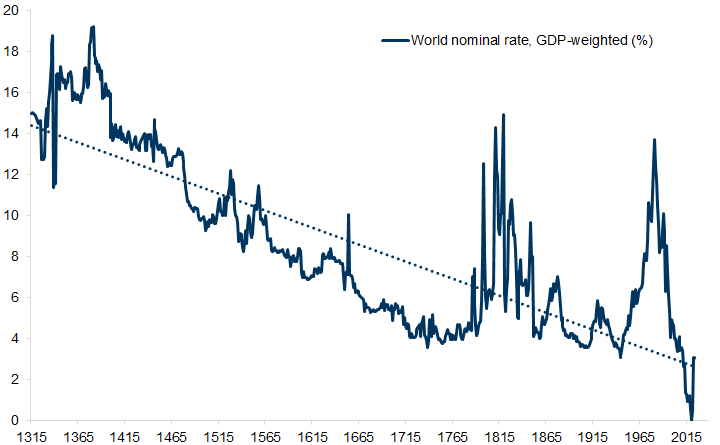
Exhibit 19: Government debt as a percentage of GDP
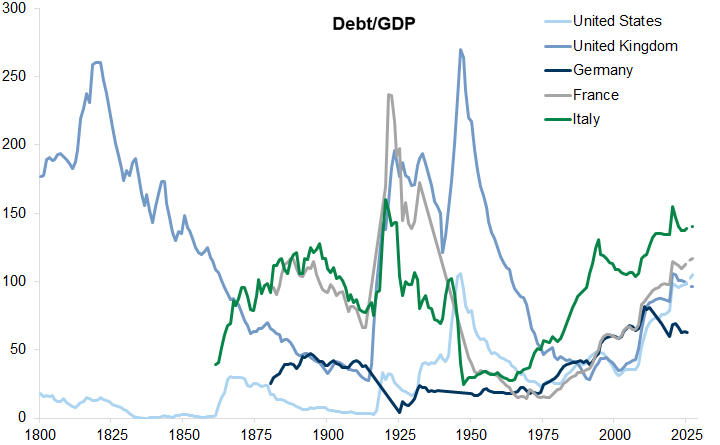
Exhibit 20: Demand to borrow more for defense spending is increasing
World trade growth
Exhibit 21: World trade growth has increased dramatically in the period of globalisation
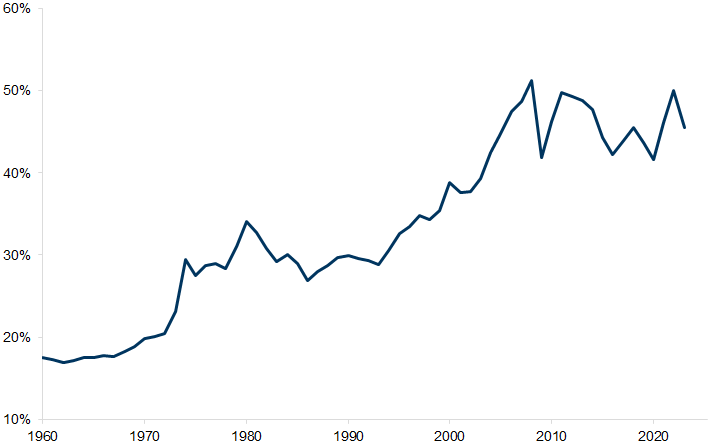
Margins and profit shares of GDP
Exhibit 22: The expansion of effective global labour supply resulted in a downward trend in labour shares of GDP, while profit shares moved to record-high levels
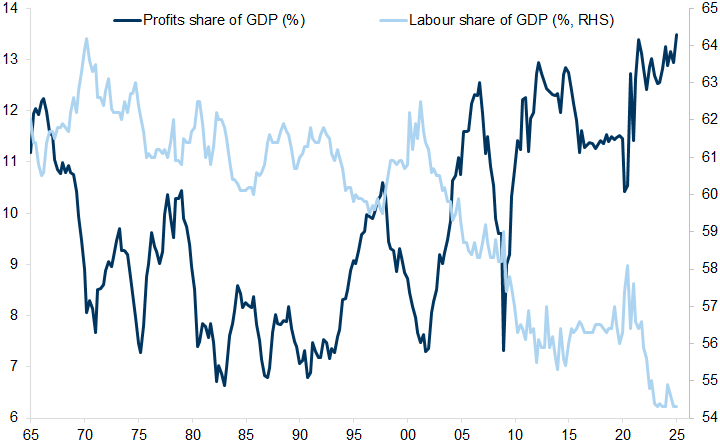
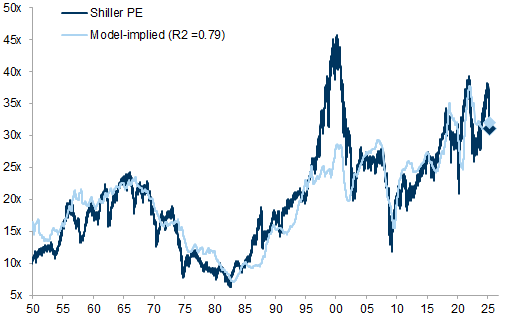
Exhibit 23: A simple model combining inflation and ROE has explained a large part of the variation in US equity valuations since WW2
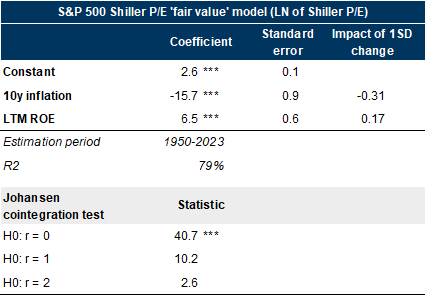
Exhibit 24: Trends in inflation and corporate profitability have had the largest impact on S&P 500 valuations
Investors should consider this report as only a single factor in making their investment decision. For Reg AC certification and other important disclosures, see the Disclosure Appendix, or go to www.gs.com/research/hedge.html.