Goldman Sachs Research
European Daily: UK—Why is Inflation Still So High? A Cross-Country Perspective (Stehn)
15 May 2025 | 5:48PM BST | Research | Economics| By Sven Jari Stehn and others
More
  • UK core inflation continues to run notably ahead of that in other countries, reflecting high services inflation and firm wage growth. Compared with other OECD countries, the UK saw a much bigger increase in food and energy prices after Covid, with more labour market overheating (measured by the peak vacancy/unemployment ratio).

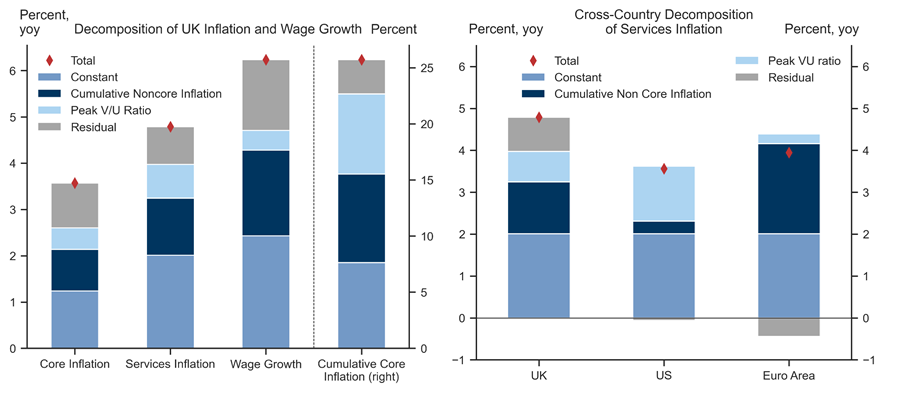
  • Simple cross-country regressions suggest that pass-through from the sharp post-Covid rise in noncore prices and labour market overheating play an important role in explaining why UK core inflation, services inflation and wage growth pressures remain elevated compared with other advanced economies.

  • Given the recent drop in noncore prices and the vacancy/unemployment (V/U) ratio—which has been more pronounced in the UK than elsewhere—our analysis suggests that UK inflationary pressures should cool notably in coming quarters. We therefore ultimately expect UK inflation to look similar to that in other advanced economies, allowing the BoE to lower rates more than priced.

Why is Inflation Still So High? A Cross-Country Perspective

UK inflation remains surprisingly high. While headline inflation has fallen meaningfully, core inflation at 3.4% continues to run notably ahead of that in other advanced economies (Exhibit 1, left). Elevated core inflation is driven by high services inflation, with goods inflation running below levels in other countries (Exhibit 1, right).

Exhibit 1: UK Inflation Remains Notably Higher than Elsewhere, Reflecting High Services Inflation

1. UK Inflation Remains Notably Higher than Elsewhere, Reflecting High Services Inflation. Data available on request.
In the RHS panel for harmonised Core the OECD Median is a median of some advanced economies for which we have created harmonised inflation measures. See 'Harmonizing Disinflation', Pierdomenico and Briggs, Global Economics Analyst, 2024 for more information.
Source: Goldman Sachs Global Investment Research, Haver Analytics
The strength in services inflation coincides with high wage growth, which at around 6% stands sharply above wage growth in other G7 economies, at 4% (Exhibit 2, left). The cross-country pattern shows that high wage growth coincides with high services inflation (Exhibit 2, right). That is, the level of services inflation is not a surprise considering the rate of wage growth.

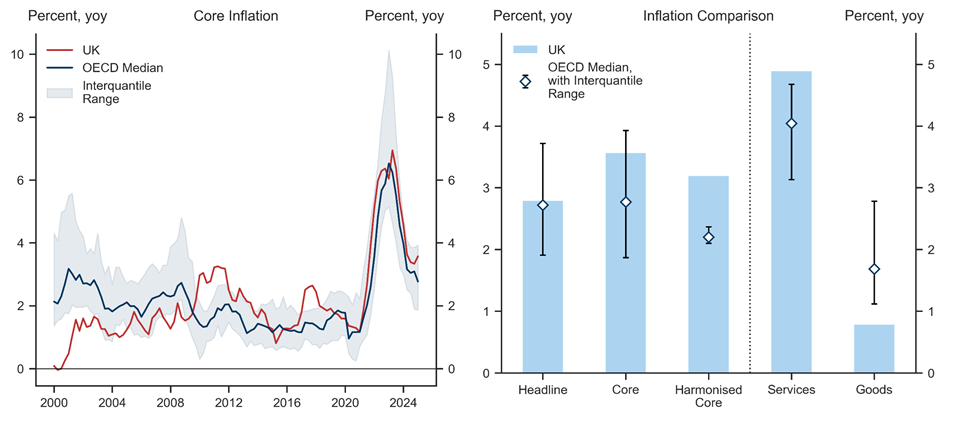
Exhibit 2: Sticky Services Inflation Coincides with Strong Wage Growth

2. Sticky Services Inflation Coincides with Strong Wage Growth. Data available on request.
Source: Goldman Sachs Global Investment Research, Haver Analytics
What explains the UK’s high levels of wage growth and services inflation? First, the cross-country perspective shows that the UK saw a much bigger increase in food and energy prices after Covid than other countries (Exhibit 3, left). In particular, noncore inflation—headline less core—peaked at 4.4pp in the UK, compared with a median of 3.4pp in other OECD countries. Moreover, the UK labour market was significantly more overheated than elsewhere, measured by the vacancy/unemployment (or V/U) ratio (Exhibit 3, right).[1] That said, both noncore inflation and the V/U ratio have now fallen notably below the levels seen in other OECD economies.

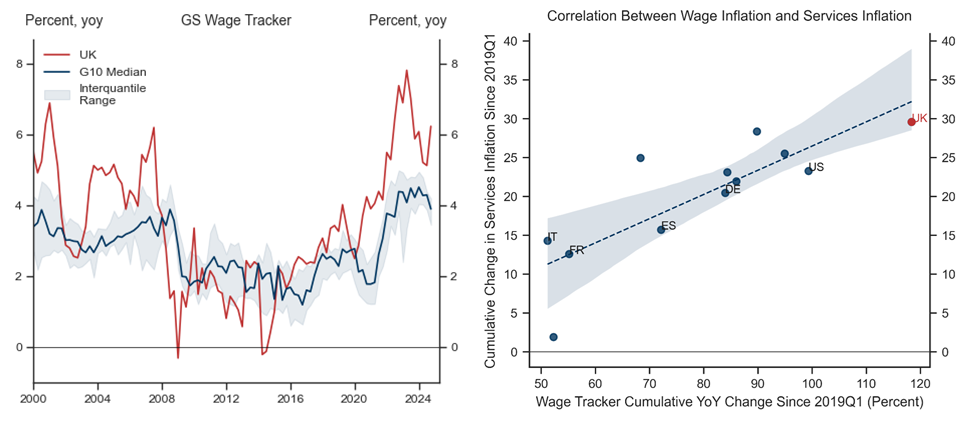
Exhibit 3: The UK Saw Higher Food and Energy Inflation, As Well as More Labour Market Overheating

3. The UK Saw Higher Food and Energy Inflation, As Well as More Labour Market Overheating. Data available on request.
Source: Goldman Sachs Global Investment Research, Haver Analytics
To explain the potential drivers behind the UK’s high inflation rates, we plot the latest value of core inflation against noncore prices and the post-pandemic peak V/U ratio (Exhibit 4). Consistent with former MPC member Gertjan Vlieghe’s analysis, we find that the cumulative amount of noncore inflation after Covid correlates strongly with observed core inflation, pointing to an important role for pass-through from food and energy prices into core inflation. We focus here on the latest rate of core inflation, but the results are even stronger for cumulative core inflation since Covid. The results work for both energy and food prices, so we focus on noncore inflation for simplicity.
Moreover, we see that countries with more labour market overheating after Covid (measured by the peak in the detrended V/U ratio) have higher core inflation rates today. The cross-country pattern is much weaker for labour market overheating than for noncore inflation, but still visible.

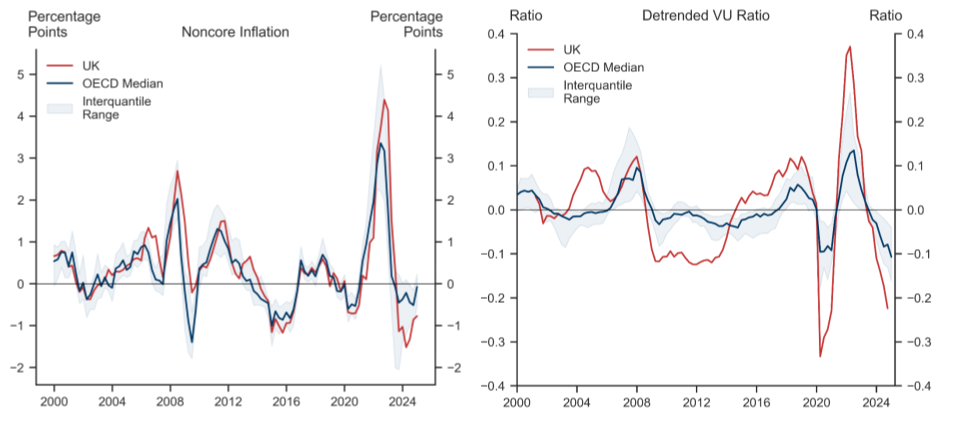
Exhibit 4: Sticky Core Inflation Correlates with Non-Core Inflation and Labour Market Overheating

4. Sticky Core Inflation Correlates with Non-Core Inflation and Labour Market Overheating. Data available on request.
Source: Goldman Sachs Global Investment Research, Haver Analytics
We then run simple cross-country regressions to explore these relationships in more detail (Exhibit 5). In particular, we regress current year-over-year core inflation on cumulative noncore inflation and the peak post-pandemic V/U ratio. We then run the same regressions for current services inflation and wage growth, and also cumulative core inflation since Covid.
Our regressions confirm a strong relationship between post-Covid noncore inflation and—to a lesser extent—labour market overheating. The results are quite similar for core, services and wage growth. Our findings are robust to using energy and food prices individually.

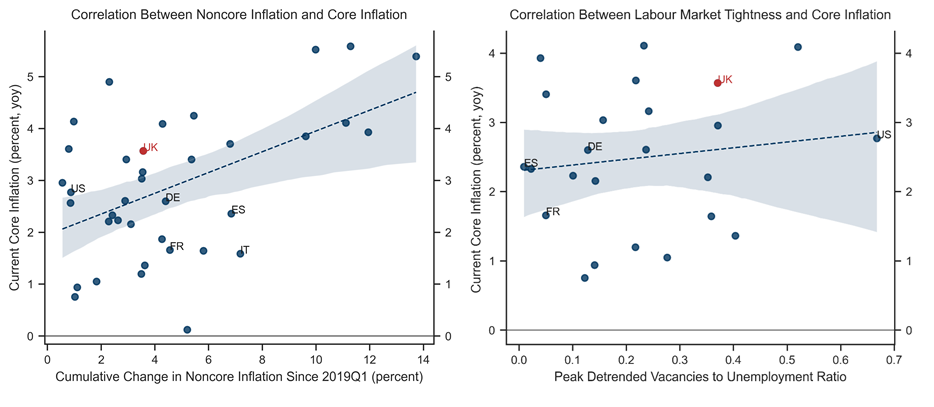
Exhibit 5: Noncore Prices and Labour Market Overheating Play Key Role

5. Noncore Prices and Labour Market Overheating Play Key Role. Data available on request.
Source: Goldman Sachs Global Investment Research, Haver Analytics
We use our estimated equations to decompose core inflation, services inflation and wage growth (Exhibit 6). We see that the UK’s high inflation rate in large part reflects pass-through from higher noncore inflation after Covid and a tighter labour market. Labour market overheating was a more important factor in the US, while noncore pass-through was more important in the Euro area. We also see that our model fits the UK somewhat less well than elsewhere, with some of the high UK inflation rate remaining a puzzle.

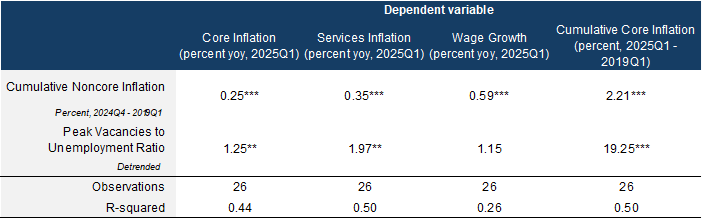
Exhibit 6: Explaining High UK Inflation Using Our Cross-Country Regressions

6. Explaining High UK Inflation Using Our Cross-Country Regressions. Data available on request.
Source: Goldman Sachs Global Investment Research, Haver Analytics

Not That Different After All?

Taken together, the cross-country perspective suggests that high UK inflation is closely related to post-Covid pass-through effects from high food/energy prices and an overheated labour market. Our cross-country analysis is simple and therefore cannot detect whether structural changes in the economy might have made inflation more persistent than suggested by our estimates. But our findings are consistent with our prior work—including with time series techniques—which likewise points to a key role for noncore pass-through effects.
Our findings imply that UK inflationary pressures should continue to cool in coming quarters given the drop in food/energy prices and the V/U ratio in the UK, consistent with a return of inflation to target in 2026. We therefore ultimately expect UK inflation to look similar to that in other advanced economies, allowing the BoE to lower rates more than priced.
Francesco Coppola*
Sven Jari Stehn
* Francesco is an intern in the European economics team.
  1. 1 ^ We de-trend the V/U ratio to allow for structural changes.

Investors should consider this report as only a single factor in making their investment decision. For Reg AC certification and other important disclosures, see the Disclosure Appendix, or go to www.gs.com/research/hedge.html.