Goldman Sachs Research
Global Economics Analyst
The Path to 2075 — The Positive Story of Global Aging (Daly/Njie/Allen)
20 May 2025 | 7:52AM EDT | Research | Economics| By Jan Hatzius and others
More
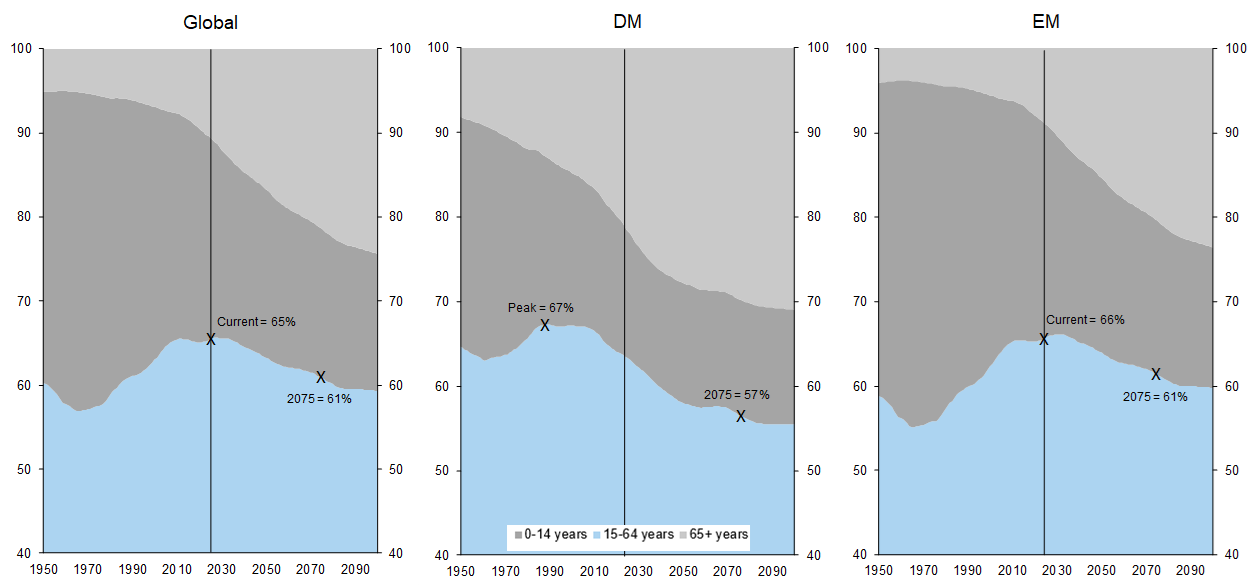
  • The global population is aging, driven by a combination of increased longevity and declining fertility. This phenomenon is most pronounced in developed (DM) economies, where the ‘working-age ratio’ (ages 15-64) has already decreased from 67% in 2000 to 63%, and is projected to fall to 57% by 2075. In emerging economies, the 15-64 share is close to a peak (66%) and is expected to decline to 61% over the next 50 years. This process of aging is often depicted as a ‘demographic time bomb,’ implying rising dependency ratios (i.e., a fall in total employment rates) and declining GDP per capita.

  • While it is right to focus on the economic implications of a transition of this importance, economists should not lose sight of the fact that increasing life expectancy is a fundamentally positive development. In addition to living longer, people are also living healthier lives, in the sense that the functional capacity of older individuals is improving over time. According to a recent comprehensive study, a person who was 70 in 2022 had the same cognitive ability as a 53-year-old in 2000. In a very tangible sense, 70 is the new 53.

  • It is also far from clear that the economic drawbacks of population aging are as intractable as they are commonly depicted. Although rising public sector pension costs remain a concern for some economies, the most effective means of counteracting the impact of aging on dependency ratios is to extend working lives. Fortunately, this trend is already in motion: while median expected life expectancy in developed economies has increased by 5% since 2000 (from 78 to 82 years), the median effective working life has risen by 12% (from 34 to 38 years) and the share of the total population in employment has increased from 46.0% to 48.3%. In other words, despite the large decline in DM working-age ratios that has already taken place, DM dependency ratios have actually fallen. This trend towards extending working lives shows little sign of abating and is taking place in countries with minimal changes to pension laws, suggesting an adaptive response to increased longevity.

  • In a world with a growing number of seemingly intractable problems – from climate change to economic populism – population aging is one less thing to worry about. Living longer really is a good thing.

The Path to 2075 — The Positive Story of Global Aging

The World’s Aging Population

The world is getting older. This process is more advanced in developed (DM) economies, but it is also taking place in emerging (EM) economies.[1] Over the past 50 years (since 1975), the median age in DM economies has increased from 30 to 43 years and in EM economies from 19 to 30. Over the next 50 years (to 2075), the UN projects[2] that the median age will reach 47 in DMs and 40 in EMs (Exhibit 1). Assessing how aging will affect the long-term economic outlook is a key judgment in our Path to 2075 projections for the global economy (see Box 1).

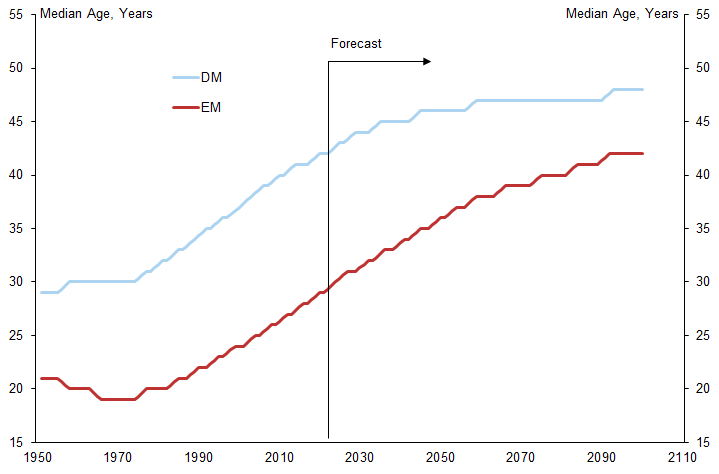
Exhibit 1: In the Past 50 Years, the Median Age Has Risen from 30 to 43 Years in DM Economies and from 19 to 30 in EM Economies

Median Age, Years
1. In the Past 50 Years, the Median Age Has Risen from 30 to 43 Years in DM Economies and from 19 to 30 in EM Economies. Data available on request.
Source: United Nations, Goldman Sachs Global Investment Research
Global population aging is a consequence of two demographic developments:

1. Increased Longevity

People are living longer, healthier lives. Over the past 50 years, average global life expectancy has risen from 62 to 75 years, with developed economies seeing an increase from 72 to 82 years and emerging economies from 58 to 73 years. This trend is not universal – US life expectancy has declined slightly in the past decade – but, at a global level, it shows no signs of slowing. Exhibit 2 illustrates the progression of life expectancy in the longevity ‘frontier’ – i.e., the country with the longest life expectancy at different points in time. In 1925, Australia had the highest life expectancy at 63 years; in 1975, Iceland led with 75 years; and today, Hong Kong holds the record at 86 years.[3]
Life expectancy in the longevity ‘frontier’ has followed a broadly linear trend – rising by around 0.25 years per year – for more than 150 years. This trend has continually surpassed predictions of a potential ‘ceiling’ to the human lifespan. Average global life expectancy has been rising a little faster than this – at a rate of 0.32 years per year since 1950 – as a result of convergence over time to the frontier.

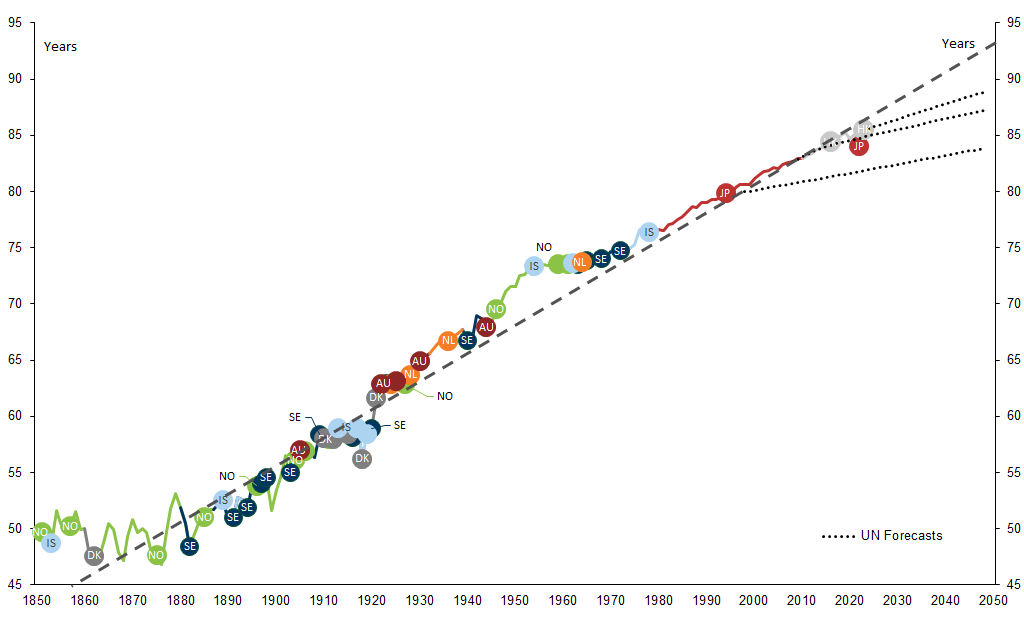
Exhibit 2: Living Longer – Life Expectancy Continues to Chart a Linear Path Higher

Leading country life expectancy (male and female), based on 'period life expectancy' method
2. Living Longer – Life Expectancy Continues to Chart a Linear Path Higher. Data available on request.
Source: Our World in Data, United Nations, Goldman Sachs Global Investment Research
These life expectancy data almost certainly understate the actual increase in longevity. This is because the life expectancy data that are most commonly cited aren’t really life expectancy data at all – they are a measure of the average ages that people are dying at today. This only provides an accurate picture of life expectancy if we assume there will be no improvements in longevity in the future, which has consistently proved to be an excessively pessimistic assumption.[4]
Thus, when we state that the average life expectancy in developed economies is currently 82 years, we are essentially saying that an average individual born 82 years ago in 1943 would live to be 82. However, in 1943, the official life expectancy for developed economies was 21 years lower than it is today, at only 61 years. Only time will tell how long an average person born in a DM country today will live. But, in a likely best-case scenario, where we extrapolate the linear trend that has been underway in the frontier for the past 150 years, the average person born today would live to 110 years rather than 82 years.[5]
70 is the new 53: In addition to living longer, people are also living healthier lives, in the sense that the functional capacity of older individuals is improving over time. A recent IMF study, using micro-data of individuals aged 50+ (including physical and cognitive tests) from a sample of 41 developed and emerging economies, found that “on average, a person who was 70 in 2022 had the same cognitive ability as a 53-year-old in 2000”, while the physical frailty of a 70-year-old corresponded to that of a 56-year-old in 2000.[6] Measured in years, these improvements are larger than the reported increases in life expectancy, emphasizing the need to focus on biological rather than chronological age.
The fact that we are not only living longer but also slowing the process of aging throughout our lives raises an important economic point. Most studies of the economic consequences of aging implicitly or explicitly assume that increases in life expectancy will extend the amount of our lives that we spend in ‘old age’, keeping everything else fixed. One implication that follows from this assumption is that there will be a higher demand for goods and services tailored to ‘old people’. However, a more accurate description is that we are extending the duration of all stages of life – ‘young’, ‘middle-aged’, and ‘old’ – which makes it less certain that demand will shift towards products and services for ‘old’ people.[7]

2. Declining Fertility

The second key demographic development driving population aging is declining fertility. The global fertility rate – the estimated number of births a woman will have in her lifetime based on current birth rates – peaked at 5.4 in 1963, dropped to 4.1 in 1975, and currently stands at 2.1 (Exhibit 3). Global fertility has fallen faster than the UN projected over the last 5-10 years, prompting a revision of projected fertility rates. Whether this decline will be partly reversed or whether the COVID-19 pandemic has caused a permanent adjustment in fertility remains to be seen.

Exhibit 3: The Global Fertility Rate Has Fallen from a Peak of 5.4 in 1963 to 2.1 in 2024

Fertility rate (estimated lifetime births per woman)
3. The Global Fertility Rate Has Fallen from a Peak of 5.4 in 1963 to 2.1 in 2024. Data available on request.
*This assumes that life expectancy rises in line with the 'frontier' trend (0.25 years per year).
Source: United Nations, Goldman Sachs Global Investment Research
Contrary to the common perception, the largest declines in fertility are taking place in relatively poor countries where birth rates are highest. Since 1975, the EM fertility rate has declined from 4.6 to 2.2, and in DM economies it has declined from 1.9 to 1.5 (Exhibit 4).

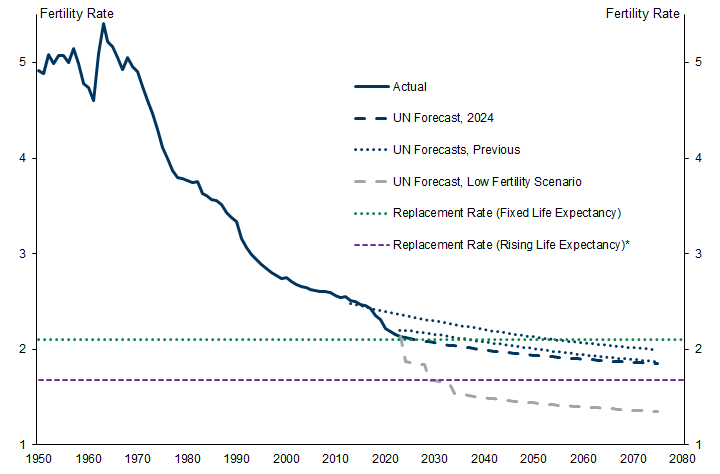
Exhibit 4: The Decline in Fertility Rates Has Been Greatest in EM Economies, While DM Fertility Has Been Below the 'Replacement Rate' (Assuming Fixed Life Expectancy) for More than 50 Years

Fertility rate (estimated lifetime births per woman)
4. The Decline in Fertility Rates Has Been Greatest in EM Economies, While DM Fertility Has Been Below the 'Replacement Rate' (Assuming Fixed Life Expectancy) for More than 50 Years. Data available on request.
*This assumes that life expectancy rises in line with the 'frontier' trend (0.25 years per year).
Source: United Nations, Goldman Sachs Global Investment Research
The current global fertility rate of 2.1 aligns with the commonly quoted replacement fertility rate required for long-term population stability.[8] However, in common with the standard life expectancy data, this calculation assumes that mortality rates are fixed at current levels. If, instead, life expectancy increases over time, the fertility rate needed to balance the number of births with the number of deaths is significantly lower. If longevity rises at a pace of 0.25 years per year – i.e., in line with the 'frontier' trend but lower than the long-term rise in global life expectancy (0.32 years per year) – the replacement fertility rate drops to around 1.6-1.7.[9] This helps to explain why DM population growth has remained significantly positive in aggregate, despite total fertility running below the 2.1 threshold for more than 50 years.[10]
Nevertheless, as a result of the downward revisions to projected fertility – and despite the offsetting positive surprises to projected life expectancy – the UN has started to lower its projections for the peak global population. In 2017, the UN expected the global population to increase from 8.2 billion currently to more than 11 billion by the end of this century and for it still to be on an upward trajectory. However, in its latest projections, the UN now expects the global population to peak at approximately 10.3 billion in around 50 years’ time (Exhibit 5).
This point is worth emphasizing. Despite the fall in fertility, the global population is still projected to rise significantly from current levels and it will continue to rise for the next 50 years. Even in the UN’s low fertility scenario – which assumes that fertility rates continue to fall from current levels – the global population is expected to grow for another 25 years, peaking at around 9 billion.[11]

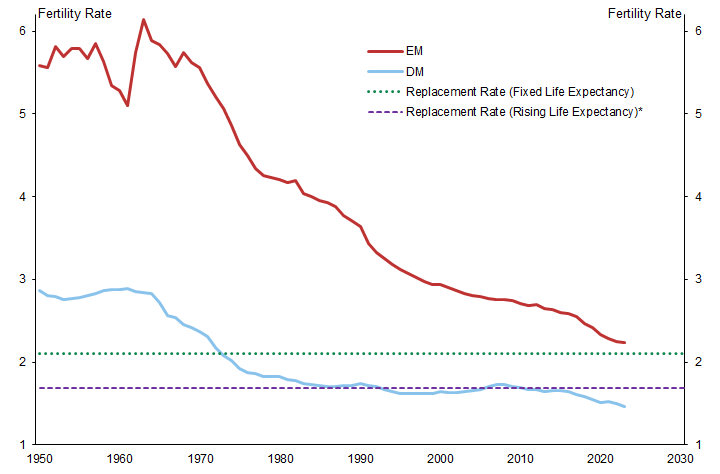
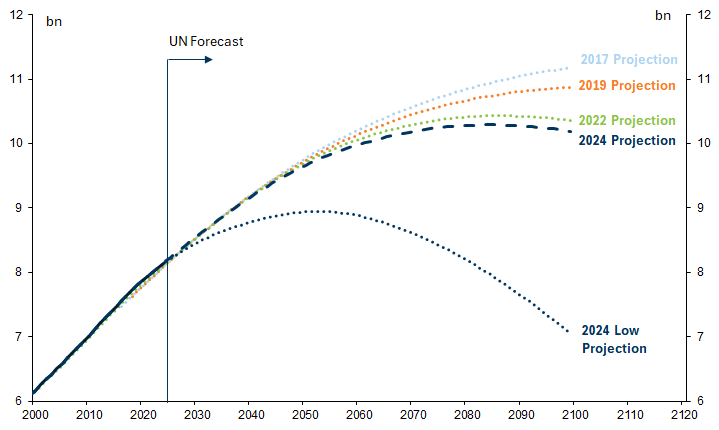
Exhibit 5: The Projected Peak in Global Population Has Declined Due to Lower Fertility But, Even Under a Low Fertility Assumption, the World's Population Will Rise from Around 8bn to 9bn in 2050

UN global population projections, various vintages
5. The Projected Peak in Global Population Has Declined Due to Lower Fertility But, Even Under a Low Fertility Assumption, the World's Population Will Rise from Around 8bn to 9bn in 2050. Data available on request.
Source: United Nations, Goldman Sachs Global Investment Research
The decline in global fertility and the resulting slowdown in global population growth is having a variety of different effects. Whether this is viewed positively or negatively depends on how these effects are weighed. Until recently, the more common concern related to the unsustainability of global population growth and the risks that this posed to resource utilization and climate change.[12] Now that we are seeing the declines in fertility that will help to stabilize the global population, an increasing number of analysts worry about the implications of declining fertility for global population and growth prospects.[13] Between these two perspectives lies an optimal global population profile that is ‘just right’. However, the determination of this path is inherently subjective.
Whether one views the implications of declining global fertility as a benign development or not, this does not diminish the challenges faced by countries with extremely low fertility rates (such as parts of Asia and Eastern Europe) or extremely high fertility rates (such as parts of Sub-Saharan Africa). International migration can help address the economic challenges that cross-country variations in fertility present, but it increasingly faces political opposition.

A Global ‘Demographic Time Bomb’

Before focusing on the economic effects of population aging, it is important to acknowledge the mechanical effect that declining population growth is having on headline GDP growth rates (as we discussed in detail in our Path to 2075 projections). In simple terms, GDP is a product of the number of people in employment and the amount of output each produces, so, if the growth rate in the number of people falls, the growth rate of GDP will also decline. Global population growth peaked at around 2% per year 50 years ago, is currently running at 1% per year, and is projected to fall to zero over the next 50 years, so the slowdown in population growth has contributed and will continue to contribute to slower GDP growth for some time (Exhibit 6).

Exhibit 6: The Growth Rate of the World’s ‘Working Age’ (15-64) Population Is Projected to Slow from +2.5%yoy in 1980 to -0.2%yoy in 2075

Total population and working-age population (15-64) growth (%, yoy)
6. The Growth Rate of the World’s ‘Working Age’ (15-64) Population Is Projected to Slow from +2.5%yoy in 1980 to -0.2%yoy in 2075. Data available on request.
Source: United Nations, Goldman Sachs Global Investment Research
However, policy typically focuses on maximizing GDP per person rather than overall GDP – as GDP differences due to population alone are typically viewed as neutral for economic welfare – and the anxiety over population aging is distinct from the effect that slower population growth is having on headline GDP growth. The main worry is that an aging population will result in a decline in the ‘working-age ratio’ (the proportion of individuals aged 15 to 64) as more people reach retirement age, ultimately lowering total employment rates and GDP per person.[14]
The DM working-age ratio has already declined significantly. It remained close to 67% from 1985 until the early 2000s, but has since dropped to 63% and is projected to fall to 57% by 2075 (Exhibit 7). If one assumes that employment rises and falls on a one-for-one basis with changes in the working-age ratio, the decline in the working-age ratio that has taken place should already have lowered employment and GDP per capita by 6% in DM economies since 2000 and it will lower employment and GDP per capita by a further 10% over the next 50 years (representing a peak-to-trough decline of 15%).[15]
In emerging economies, the 15-64 population ratio is currently nearing its projected peak of 66% and is expected to decline to 61% over the next 50 years. This means that EM economies, as a group, are currently at the so-called ‘demographic turning point’, marking a shift from demographic dividend to demographic drag.

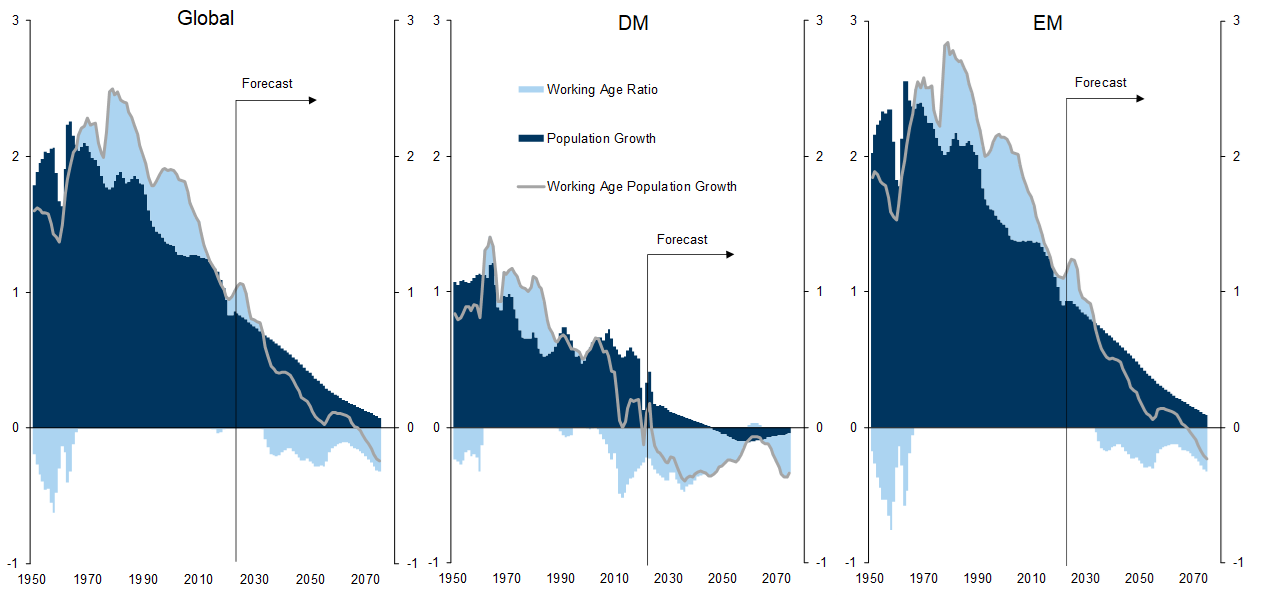
Exhibit 7: The ‘Working Age’ Ratio (15-64) in Developed Economies is Projected to Fall from 67% in 2000 to 57% in 2075 (-15%)

Share of population (%)
7. The ‘Working Age’ Ratio (15-64) in Developed Economies is Projected to Fall from 67% in 2000 to 57% in 2075 (-15%). Data available on request.
Source: United Nations, Goldman Sachs Global Investment Research

Defusing the Time Bomb: Extending Working Lives

The most direct means of offsetting the impact of population aging on total-population employment rates is for people to extend their working lives in proportion to the extension of their biological lives. If total employment rates are declining because the share of the population that is of ‘working age’ is falling, this can be offset by people extending their effective working lives.[16] With age-specific employment rates that are constantly evolving, the standard practice of assuming that employment rates rise and fall on a one-for-one basis with changes in the working-age ratio, despite all the other changes taking place, appears unduly pessimistic.
How large an adjustment to working lives is required to offset the effects of population aging on total employment rates? For DM economies, to offset the effect of the peak (67%) to trough (57%) decline in the working-age ratio would require a 15% increase in the average effective working life between 2000 and 2075. If the working-age ratio thresholds (15-64) corresponded directly to people’s actual working lives – meaning everyone started working at age 15 and retired at age 65 – then this would require extending working lives by 7½ years, raising the retirement age to 72½. However, in reality, people typically enter the workforce later than age 15 (generally because they are still in education) and on average they retire before reaching the age of 65 (due to early retirement/non-participation). Consequently, the average effective working life is considerably shorter than 50 years, which means the required extension to average working lives (measured in years) is also correspondingly lower.

The Good News: We Are Already Working Longer

Using a methodology employed by Eurostat for EU countries, we have calculated average effective working life estimates – the average time spent actively participating in the labor market, either employed or looking for a job – for 32 DM and 32 EM economies (see Box 2 for details).[17] In 2000 – when the DM working-age ratio was at its peak – we find the average effective working life was just over 34 years. This implies that that effective working lives would need to rise by 5 years between 2000 and 2075 to fully offset the impact of declining working-age ratios on total-population employment rates over this period.
Encouragingly, the transition towards extending working lives is already well underway. Exhibit 8 (LHS) displays data on the average effective working lives for DM economies. Since 2000, average working lives have increased by 4 years (from 34 to 38 years), with the result that, despite longer life expectancy and declining working-age ratios, the average share of life spent actively participating in the labor market has actually risen (from 44% to 47%; Exhibit 8 (RHS)).

Exhibit 8: The Increase in Working Lives in DM Economies Has Matched the Increase in Life Expectancy, Resulting in an Increase in the Share of Our Lives in the Labor Market

DM: Life expectancy and Duration of Average Effective Working Lives (LHS); Average Share of Life Participating in Labor Market (RHS)
8. The Increase in Working Lives in DM Economies Has Matched the Increase in Life Expectancy, Resulting in an Increase in the Share of Our Lives in the Labor Market. Data available on request.
Source: ILO, WHO, United Nations, Goldman Sachs Global Investment Research
This trend shows little sign of abating and is taking place in countries with minimal changes to pension laws, suggesting an adaptive response to increased longevity.[18] Indeed, there is a stronger link between changes in effective working lives and life expectancy across countries than there is between changes in effective working lives and increases in official retirement or pensionable age (Exhibit 9). While raising official retirement ages can help address the fiscal challenges of government pensions in an era of growing life expectancy, it doesn’t seem to be an essential requirement for people to extend their working lives.

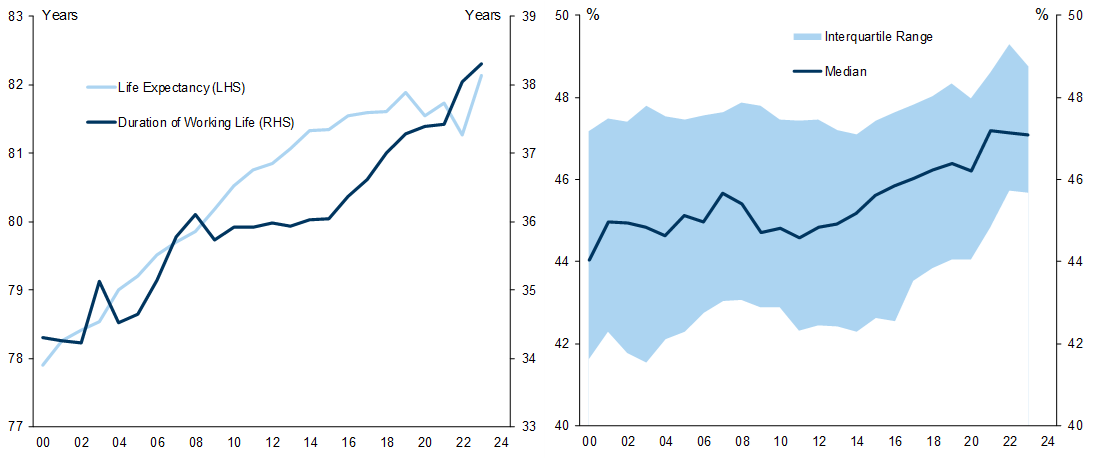
Exhibit 9: Effective Working Lives More Closely Linked to Longevity than Official Pension Age

Change in Effective Working Lives (2000-present) vs. Change in Life Expectancy (LHS) and Change in Official Retirement/Pensionable Age (RHS).
9. Effective Working Lives More Closely Linked to Longevity than Official Pension Age. Data available on request.
Where retirement ages differs between genders, we take the average retirement age across both genders.
Source: Goldman Sachs Global Investment Research, Finnish Centre for Pensions, OECD, National Sources
Not all the increase in effective working lives is happening in direct response to increased life expectancy. In particular, reducing the falloff in female participation following childbirth is helping to extend the working lives of women in many economies. (We discussed the role that reducing gender inequality in employment could play in offsetting the effects of population aging in a previous Global Paper.[19]) This change, though not a direct response to aging, has helped to mitigate its effects on labor force participation and employment. Less positively, the rise in female participation provides a one-time boost to overall participation rates and, once the male-female gap reaches a new equilibrium, this boost will cease. A number of DM economies seem to have already reached this point – the US male-female gap closed rapidly from the 1960s to the 1990s but has been largely stable since then. Nevertheless, there is still potential for further gains in female employment in some developed market economies, such as Japan and southern Europe, as well as in most emerging market economies.
Another important secular trend contributing to longer working lives has been the decline in the shares of population employed in manual labor. Early retirement tends to be concentrated in jobs that are more physically demanding. As the number of such jobs continues to decrease, the need for early retirement will also diminish.
The move towards extending working lives has more than offset the effect of population aging on DM employment, with the result that employment as a share of total population have also risen materially since 2000, despite the significant decline in the DM working-age ratio over this period (Exhibit 10).

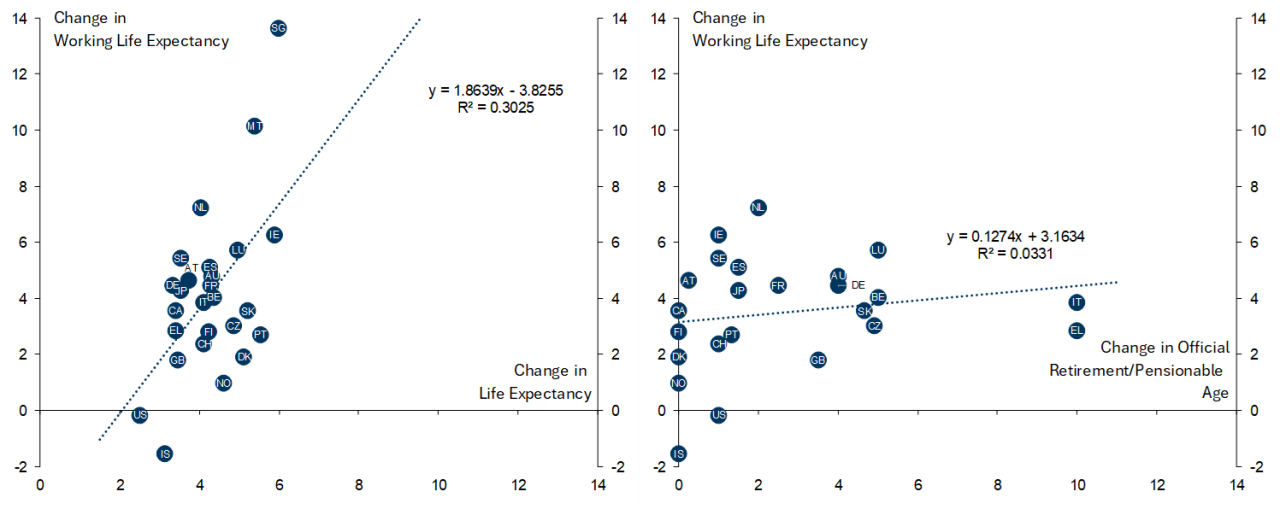
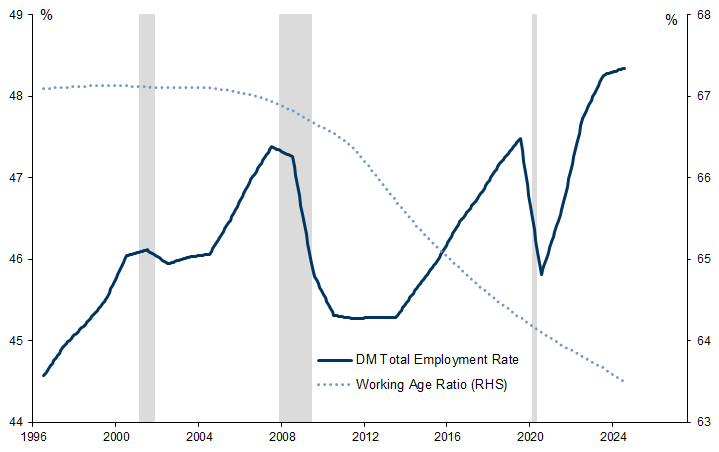
Exhibit 10: The DM Total Employment Rate Has Risen (Implying A Lower Dependency Ratio), Despite a Large Decline in the Working Age Ratio

DM Total Employment Rate (Total Employment/Total Population); Shaded areas signify global recessions
10. The DM Total Employment Rate Has Risen (Implying A Lower Dependency Ratio), Despite a Large Decline in the Working Age Ratio. Data available on request.
Source: Goldman Sachs Global Investment Research, International Labour Organization

We Look Good for Our Age

The working-age ratio in developed economies peaked before 2000, and we are now close to halfway through the demographic transition to lower working-age ratios. In gauging the effects of population aging on employment and dependency ratios, it may be time for economists to collectively mark their views to market. Despite the large decline in the DM working-age ratios that has already taken place, DM dependency ratios have actually fallen and the trend towards extending working lives shows no signs of abating.
Population aging presents other challenges for society that we have not focused on in this piece. Across the world we are spending an increasing share of income on health care, a development that reflects both increasing health costs as we grow older and the fact that, as incomes rise, we are prepared to spend more of our incomes to live longer, healthier lives.
On the positive side, there are other potential changes outside the focus of this research note that could help mitigate the effects of population aging: technologically driven improvements in productivity (in particular, those driven by AI) could increase GDP per capita, while improvements in robotics could be especially beneficial in elderly care.
But, as it relates to the effects of aging on employment, dependency rates, and GDP per capita, progress has already been encouraging. Transitions are often difficult to manage, but this is one transition that we are currently managing well.
Kevin Daly, Mambuna Njie*, and Johan Allen
*Mambuna is an intern in the CEEMEA economies team.

Box 1: The Path to 2075 – Long-term Projections for the Global Economy

The Path to 2075 projections build on our original BRICs analysis, offering long-term forecasts for the global economy, covering 104 countries out to the year 2075.[20] Exhibit 11 provides a high-level summary of our projections for the major regional aggregates, broken down by decade.
Our projections imply that global growth in 2024-29 (2.8%) will be faster than in 2020-24, but slower than in the 2010-19 decade (3.2%, based on market FX weights).[21] We project that EM growth will continue to outstrip DM growth (3.8% vs. 1.8%), with more than half of this difference due to (relatively predictable) demographic factors rather than (less predictable) productivity growth differentials. We expect Asia (ex-DM) to remain the fastest-growing region but, reflecting a marked slowdown in Chinese potential growth, it is also projected to see the largest deceleration relative to 2010-19.

Exhibit 11: A Gradual Slowdown in Global Economic Growth, With EM Growth Continuing to Outstrip DM

11. A Gradual Slowdown in Global Economic Growth, With EM Growth Continuing to Outstrip DM. Data available on request.
Source: Goldman Sachs Global Investment Research
Exhibit 12 combines our GDP estimates with our long-term real exchange rate projections, to project the real US Dollar value of major economies over time.
In 2050, we project that the world's five largest economies will be China, the US, India, Indonesia, and Germany (with Indonesia displacing Brazil and Russia among the list of largest EMs over this horizon). We estimate that China will overtake the US as the world’s largest economy around 2035.[22] If we extend the projection horizon to 2075, the world's three largest economies are China, India, and the US, with India (just) overtaking the US. Interestingly, US potential GDP growth is expected to be materially faster than China's at that horizon because of its better demographic outlook. Given the right policies and institutions, we project that current EMs will make up seven of the world's top ten economies in 2075.

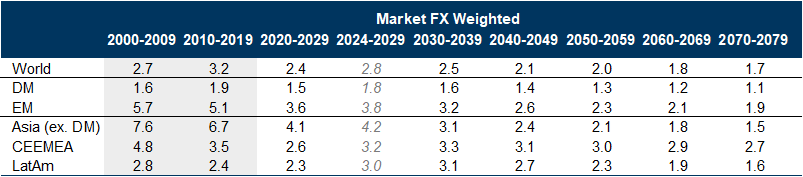
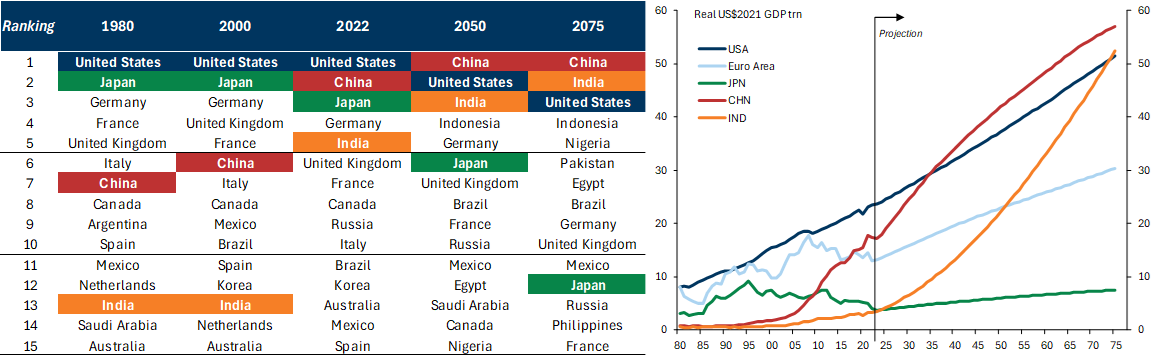
Exhibit 12: Our Projections Imply that China, the United States, India, Indonesia, and Germany Will be the World's Five Largest Economies in 2050

World's largest economies (measured in USD)
12. Our Projections Imply that China, the United States, India, Indonesia, and Germany Will be the World's Five Largest Economies in 2050. Data available on request.
Source: Goldman Sachs Global Investment Research
Making economic projections over a 50-year horizon for 104 countries inevitably involves a considerable degree of risk and uncertainty. Indeed, given the difficulties in forecasting even one or two years ahead, some readers may be skeptical of the value of forecasts that extend so far into the future. However, one advantage of making long-term projections is that cyclical risk – an important source of short-term forecasting error – tends to mean-revert over time, leaving GDP mostly determined by slower-moving trends in population, capital, and technology.

Box 2: Calculating Working Life Duration Estimates for DM and EM Economies

In calculating working life duration estimates for DM and EM economies, we closely follow the methodology employed by Eurostat for EU countries[23]. This methodology allows us to convert age-specific labor market participation data from the ILO[24] into estimates of the mean expected duration of working life – defined as the number of years a person at a given age is expected to be active in the labor market, based on current age-specific participation rates. The estimates, which are performed for 64 countries (32 DMs and 32 EMs), are derived as follows:
First, let x be an index for age. We define the activity rate rx at each age x as the share of the total population at age x that are active in the labor market

Data available on request.
where Lxa is the number people at age x that are in the active participants in the labor force (i.e., employed and unemployed but looking for work) and Lx is the total population of age x. At each age x, we impute the expected duration of working life as

Data available on request.
where ph-1,h is the probability of surviving between age h-1 and age h. We set the minimum age h = 15 and maximum age z = 84 and, to compute a measure for the expected duration of working life across countries, we use activity rates from the ILO and model life tables from the WHO Global Health Observatory data repository.
The ILO provides activity rates by five-year age groups, from ages 10-14 and 60-64, with an open-ended group for 65+. The absence of five-year age participation data beyond 65 years presents a challenge for our estimates relative to those that Eurostat calculates for EU countries (as these estimates benefit from five-year age-specific participation data up to the age of 75). To account for this, we assume that the relative distribution of participation rates in the ILO’s 65+ category mirrors the relative distribution in the EU’s 65-69, 70-74 and 75+ groupings. Unsurprisingly, the EU data suggest that the distribution of activity rates for the open-ended 65+ group is heavily skewed towards people in their late 60s and early 70s, with participation rates falling off significantly beyond 75 (Exhibit 13).
This assumption allows us to partition the 65+ group of each country in the ILO dataset into three additional groups: 65-69, 70-74 and 75+, using each group's contribution to the overall activity rate for 65+ in the EU as a scaling factor. Exhibit 14 compares our and Eurostat’s aggregate measure of expected duration of working life for the EU.

Exhibit 13: Distribution of Activity Rates for People Aged 65+ is Heavily Skewed Towards those in their Late 60s and Early 70s

Activity Rates for People Aged 65+ in the EU
13. Distribution of Activity Rates for People Aged 65+ is Heavily Skewed Towards those in their Late 60s and Early 70s. Data available on request.
Source: Eurostat, Goldman Sachs Global Investment Research

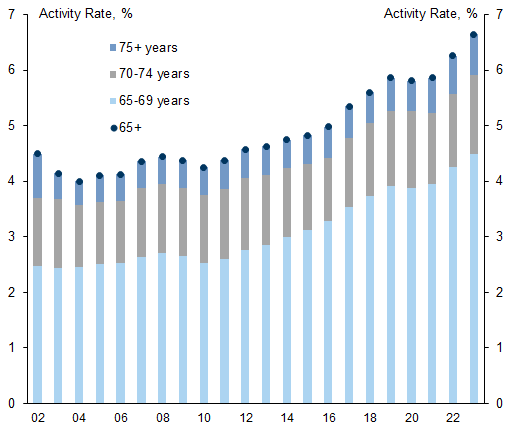
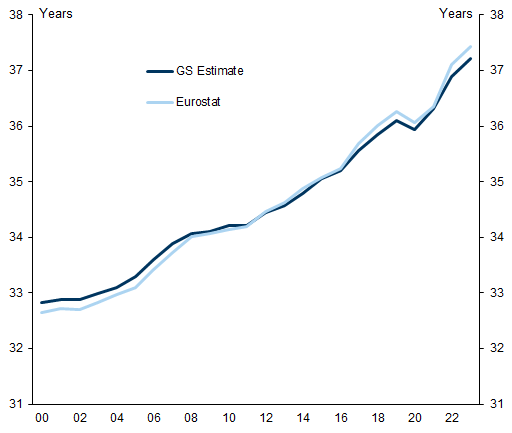
Exhibit 14: Our Estimate for Working Life Duration in the EU Tracks Well with Eurostat's Official Measure

Working Life Duration in the EU (Median)
14. Our Estimate for Working Life Duration in the EU Tracks Well with Eurostat's Official Measure. Data available on request.
Source: Goldman Sachs Global Investment Research, Eurostat, ILO, WHO

Bibliography and Thanks

Ashwin, J. and A. Scott (2025), ‘A Bayesian Model of Later Life Mortality Trends and Implications for Longevity’, Journal of the Royal Statistical Society Series A: Statistics in Society
Brown, Lester (2012), ‘Full Planet, Empty Plates – The New Geopolitics of Food Scarcity’, WW Norton & Company
Daly, K (2007), ‘Gender Inequality, Growth and Global Ageing’, Goldman Sachs Global Economics Paper (April 3, 2007)
Daly K. and T. Gedminas (2022), ‘The Path to 2075 — Slower Global Growth, But Convergence Remains Intact’, Goldman Sachs Global Economic Paper (December 6, 2022).
Ehrlich, Paul R. (1968), ‘The Population Bomb’, Sierra Club and Ballantine Books
Fernández-Villaverde, J. (2021), ‘The Demographic Future of Humanity: The Trends (Part 1)’, Public Discourse
Foster, E and G. Skoog, G (2004), ‘The Markov Assumption for Worklife Expectancy‘, Journal of Forensic Economics, 17 (2), 167-183
International Monetary Fund (2025), ‘The Rise of the Silver Economy: Global Implications of Population Aging’, IMF World Economic Outlook (15 May 2025)
Krueger K. and F. Slesnick (2014), ‘Total Worklife Expectancy‘, Journal of Forensic Economics, 25 (1), 51-70
Loichinger E. and D. Weber (2016), ‘Trends in working life expectancy in Europe‘, Journal of Aging and Health, 28 (7), pp. 1194-1213
Malthus, Thomas Robert (1798), 'An Essay on The Principle of Population'
Scott, Andrew J., (2023), 'The Economics of Longevity – An Introduction', The Journal of the Economics of Ageing
United Nations, World Population Prospects (Various vintages)
Wolfbein, Seymour L (1949), ‘The Length of Working Life‘, Population Studies, 3 (3): 286-94
This piece has benefitted from useful comments from Jan Hatzius, Andrew Tilton, Joseph Briggs, Dominic Wilson, Kamakshya Trivedi, Sharon Bell, Peter Oppenheimer, Christian Mueller-Glissmann, Jari Stehn, Filippo Taddei, and Tadas Gedminas.
  1. 1 ^ We use the standard financial market classification for DM economies. Our classification of EM economies includes all countries not included in the DM group – i.e., we do not distinguish between ‘emerging’, ‘developing’ and ‘frontier’ economies. The countries in this broad EM group account for a large majority of the global population (currently 87%) but a much smaller share of global GDP (40%, at market exchange rates).
  2. 2 ^ These projections are made in World Population Prospects, which is a biennial report from the United Nations presenting historical demographic data starting from 1950, as well as projections (until 2100 in the latest report) for 237 countries or regions. The most recent report was published in July 2024.
  3. 3 ^ The life expectancy figures we quote are for total population (men and women). Life expectancy is typically higher on average for women than for men, although the gender gap in life expectancy has been declining over time in both developed and emerging economies.
  4. 4 ^ The standard method for reporting life expectancy data is based on the ‘period life expectancy’ approach, which calculates the average number of years a person can expect to live based on the current mortality rates at a specific point in time. ‘Cohort life expectancy’ estimates, on the other hand, aim to account for future changes in mortality. While ‘cohort life expectancy’ estimates are inherently subjective, they tend to offer a more realistic assessment than forecasts that assume zero future improvement in mortality rates.
  5. 5 ^ This represents a likely ‘best case’ scenario because a significant portion of the increase in life expectancy over the past 150 years can be attributed to the reduction of early-life mortality rather than extending the upper limit of human lifespan. Given the high rates of survival to old age in developed countries, the potential for further gains of this type is more limited. This implies a probable slowdown in the rate of increase in longevity in the frontier over time. See Ashwin and Scott (2025).
  6. 6 ^ These results are based on an empirical analysis using almost one million observations for individuals aged 50-90 in 29 advanced economies (AEs) and 12 emerging market economies (EMs) during 2000–22. Physical and cognitive abilities are compared over time, having controlled for differences in other co-variates, including socioeconomic characteristics (such as education and wealth) and cross-country effects. See IMF (2025), ‘The Rise of the Silver Economy: Global Implications of Population Aging.’
  7. 7 ^ The distinction between focusing on the implications of an 'aging economy' and a 'longevity economy' is one that is emphasized by Scott (2023).
  8. 8 ^ To replace themselves (assuming fixed mortality rates), women, on average, need to have one female child who survives long enough to have a female grandchild. The reason this replacement rate is 2.1 rather 2.0 is (i) not all women will live to the end of their reproductive age and (ii) the sex ratio at birth is usually around 105 males born for every 100 females. In countries with high early-life mortality rates or where there are more than 1.05 males born for every female, the fixed-mortality replacement rate is higher than 2.1.
  9. 9 ^ Increasing life expectancy results in a ‘drift’ in mortality, which reduces the number of deaths per year relative to a population with fixed life expectancy. All else equal, a 0.25 per year increase in life expectancy will reduce the number of deaths per year by 1/(1+0.25) relative to a population whose life expectancy is fixed, reducing the replacement rate from 2.1 to around 1.6-1.7. Given that global life expectancy has been rising at a faster rate than this (0.32 per year), the fertility rate that has historically corresponded to zero population growth has been even lower, at around 1.5-1.6.
  10. 10 ^ Immigration from EMs has also contributed to DM population growth but, even excluding immigration, DM population growth would have been positive over the past 50 years, despite an average fertility rate that has consistently been well below 2.1.
  11. 11 ^ The UN population projections also assume a very slow increase in life expectancy, which has consistently been exceeded by reality. If life expectancy continues to surprise to the upside, this implies upside risks to its population projections.
  12. 12 ^ Concerns over the implications of population growth date back to Thomas Malthus (1798). Malthus argued that exponential population growth, combined with linear growth in food supply and other resources, would result in a Malthusian Trap and population decline. At the time of writing, the global population is estimated to have been around 1 billion people. Malthus was wrong because growth in food supply and other resources also proved to be exponential. However, while global food supply has more than matched population growth to date, there are limits on the extent to which this is likely to be true in the future and there have been a number of more recent studies warning of the consequences of continued global population growth (see, for example, Ehrlich (1968) or Brown (2012)).
  13. 13 ^ Fernández-Villaverde (2021) is a notable proponent of the more negative interpretation of declining fertility trends. Our view is more benign than his on this point for two reasons: first, he does not adjust the replacement rate for increases in longevity; second, he takes a more pessimistic view of the likely trajectory of future fertility, arguing that countries where fertility is exceptionally low represent a likely template for the rest of the world. Nevertheless, even on this basis, he still expects the global population to continue growing until ‘between 2050 and 2060’.
  14. 14 ^ The total-population employment rate is the share of the entire population that is employed, unlike standard employment rate measures in which a measure of the working-age population is used as the denominator. The ‘dependency ratio’ is given by 1 – total-population employment rate.
  15. 15 ^ As we will discuss, it is not reasonable to assume that employment rates rise and fall on a one-for-one basis with changes in the working-age ratio. However, this assumption is implicit in most studies of the economic effects of population aging.
  16. 16 ^ Cross-country migration can offset the effects of population aging in countries where fertility is particularly low, but does not provide a solution to global aging.
  17. 17 ^ Although we have constructed the data for both developed and emerging market economies, our analysis primarily focuses on DM economies, where working-age ratios have already significantly declined.
  18. 18 ^ Although not the focus of our analysis, it is worth noting that the average number of years people spend in education has also been increasing over time. As life expectancy rises, all stages of life are extending, making it logical for individuals to both lengthen their time in the workforce and invest more years in education.
  19. 19 ^ Daly, K (2007), ‘Gender Inequality, Growth and Global Ageing’, Goldman Sachs Global Economics Paper (April 3, 2007)
  20. 20 ^ The Path to 2075 — Slower Global Growth, But Convergence Remains Intact”, Goldman Sachs Global Economics Paper, 6 December 2022.
  21. 21 ^ Because of the large swings in GDP growth generated by the Covid pandemic, the 2024-29 column provides the cleanest indication of what our model indicates for near-term potential growth.
  22. 22 ^ Given the recent pessimism around China’s long-term growth prospects, some readers may be surprised that we expect China to overtake the US at this horizon. However, three points are worth bearing in mind in this regard: First, China has already closed most of the gap with US GDP (China's GDP has risen from 12% of the US in 2000 to around 80% currently). Second, despite significant downward revisions, potential growth in China remains significantly higher than in the US on our revised estimates (4.0% vs. 1.9% for 2024-29). Third, in addition to differences in potential growth, we expect some of the US Dollar’s real overvaluation vs. the Chinese Yuan to be unwound over the next 10-15 years.
  23. 23 ^ Earlier studies in the literature such as Wolfbein (1949) employ a similar concept in estimating length of working life in the US in the 1940s. In more recent times, forensic economists such as Foster and Skoog (2004) and Krueger and Slesnick (2014) have used the so-called Markov increment-decrement model (MID) to estimate working life duration. For more details, see Foster, E and G. Skoog, G (2004). “The Markov Assumption for Worklife Expectancy”. Journal of Forensic Economics, 17 (2), pp. 167 – 183; Krueger, K and F. Slesnick (2014). Total Worklife Expectancy. Journal of Forensic Economics, 25 (1), pp. 51 – 70; Wolfbein, S. L. (1949). “The Length of Working Life”. Population Studies, 3 (3), pp. 286 – 294.
  24. 24 ^ Loichinger and Weber (2016) used labour force participation rates from the ILO in estimating working life duration in Europe. See, E. Loichinger and D. Weber (2016). “Trends in working life expectancy in Europe”. Journal of Aging and Health, 28 (7) (2016), pp. 1194-1213.

Investors should consider this report as only a single factor in making their investment decision. For Reg AC certification and other important disclosures, see the Disclosure Appendix, or go to www.gs.com/research/hedge.html.