A cynic knows “the price of everything but the value of nothing.” If confronted, he might say the same thing about our GDP statistics. After all, smartphone consumption in the official statistics still lags the tallies from the smartphone industry itself—even after last summer’s GDP benchmark revision. And on the inflation side, while many old sources of mismeasurement have been resolved, software and healthcare quality appear to be even more important.
Missing growth from “free” digital goods like Google Maps, camera phones, and Snapchat may be an even larger issue. In an experimental setting, Brynjolfsson et al. (2019) induce consumers to choose between foregoing access to social media or paying a monetary penalty. The dollar values assessed by the median participant imply trillions of unmeasured consumer surplus.
The rise of the internet has blurred the lines between the economic and household spheres, and much of what we do on Facebook—sharing stories with friends, planning and reviewing social events—is a substitute for traditional household activities that are non-market in nature (and hence should be excluded from GDP). This may explain why “willingness to pay” approaches can produce implausibly large estimates of newly created consumer surplus: the utility is not new, it has just migrated online.
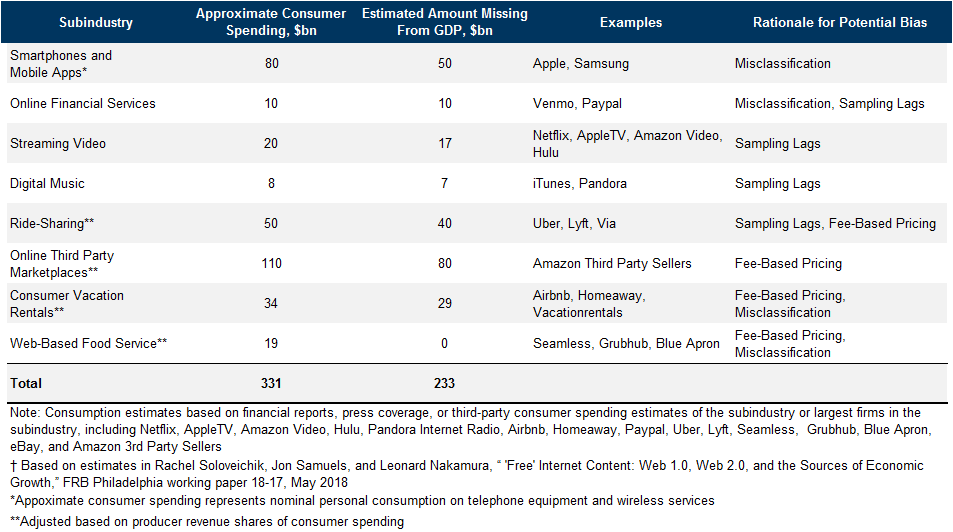
A top-down perspective also indicates huge scope for unmeasured output, as growth of domestically generated profits and incomes (GDI) is outpacing that of GDP, a departure from earlier decades. On top of this, US profits generated in tax havens totaled over $300bn in 2018, some of which represents unmeasured domestic production. Our updated bottom-up estimates ($233bn of missing nominal consumption) are in the same ballpark.
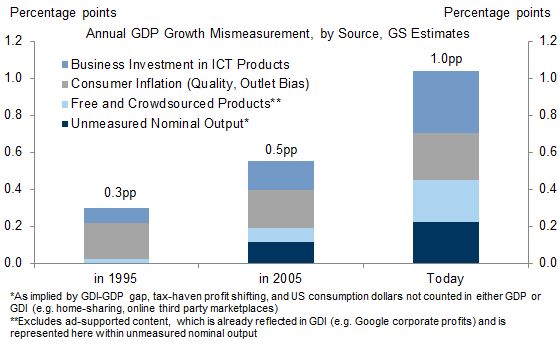
We conclude by assessing GDP mismeasurement across four dimensions: unmeasured nominal output, free and crowdsourced digital products, consumer inflation (quality change, outlet bias), and business ICT investment. In our central estimate, the pace of annual real GDP growth is understated by around 1.0pp currently, up from 0.5pp in 2005 and 0.3pp in 1995. This is somewhat larger than our previous estimates and would imply that roughly half of the post-crisis productivity slowdown is explained by greater mismeasurement.
Productivity Paradox v2.0: The Price of Free Goods
Exhibit 1: Most “Radio Shack” Products Are Now Embedded in a Single Smartphone...

Exhibit 2: ...Yet as Currently Measured, Tech-Intensive Consumption Growth Has Actually Slowed
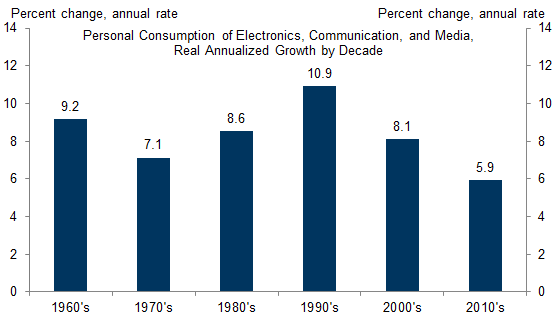
Exhibit 3: Revisions Moving in Right Direction (but More to Come)
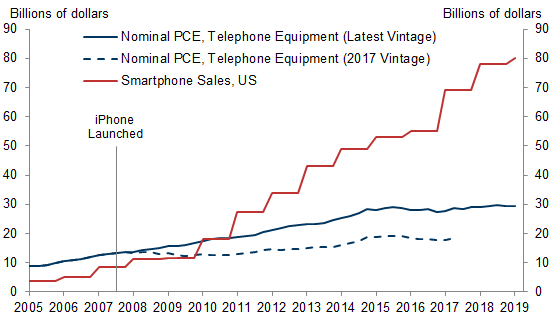
Exhibit 4: Despite Methodological Improvements, Price Mismeasurement Remains an Important Issue
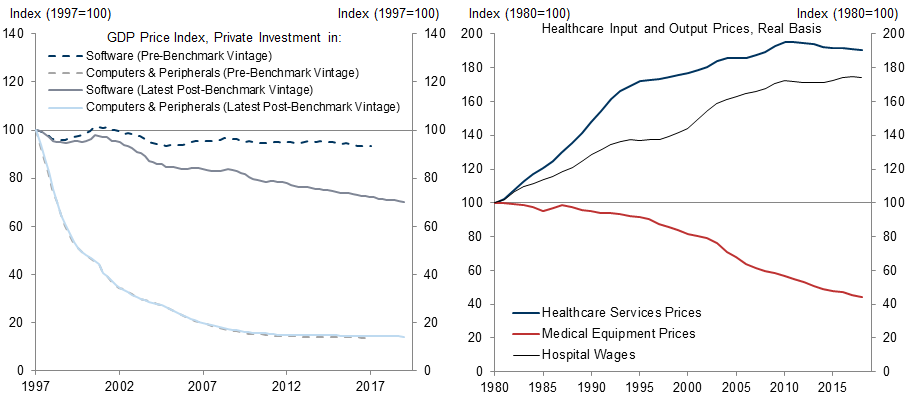
Exhibit 5: Inflation Measurement: What’s Changed, and What Hasn’t?
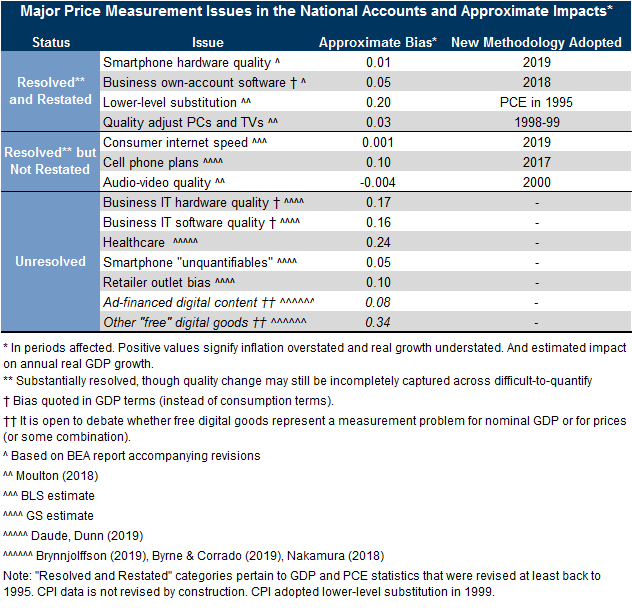
Exhibit 6: Domestically Produced Income Has Grown More Quickly than GDP Since the Mid-1990s
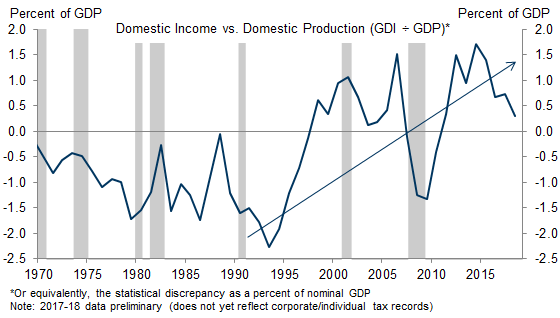
Exhibit 7: Windfall Profits in Tax-Haven Countries Likely Represent Another $200bn of Missing US GDP
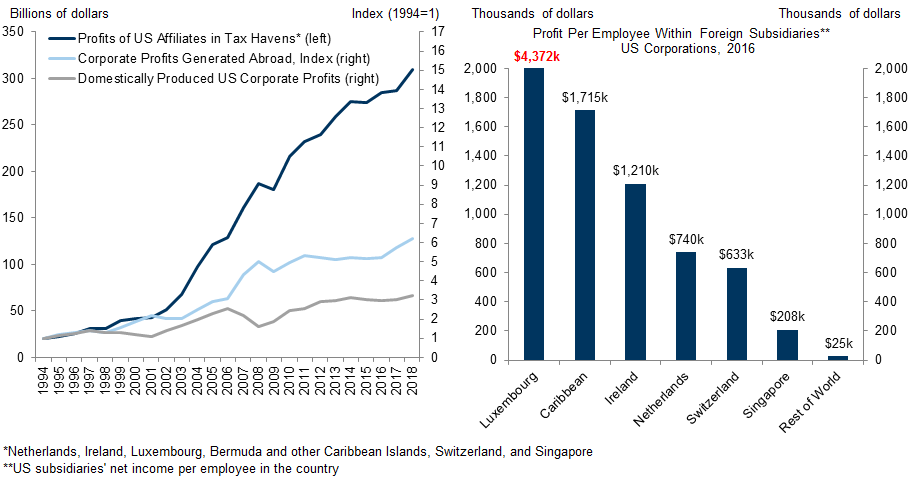
Exhibit 8: GDP-Accounting Approach Alone Suggests Nominal Growth Understated by 0.10-0.15pp/year
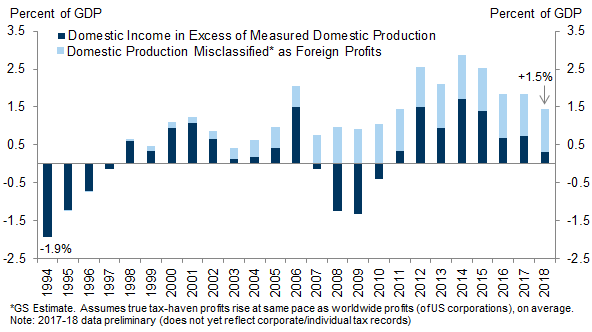
Exhibit 9: Economic Services Once Provided by Phone Companies and Travel Agents Are Now Consumed for Free Online; Gig Economy Also Likely Understated
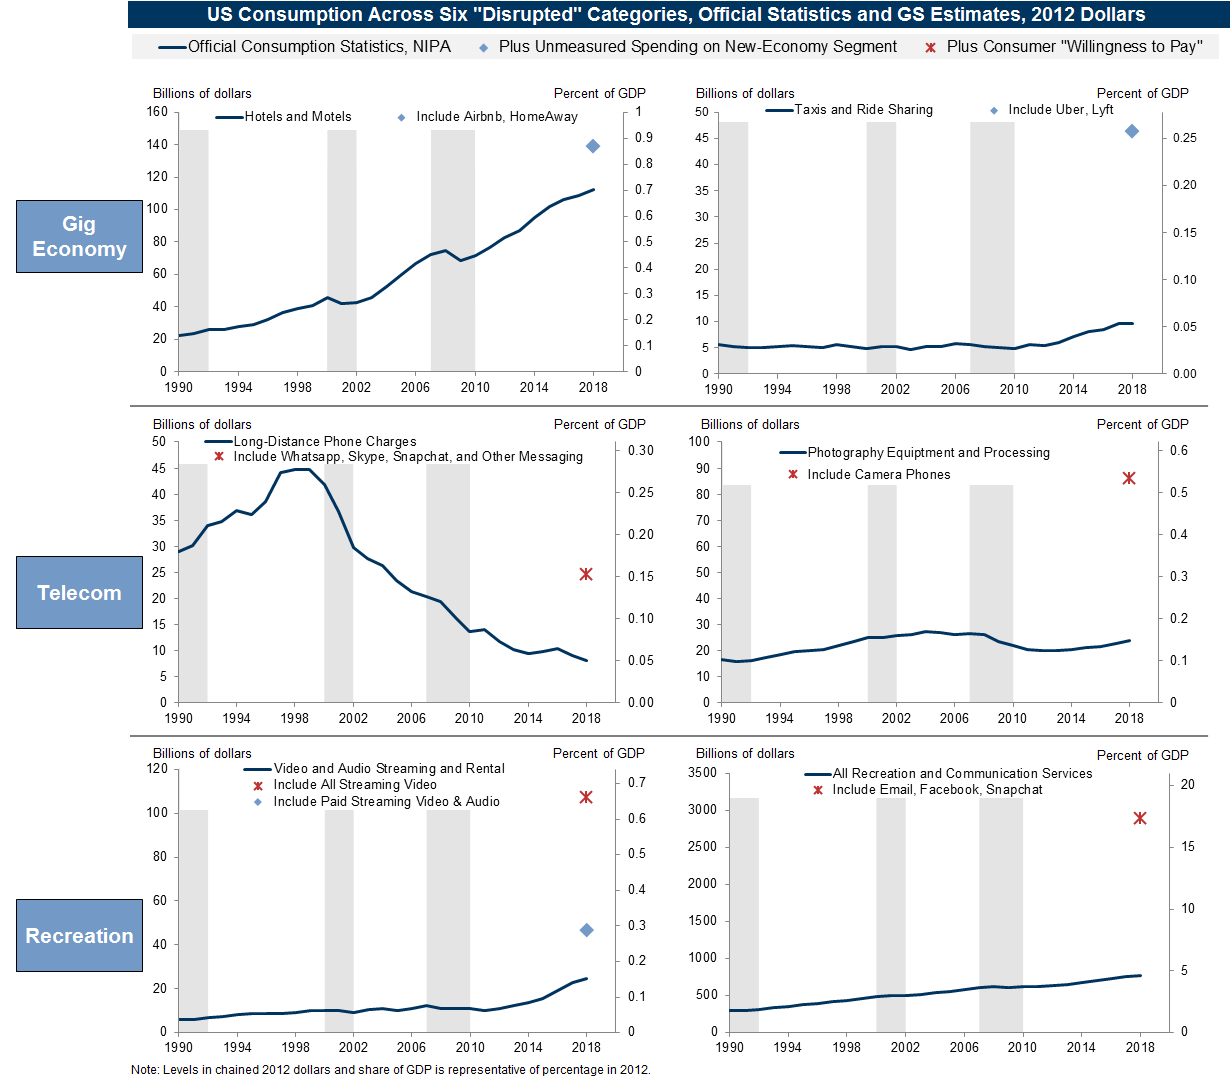
Exhibit 10: Much of This Missing Nominal Growth Occurs in the Nexus of the Economic, Household, and Digital Spheres (Some of Which Is Already Counted in Gross Domestic Income)
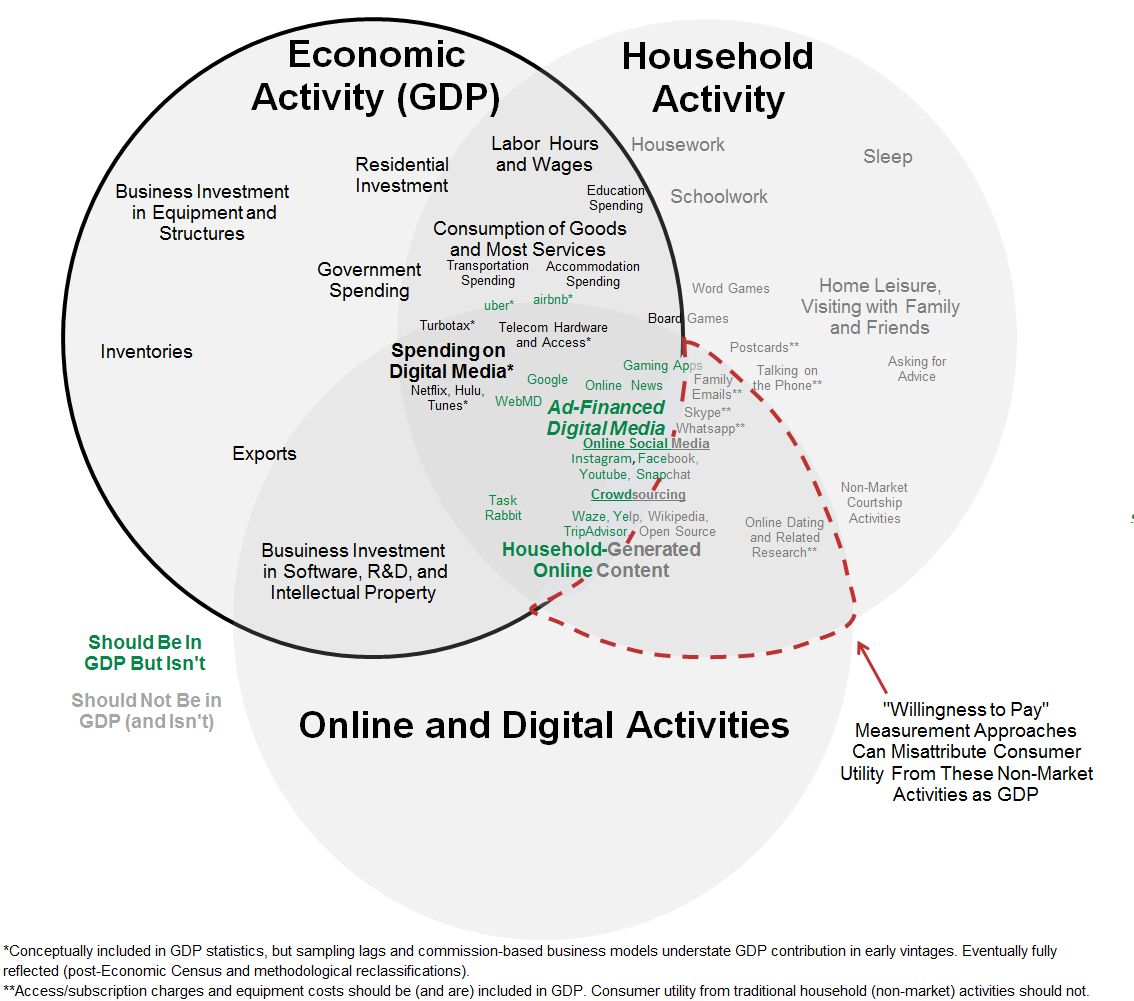
Exhibit 11: Across Four Sources of Measurement Error, We Estimate GDP Growth Is Understated by 1.0pp Today, Double the Bias in 2005
Spencer Hill
Appendix
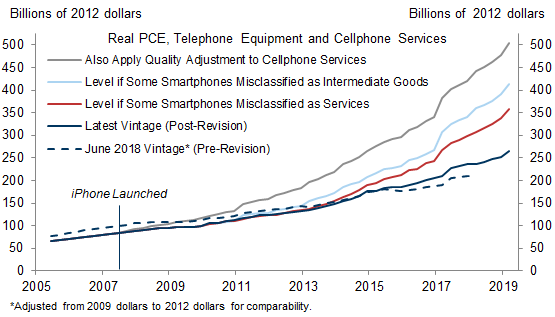
Smartphones Still Represent $100bn-$225bn of Missing Real Consumption
Bottom-Up Estimates Continue To Suggest Over $200bn of Unmeasured Nominal Consumption, on the Same Order of Magnitude as Top-Down Estimate of Missing GDP
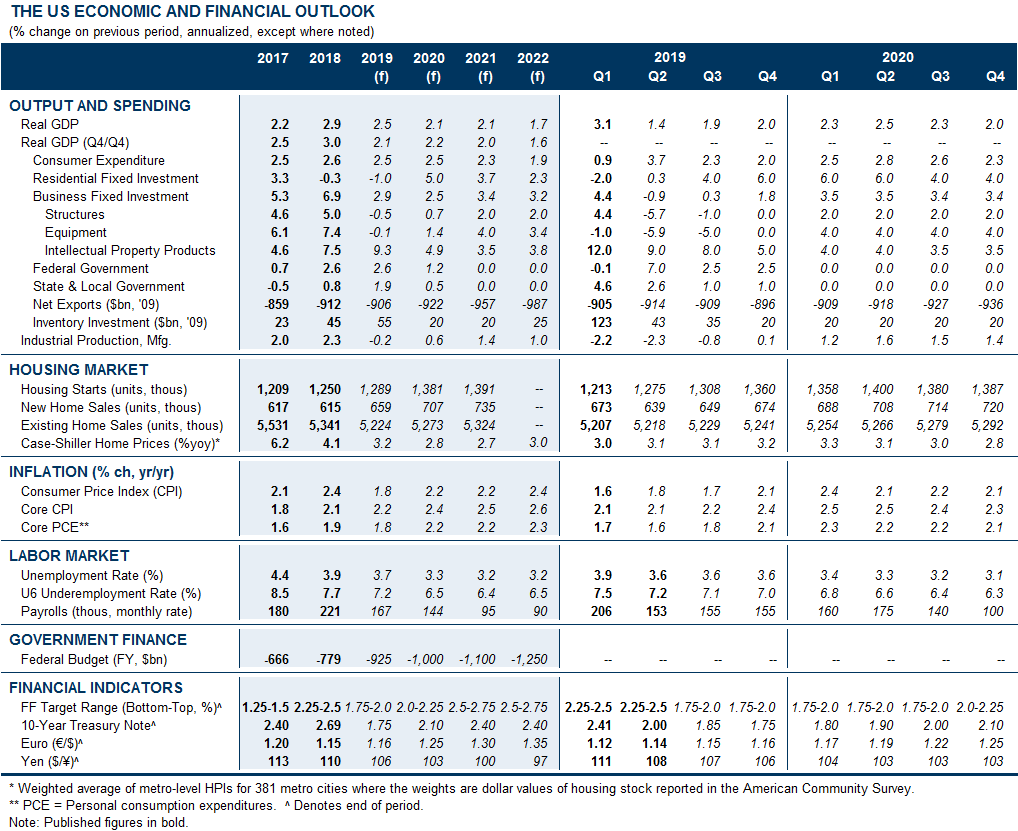
The US Economic and Financial Outlook
Forecast Changes
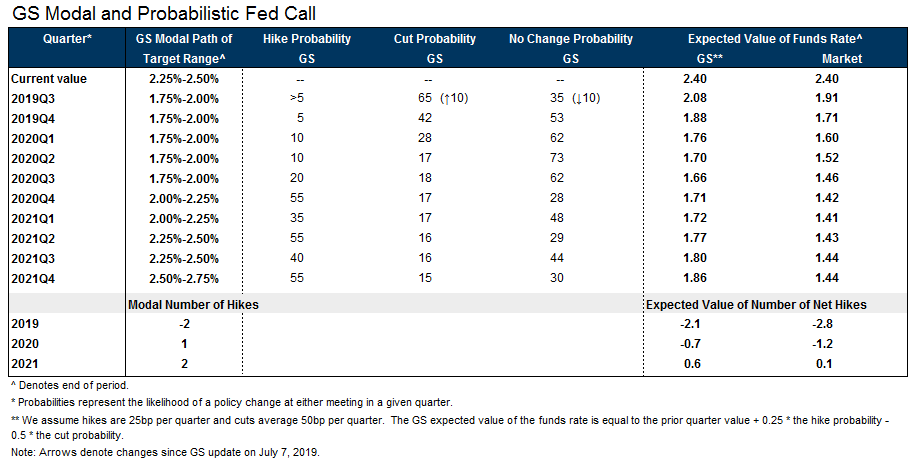
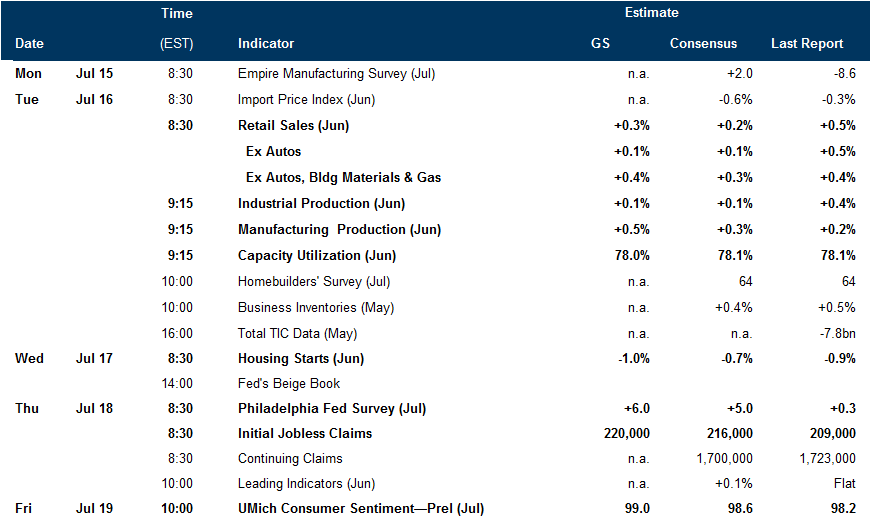
GS Probabilistic Fed Call and Economic Releases
- 1 ^ Why might such a gap persist? First, last summer’s comprehensive update incorporated the Economic Census of 2012, not the 2017 version currently being analyzed (preliminary data released in September; benchmark revision in 2022). In addition to potentially stale readings of nominal spending levels, sample-based methods can sometimes cause misclassification issues. In Smartphones for example, the vast majority are purchased using financing or are heavily discounted by wireless carriers, who implicitly finance these purchases through a cell phone contract. As a result, smartphone consumption in some cases may be misclassified as telecom services revenues and are then measured by the more stable price index-- understating real consumption growth. Similarly, if some iPhones are instead classified as intermediate inputs used by wireless carriers in their production process, they would be omitted in the GDP and PCE calculations entirely. Even if they are classified as business investment (and is measured in GDP), the non-work related smartphone services provided to the employees who use them would not, with the monthly payments instead classified as a business-to-business input cost.
- 2 ^ For example, the level of nominal internet spending was revised up by 28% with the 2013 benchmark revision.
- 3 ^ For the healthcare sector, non-economic factors such as reduced smoking and healthier diets play a role in improved health outcomes. Accordingly, we base our healthcare assumption on the promising results of Dauda, Dunn, and Hall (2019), who control these factors and adjust for healthcare outcomes (improvement in life expectancy vs. the prevailing standard of care). Specifically, we apply their “conservative” estimate of annual quality change (+3.1%, which itself assumes an additional year of life is valued at $50k) to the hospital subset of US healthcare spending—excluding doctor’s office visits and nursing home spending that is not skewed toward major/life-saving procedures. Note that we exclude both business IT and unpaid digital consumer content in the 0.4pp point estimate.
- 4 ^ By economists Rachel Soloveichik, Jon Samuels, and Leonard Nakamura.
- 5 ^ Relatedly, to the extent “consumer time use” is a significant driver of Byrne and Corrado (2019)’s results, growth estimates may be overstated as consumer time inexorably shifts from the physical to digital world.
- 6 ^ Indeed, we note that many of the items in the center-middle section of the diagram are already counted in GDI—and thus should be captured by the top-down approach of Exhibit 8.
- 7 ^ Where should we draw the line? Ultimately, if an activity makes money in an arm’s-length transaction or represents a direct substitute for other market activities from which it has gained share, it should be incorporated in GDP in one way or another. If it is a non-market activity whose predominant value is developmental or social—it should not—regardless of whether it takes place online or in the physical world.
- 8 ^ The volunteer participants in these studies may not be representative of older or lower-income consumers who spend relatively less time on consumer free digital goods.
Investors should consider this report as only a single factor in making their investment decision. For Reg AC certification and other important disclosures, see the Disclosure Appendix, or go to www.gs.com/research/hedge.html.