Goldman Sachs Research
Global Markets Analyst
"To V or Not to V": Gauging a potential recovery trajectory
Table of Contents
15 April 2020 | 12:59PM EDT | Research | Economics| By Caesar Maasry and others
More
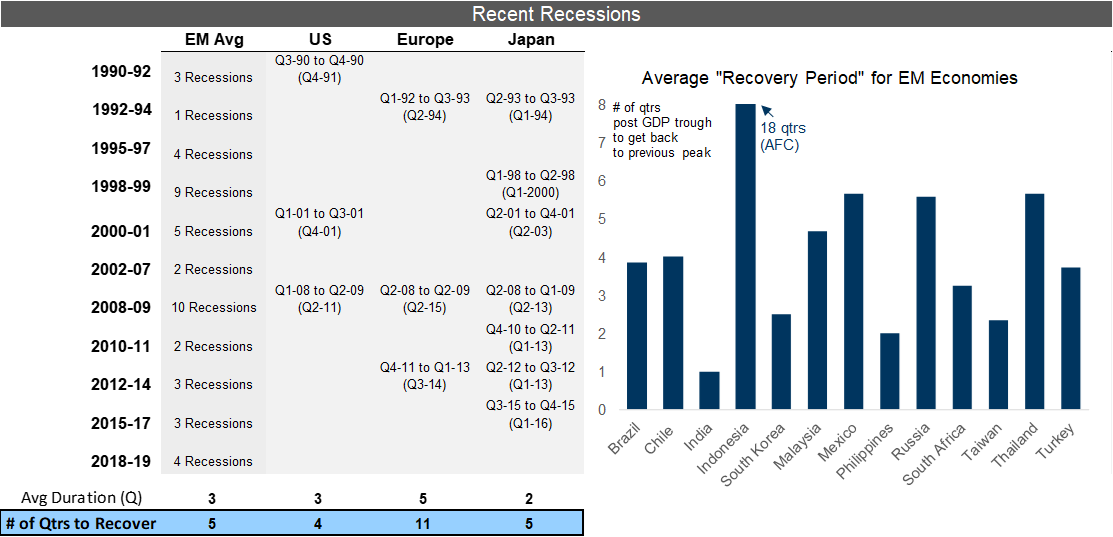
  • (1) Recession Recovery Paths: The past 30 years offer 46 recessions across the 12 largest EM economies, and history suggests that economies tend to recover previous peaks of output 5 quarters after the end of the recession. There is wide variance across times and geographies, but over 75% have recovered within 5 quarters, suggesting this is a decent rule of thumb for an 'average recovery'.

  • (2) EPS Gauging: At the headline level, EPS trajectories are similar to GDP -- earnings often take roughly 14 months to re-attain the highs preceding a bear market. There is nuance here: forward estimates fall by less and take a shorter amount of time to recover than realized earnings, and these estimates are a better barometer of market performance than realized data.

    Further nuance in the current environment: investors appear focused on "second year" EPS and the potential for a quick snap-back in 2021 activity. Usually, long-term EPS forecasts are heavily anchored by short-term estimates, but the sudden-stop around the Asia Financial Crisis provides a potential historical analogy (2000 forecasts were flat as 1999 estimates were slashed 14%).

    For context, our base-case 2021 MSCI EM EPS forecasts point to a further 6% downward revision to consensus estimates (marking a total 15% downgrade to "long-term" estimates, slightly more than those of 2002 and 2016). These estimates drive our 12-month target of 950 (+6%) for MSCI EM.

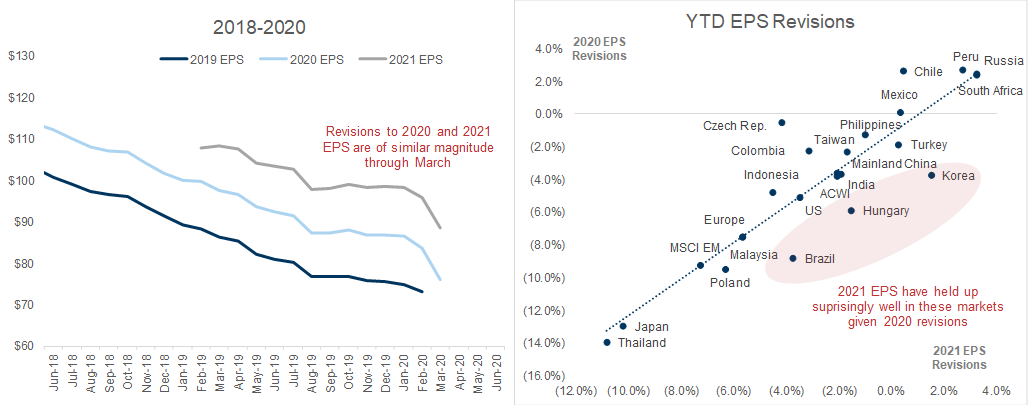
  • (3) V-Shape, L-Shape, Short-Lived EPS Recessions: Taking an average across previous recessions may not be particularly helpful as the trajectories of the past four episodes have taken on different shapes. We find two important observations for the current environment: first, EM asset rebounds have been dependent on US policy and earnings recoveries (via global risk premia channels); second, there are a few notable EMs where EPS estimates are anticipating a strong rebound in 2021 (Brazil, Korea, and CE-3). These markets have seen downgrades to 2020 estimates that have not been "carried forward" into 2021 as they have been across the rest of EM (and DM for that matter).

To V or Not to V

1. What is a V-Shape Recovery

With recent data showing slowing infection rates across the globe, investors are now looking towards the 'opening' of the economy and potential recovery in the quarters ahead. We remain cautious on cyclical risks but given the focus on the shape of the recovery, this report outlines historical recovery glidepaths and how the current recession may differ.
From an EM perspective, the data set is substantive in terms of recent recessions -- 46 recessions have occurred across major EM economies since 1990. For comparison, the US and Europe have registered three each, and Japan has several more (7) given the structurally low growth rates there.
On average, economies tend to recover to 'previous peak GDP' roughly 5 quarters following the end of a recession. The below table summarizes this statistic across major regions and EM economies; the calculations are based on seasonally-adjusted quarterly real GDP (not a four-quarter sum). This is true both in EM and DM, but there is wide variance across country and time period (for example, Europe took six years to recover from the GFC).
This 5 quarter average is an important benchmark in our view given the current market focus on whether 2021 levels of output will be similar to 2019 or remain repressed for the long term. This simple historical calculation suggests that a recovery to previous quarterly GDP output by late 2021 would be "average" assuming the economy gets out of recession by 3Q 2020.
Within EM, the "DMs" of EM have posted the quickest recoveries (Korea, Taiwan) as well as those with high structural growth rates (India); whereas countries with considerable crises in the 1990s show up as relatively long-lived recovery cycles (Indonesia, Russia, Mexico). This historical cross-sectional dataset may not be repeated during the current crisis, but a large share of EM recessions have adhered to the "5 quarter" recovery period that we find a relevant rule-of-thumb to keep in mind going forward. Consequently a recovery that takes one year (four quarters) or less could potentially be considered a "V-shape".

Exhibit 1: With some variation, an "average recovery" takes 5 quarters

1. With some variation, an "average recovery" takes 5 quarters. Data available on request.
Source: Haver Analytics, Goldman Sachs Global Investment Research

2. Gauging Expectations - EPS Trajectories into and out of recessions

Realized economic data certainly provides important anchors for global markets, but expectations are more likely in the driver's seat during and coming out of recessions. Below, we look at corporate earnings expectations in EM and across DM regions to gauge how markets may price off the 'forward view' during periods like the present.
There is additional nuance here, in that we find it important to distinguish between near-term forward estimates (such as NTM, or next-twelve-months) and long-term estimates (such as STM, or second-twelve-months). This is particularly important in the current environment where, anecdotally, we find that investors appear willing to write-off 2020 (largely the NTM numbers) and already focus on potential 2021 earnings (STM, effectively).
In Exhibit 2, we highlight the trajectory of both realized and estimated EPS data during the four major recessionary periods since the late 1990s (1998, 2002, 2008, 2016). EPS cuts appear relatively muted during the bear market (part of this is noise around varying durations of a bear market) but the earnings revisions become more aggressive heading into a market trough; and they continue after the market has hit a bottom (market trough here is modeled around MSCI EM).
After EPS forecasts start to rise (usually 3-5 months after the market hits a trough), the average recovery period is roughly 12 months. From a sequencing perspective, EPS forecasts tend to recover prior to the trough in realized earnings (unsurprisingly) and also return to previous peak levels sooner as well (at the margin, long-term expectations tend to recover quicker than short-term expectations). Similar to the above discussion regarding GDP, an EPS recovery of one year or less could be considered "V-Shape".

Exhibit 2: Earnings tend to recover roughly 15 months after the market trough

2. Earnings tend to recover roughly 15 months after the market trough. Data available on request.
Source: FactSet, DataStream, I/B/E/S, Goldman Sachs Global Investment Research
Looking a bit more in depth at the individual recessions, the variation in terms of magnitude (amount that earnings decline during a recession) and recovery length are considerable (see Exhibit 3). For MSCI EM, realized earnings decline an average of 30% and long-term estimates drop 19%. For the US, the figures are 16% and 13% respectively. To put this in perspective, EM EPS has been cut by just 4% year-to-date, with estimates being cut both for 2020 and 2021. Japan has had the most volatile EPS history, with recoveries taking much longer as well - but so far, year-to-date, Japan EPS has actually risen.
While this sample is only based on four episodes, EM and the US appear to recover faster than the rest of the World, particularly when looking at long-term EPS estimates. Interestingly, Europe is the only region where long-term EPS estimates take longer to recover than short-term estimates, perhaps evidence of a structural downgrade in long-term growth potential.
Across all regions, the EPS recoveries were quicker during the late 1990s and early 2000s recessions (recouping previous peak EPS within one year) compared with the GFC and the 2016 slowdown (1.5 - 2 years+). We take a closer look at these recoveries further below.

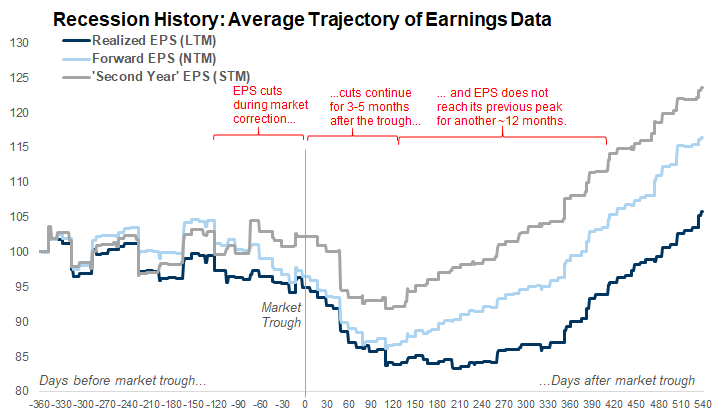
Exhibit 3: EM and the US have recovered faster from recessions than Europe (local currency terms)

3. EM and the US have recovered faster from recessions than Europe (local currency terms). Data available on request.
Source: FactSet, MSCI, I/B/E/S, Datastream, Goldman Sachs Global Investment Research
In looking at market performance through a similar lens, we find that "investment recovery" takes quite a long time as well, particularly equities, again with wide variation. EM credit, for example, recovered very quickly in total return terms after the GFC and the 2016 slowdown -- in part due to the structural decline in US interest rates. EM currencies (in total returns) have also recovered quicker than EM equities during previous bear markets given the supportive carry environment particularly of the past decade.
For the US, the correlation between EPS recovery and market performance recovery is quite closely linked. The two EPS recessions with "V-Shape" EPS recoveries (1998 and 2016) were met with very speedy S&P 500 performance recoveries, with the market making fresh highs within half a year. The other two episodes of much longer EPS recoveries (~30 months) resulted in longer market recovery cycles (~50 months).
In EM, there is less of a clear link here, probably because global conditions weigh on prices through risk premia. For example, MSCI EM took over 3 years to achieve fresh price highs during the 2002 cycle, even though the EPS recovery took just 6 months. This is probably due to a slower recovery in US earnings and prices (and perhaps global equity valuations were quite stretched coming into the early 2000s recessions). Conversely, following the 2016 EM recession, both market prices and EPS recovered over an 18-month period -- a long recovery cycle for EPS estimates, but a quick price recovery relative to history. This relatively quick snap-back in prices, however, was likely driven by supportive monetary policy globally and low interest rates.

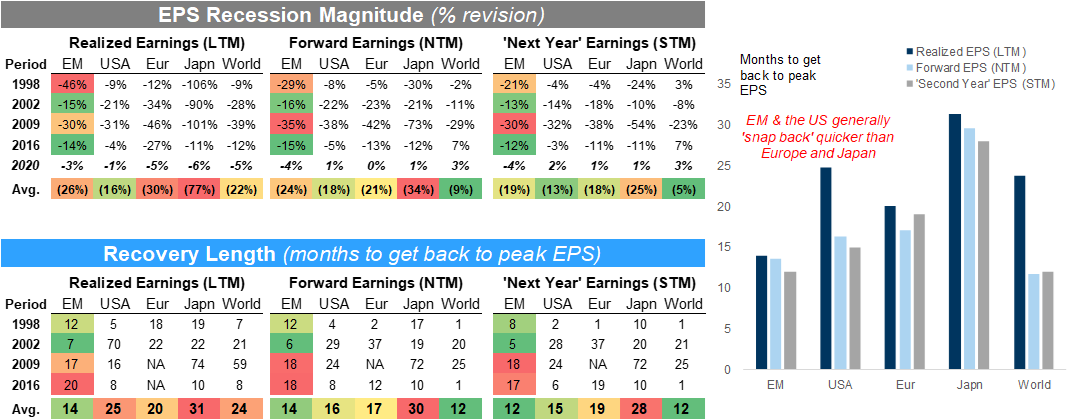
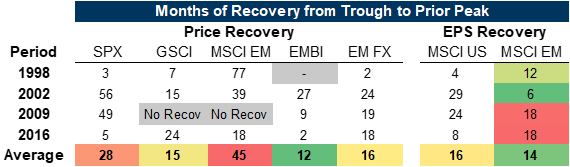
Exhibit 4: Market recoveries have taken longer than EPS

4. Market recoveries have taken longer than EPS. Data available on request.
Source: FactSet, I/B/E/S, Datastream, Goldman Sachs Global Investment Research

3. Four Recessions, Four Recovery Shapes: V, L, Short-Lived, Slow Grind

As mentioned above, two of EM's past EPS recessions have seen swift recoveries, whereas the other two took years for earnings to reach previous highs. Below, we highlight the 1990s and early 2000s cycle which saw quick EPS recoveries - though the drivers appear quite different.
Towards the end of the Asia Financial Crisis (AFC) of the late 1990s, corporate analysts were cutting 'front-end' EPS estimates aggressively - but kept longer-run estimates quite flat in terms of level. Specifically, during the first half of 1999, the current year forecasts were cut 14% but next year (2000) estimates were flat. This represents a "short-lived" recession, which the market could look through. As an important caveat, we note that bottom-up analyst estimates are almost always cut over time, when aggregate EPS estimates are flat, it often represents a positive surprise to the 'market consensus'. As we discuss further below, this episode may be the most relevant to the current environment, in which the market may focus on "second year" estimates much sooner than usual during the cycle.
In contrast, the early 2000s recession represents a more visible "V-shape" recovery. EPS recovered its previous peak in roughly 6 months, perhaps aided by the US economy (which bounced back quickly growing ~3% sequentially in the first half of 2002) and also large EMs that did not enter recession (Korea, India). There is some historical analogy in that the US recession occurred around an exogenous shock (the September 11th attacks), but of course the current shock appears more global in nature.

Exhibit 5: A quick earnings recovery can be optically driven by "writing off" one year, or by upgrades across the board (V-Shape)

5. A quick earnings recovery can be optically driven by "writing off" one year, or by upgrades across the board (V-Shape). Data available on request.
Source: FactSet, Datastream, I/B/E/S, Goldman Sachs Global Investment Research
The two longer-lived recoveries also have different trajectories. After the GFC, activity picked up meaningfully, and EPS revisions were consistently positively, but the depth of the GFC was so significant, it took years to recover. For context, forward EPS was cut 35% during the GFC compared with 15% during the 2016 EPS recession. Interestingly, the recovery time for both episodes was 18 months. Although the EPS cutting cycle ended in early 2016, a veritable upward revision cycle did not begin for almost 12 months, in 1Q 2017.

Exhibit 6: EPS recoveries from the last two recessions took 18 months

6. EPS recoveries from the last two recessions took 18 months. Data available on request.
Source: FactSet, Datastream, I/B/E/S, Goldman Sachs Global Investment Research
Looking at the current cycle, we find that both 2020 and 2021 estimates have been cut by a similar amount for the aggregate MSCI EM index. Going forward, we expect investors to focus heavily on the levels of 2021 estimates in order to gauge the potential 'snap back' of EM economies and appropriate market pricing therein.
However, there are important distinctions already observable at the market level: Brazil, Korea, and Hungary stand out as markets where 2021 estimates have been resilient relative to the meaningful 2020 downgrades. While there may be some rationale in this divergence (belief that DM economies have policy support and Korea, CE-3 may be positively exposed to that), we would flag these EPS forecasts as being particularly risky in the current environment relative to other EMs with similar macro exposures (Mexico, Taiwan) where 2021 downgrades are already in the forecasts.

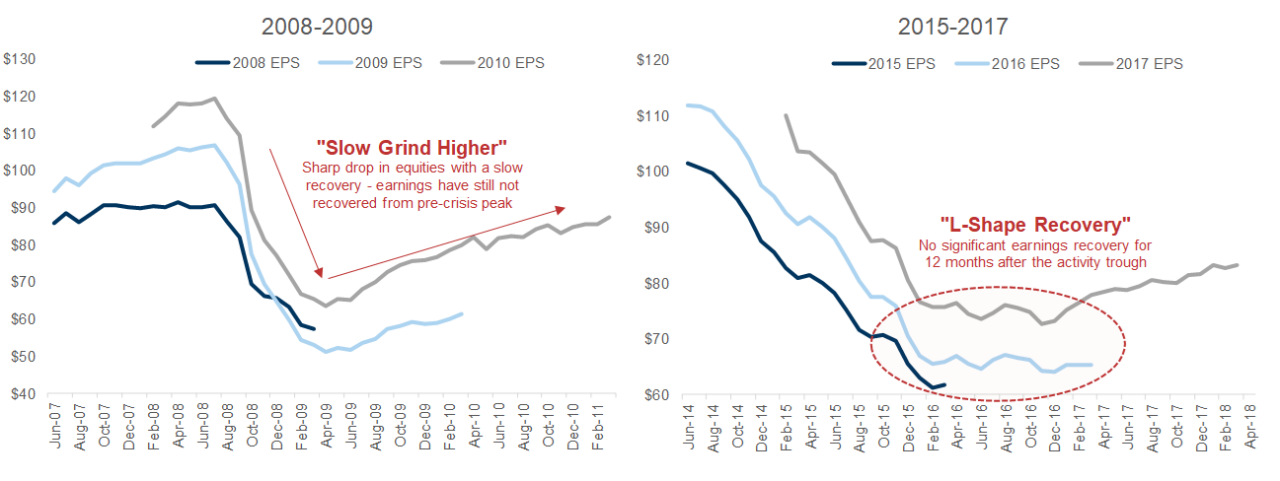
Exhibit 7: 2021 estimates look elevated in Brazil, Hungary, and Korea relative to the rest of EM

7. 2021 estimates look elevated in Brazil, Hungary, and Korea relative to the rest of EM. Data available on request.
Source: FactSet, Datastream, I/B/E/S, Goldman Sachs Global Investment Research

Investors should consider this report as only a single factor in making their investment decision. For Reg AC certification and other important disclosures, see the Disclosure Appendix, or go to www.gs.com/research/hedge.html.