Goldman Sachs Research
US Economics Analyst
Inflation Signal, Healthcare Noise (Hill)
21 February 2021 | 11:33PM EST | Research | Economics| By Jan Hatzius and others
More
  • Core PCE inflation remains on track for a dead cat bounce above 2% this spring as we lap the peak pandemic declines in 2020. We have long expected a brief jump above 2% this spring, and Fed officials have already signaled that they will look past it.

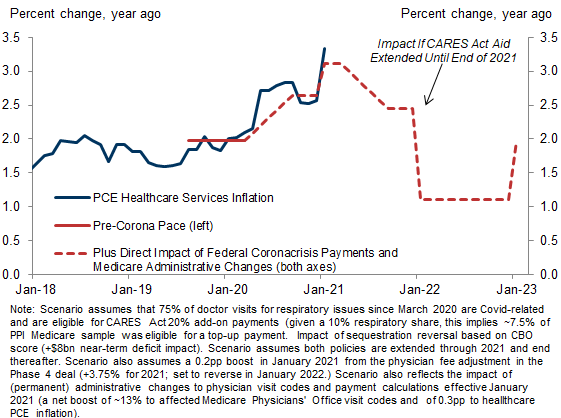
  • However, policy-related effects look likely to amplify the temporary boost from base effects, especially in the health care category that has been affected by recent Covid-relief legislation. We now expect the combination of base effects and policy effects to propel core PCE inflation up to 2.5% in April and to keep it above 2% even at year-end. However, we forecast payback from the expiration of these policies will culminate in a sudden 25bp drop in early 2022.

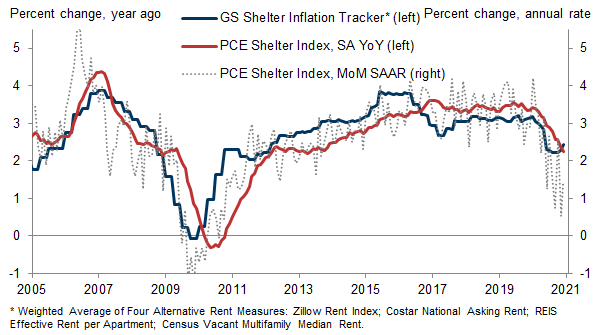
  • The other key to the outlook is shelter inflation. The shelter category is highly cyclical and it is not surprising that it has decelerated substantially, but this cycle has added unique pandemic-related effects to the usual cyclical factors.

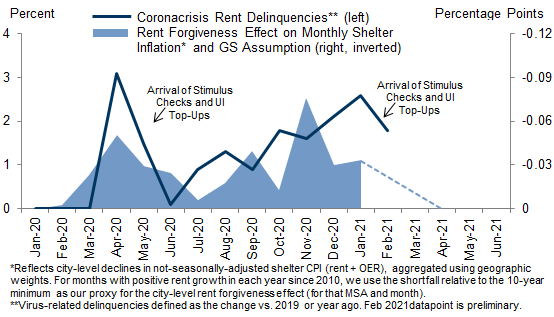
  • Two major pandemic effects are currently depressing shelter inflation but should raise it next year. First, flight from crowded urban apartment units is having an outsized impact on measured shelter prices, as they are overrepresented in the CPI shelter sample. Second, rent forgiveness has risen due to challenges in making rent payments and eviction moratoriums. Each factor appears to be depressing shelter inflation by 0.3pp. We expect shelter to decelerate further from 2% to a bottom of 1.6% at mid-year, but to then accelerate quickly to 2.2% at end-2021 and 3.4% at end-2022 as these pandemic effects fade and the labor market strengthens.

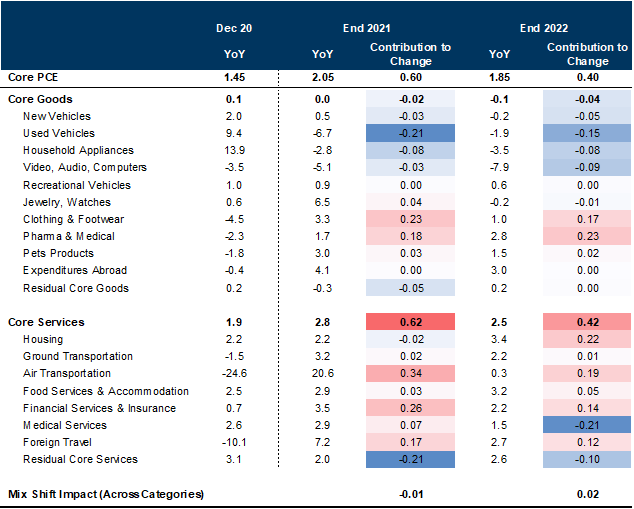
  • For core PCE inflation itself, we forecast a rise from 1.7% in January to a peak of 2.5% in April—exactly a year after the strictest lockdowns. But with healthcare policy swinging from a boost to a drag, we then forecast core inflation to fall back to 2.05% by year-end 2021 and to drop off sharply in early 2022. We forecast core inflation to end 2022 at 1.85% as the healthcare drag offsets tightening labor and rental markets, with the pace converging back toward 2% by early 2023.

  • Stepping back, the inflation volatility associated with so many idiosyncratic factors and measurement issues underscores the importance of monitoring underlying inflation measures—and of assessing evidence of overheating in the labor and product markets themselves.

Inflation Signal, Healthcare Noise

Given their large weights and relative persistence, the shelter and healthcare PCE price components are critical in the Fed’s quest to raise the average pace of inflation to 2%. But these pivotal categories are by no means free of the idiosyncratic factors or methodological nuances that have surprised policymakers and market participants alike in recent years. In this week’s Analyst, we review the outlook for core inflation with special attention to these categories.

Urban Flight and the Missing Shelter Inflation

Home prices are rising at their fastest pace since 2013 but shelter inflation is low and falling (see Exhibit 1). Should we expect higher home prices, significant fiscal support, and a quick economic recovery to also produce above-trend rent growth? Or has the coronacrisis led to a more persistent divergence as households abandon crowded apartments in favor of single-family homes? [1]

Exhibit 1: Home Price Growth and Shelter Inflation Have Diverged

1. Home Price Growth and Shelter Inflation Have Diverged. Data available on request.
Source: Haver, Goldman Sachs Global Investment Research
In addition to the higher unemployment and rental payment delinquencies typical of recessions, the coronacrisis has catalyzed urban flight—the relocation of households away from densely populated areas to the suburbs and low-density residential neighborhoods. Some estimates pin the scale of departures at 15-20% in high-income urban areas like Manhattan and San Francisco. The decomposition of Census vacancy rates is also consistent with urban flight, with vacancy rates rising in central cities (+0.3pp on average) but falling in suburbia, smaller towns, and rural areas (both - 0.3pp). These figures probably understate urban flight, because not all urban move-outs have resulted in lease termination.
Demand for single-family housing has been a clear beneficiary, particularly in the suburbs. As our credit strategists note, for-sale inventory has fallen to multi-decade lows, and the supply-demand mismatch has boosted house price appreciation to levels last seen a decade ago. Home viewings are also growing faster in suburban and rural locations.
For those remaining in the cities, the recession and its disproportionate impact on lower-income wage earners in the leisure, hospitality, and retail sectors have diminished the ability to afford existing housing for some of the hardest hit households. The resulting rise in rent non-payment, coupled with eviction moratoriums enforced in most cities, has convinced some landlords to forgive rent entirely for some tenants. As discussed in more detail here, we estimate the direct effect of rent forgiveness on year-on-year shelter inflation at -0.35pp in January 2021 (the sum of the estimated monthly effects in Exhibit 2). While a contributing factor, this would only explain a quarter of the drop in shelter inflation (and around a sixth of the disconnect relative to the current pace of home price growth).

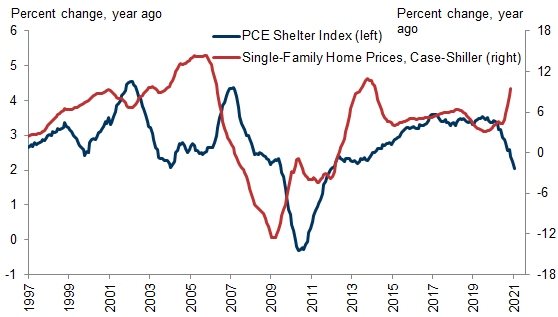
Exhibit 2: We Expect a Waning Impact of Rent Forgiveness Due to Fiscal Stimulus and Labor Market Improvement

2. We Expect a Waning Impact of Rent Forgiveness Due to Fiscal Stimulus and Labor Market Improvement. Data available on request.
Source: Haver, Goldman Sachs Global Investment Research
We expect a waning drag from rent forgiveness going forward, mirroring the months after the CARES Act stimulus checks and unemployment insurance top-ups. The impact of those programs and other policies is visible in the sharp improvement in rental payment delinquencies in May and June 2020 (see dark blue line in the same Exhibit). Given our expectation for continued fiscal support and accelerating job growth this summer, we do not assume significant instances of rent forgiveness in our baseline forecast after Q1 of this year.[2]
This inflation headwind will eventually reverse, as the price of some housing units returns to near-normal levels (after being entered by the CPI data collectors at $0 during the crisis). In our baseline, we assume half of rent forgiveness reverses during 2H21/1H22, with the other half on net replaced by lease-renewal concession and associated rent declines. This reversal—households resuming paying normal rent on units they paid $0 for last year—would boost year-on-year shelter inflation in 2022 by 0.15pp on average, adding to the upward pressure we expect from an improving labor market.
We also expect fiscal easing and strong 2021 job growth to restrain the increase in rental vacancies in the wake of the recession. Specifically, we assume a 1.0pp increase in the rental vacancy rate to 7.5% in late 2021 (on the Census measure, up from 6.4% in 4Q19).[3] Such a rise would be somewhat smaller than industry forecasts (+1.5pp cumulatively, according to Costar) and would imply around half of the coronacrisis rental delinquencies in early 2020 result in lease termination, on net.

Which Housing Market Matters for Shelter Inflation?

If official measures of shelter inflation were perfectly representative of the housing market, then we shouldn’t expect intramarket demand shifts like urban flight to affect the inflation numbers. But the CPI and PCE shelter indices are instead produced from a representative sample of rented housing units—specifically those in urban areas. Reflecting this, the sample is heavily skewed towards the multi-family segment at roughly three quarters of the sample.[4] This compares to one fifth of the actual housing stock, per NIPA data (see Exhibit 3; single family units also tend to be larger and more expensive on average). Another increasingly important characteristic of the CPI shelter sample is its skew towards the center city—reflecting the skew in the rental market itself.

Exhibit 3: CPI Shelter Sample Skewed Towards Apartments in Urban Areas

3. CPI Shelter Sample Skewed Towards Apartments in Urban Areas. Data available on request.
Source: Census Bureau, Goldman Sachs Global Investment Research
Perhaps unsurprisingly, we find that rent inflation is currently much weaker in more populated and denser zip codes. Using Zillow rent data at the zip code level, we decompose rent growth across different population densities.[5] As shown in Exhibit 4, rent growth is significantly underperforming in downtown and center city zip codes: +0.8% year-on-year on a household-weighted basis, compared to +5.2% for suburban and residential areas. Rent growth is even weaker in the highest-density zip codes: those with densities above 10,000 people per square mile (8% of the US population) show rent declines of 4.2% in the Zillow data.

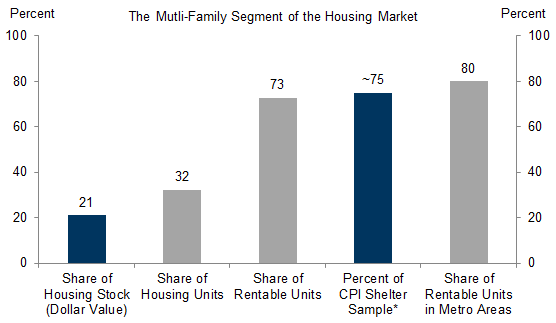
Exhibit 4: Urban Flight Weighing Down Urban and Downtown Rents
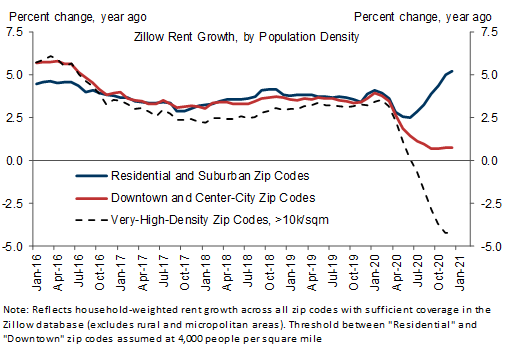
4. Urban Flight Weighing Down Urban and Downtown Rents. Data available on request.
Source: Zillow, Goldman Sachs Global Investment Research
The PCE price statistics are not available by geography, but the granularity that is available in the CPI is also consistent with a drag from urban flight, with shelter inflation in the New York (+0.8% yoy) and San Francisco (+0.9%) MSAs at roughly half the pace of the nationwide measure (+1.6%). Large cities (Class A, +1.3%) are also underperforming mid-size cities (Class B and C, +1.9%).
To estimate the impact of this intramarket demand shift on measured shelter inflation, we first adjust the volatility of the Zillow data to match that of the CPI shelter measures. We then multiply the underperformance in center-city zip codes in the Zillow data by the excess weight of the CPI sample in center-city neighborhoods (50% vs. 33% for the US housing stock). On this basis, we estimate a -0.3pp impact on year-on-year shelter inflation.[6] This -0.3pp estimate reflects only the interaction between urban flight and the CPI sample, and does not include run-of-the-mill recession effects, or the disconnect between homeowner costs and tenant rent payments.

Rockin' the Suburbs

We expect a waning drag from urban flight on shelter inflation by next year. However, we don’t expect upward pressure from this channel (relative to the pre-crisis period), because we believe it is the level of rental vacancies that is the primary determinant of shelter inflation. We also expect at least some of the suburban relocation to prove permanent.[7] The advent of work from home[8] and the fact that second homes represent less than a third of 2020 home sales growth suggest it could take several years for urban vacancy rates to normalize—even with the relatively quick return to full employment that we forecast.
Incorporating the drag from urban flight and rent forgiveness effects on top of our standard model, we forecast a modest further decline in PCE shelter inflation from 2.05% year-on-year in January (GS tracking estimate) that bottoms out at around 1.6% in the middle of the year. This would undershoot our shelter tracker—which is showing tentative signs of stabilization, see Exhibit 5—by roughly half a point due to rent-forgiveness effects. From there, we expect shelter inflation to rebound to 2.2% by year-end 2021 and to pick up to 3.4% at end-2022, as labor and rental markets tighten and the rent forgiveness drag swings to a boost.

Exhibit 5: Tentative Stabilization in GS Shelter Tracker

5. Tentative Stabilization in GS Shelter Tracker. Data available on request.
Source: Department of Commerce, Census Bureau, Costar, Zillow, REIS, Goldman Sachs Global Investment Research

Healthcare Policy Effects

On top of the effects of eviction moratoriums and urban flight on shelter inflation, a slew of current and future policy changes are set to induce core PCE volatility. As discussed in more detail here, here, and here, healthcare policy is front and center, with the January PPI report underscoring the potential importance of regulatory and legislative changes. In addition to the higher Medicare payments to physicians’ offices legislated in the Phase 4 bill—worth just under +0.2pp on the year-on-year rate for the PCE measure and currently scheduled to expire at year-end—a set of administrative reclassifications were implemented to the Medicare fee schedules. These reclassifications—and the revised reimbursement rates associated with them—on net increased the price per unit of healthcare services, boosting January healthcare PCE inflation by 0.3pp, on our estimates.[9] Exhibit 6 summarizes the estimated impact of these (and other) healthcare policy changes.

Exhibit 6: Healthcare Policy Changes Are Boosting PCE Healthcare Inflation by Over 1pp but Will Swing to a Drag in 2022

6. Healthcare Policy Changes Are Boosting PCE Healthcare Inflation by Over 1pp but Will Swing to a Drag in 2022. Data available on request.
Source: Haver, Goldman Sachs Global Investment Research
On our estimates, the policy effects combine to produce a peak-to-trough swing of 2.0pp for PCE healthcare inflation (or -0.35pp on the overall core PCE measure). Coupled with a benign cost environment for the industry in 2021-22, we forecast PCE healthcare inflation to decline from 3.35% year-on-year in January (GS tracking estimate based on BLS source data) to 2.9% by the middle of the year and also at year-end. We then expect a sudden decline to around 1% in early 2021 as key coronacrisis provisions expire, followed by a gradual pickup to 1.5% by end-2022 and 2.25-2.5% in early 2023. These effects will also contribute to a smaller-than-normal PCE-CPI inflation gap this year and a larger-than-normal one in 2022.

Above-Target Inflation (But Don't Get Used to It)

Exhibit 7 summarizes the estimated inflation effects of key policy changes in 2020-22. In addition to the healthcare policy and rent forgiveness effects, we believe increased federal aid for college tuition will weigh on education inflation this year and the next. We also note the possibility of disinflationary tariff rollback in 2022 and 2023; however the timing and magnitude are highly uncertain at this point. Summing across these effects yields an estimated 0.1pp boost to core inflation in January 2021 (yoy) that fades in the spring as CARES Act support to the healthcare industry falls out of the year-on-year calculation.[10]

Exhibit 7: Policy Effects Will Cause a Roughly -25bp Swing in Core PCE Inflation at the Start of 2022

7. Policy Effects Will Cause a Roughly -25bp Swing in Core PCE Inflation at the Start of 2022. Data available on request.
Source: Goldman Sachs Global Investment Research
The most significant policy inflection is set for early 2022, when many of the healthcare price increases catalyzed by the pandemic will reverse (barring additional legislative changes). Despite an offsetting boost from normalizing rent prices at that horizon, we forecast policy effects to become a sizeable drag on core PCE inflation at the start of 2022 and throughout the year, with our -0.2pp baseline estimate large enough to prevent inflation from rising back above 2% until 2023.
In our view, the inflation volatility associated with so many idiosyncratic factors and measurement issues underscores the importance of monitoring underlying inflation measures, such as the Dallas Fed trimmed mean PCE and our GS Core Inflation Tracker. And because the large weights on shelter and healthcare could muddle the signal from these gauges too, we believe assessing the labor and product markets themselves for signs of overheating will also be particularly important in the coming years.
In Exhibit 8, we update the remaining components of our bottom-up core PCE model. By component, we expect the reopening of the economy and the success of mass vaccination to result in higher demand and prices in the most virus-affected categories. These include recreation, lodging, apparel, and airfares—the latter of which should also get a boost from higher oil prices. Higher stock prices and bond yields are also set to boost financial services inflation, though we continue to expect downward pressure on retail brokerage commissions.
However, pandemic effects on inflation run in both directions. On the negative side, we believe the relative demand shift towards private transportation has probably run its course, with the worst of the pandemic likely behind us. This implies downward price pressure on new and used car prices.

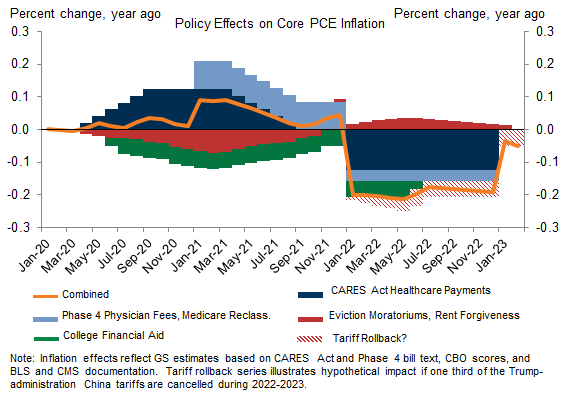
Exhibit 8: Our Bottom-Up Model Projects Core PCE Inflation of 2.05% at End-2021 and 1.85% at End-2022

8. Our Bottom-Up Model Projects Core PCE Inflation of 2.05% at End-2021 and 1.85% at End-2022. Data available on request.
Source: Goldman Sachs Global Investment Research
Based on PPI and CPI source data, we estimate core PCE inflation rose from 1.45% in December to 1.69% in January. From there, we continue to expect an overshoot in the middle of the year, with core inflation peaking at 2.5% in April—exactly a year after the strictest lockdowns. However, we forecast a decline back to 2.05% by year-end, as the fading healthcare policy boost coupled with base effects more than offset the impact of the economy reopening. We forecast the reversal of emergency healthcare aid to weigh on core inflation in 2022, with inflation ending that year at 1.85% despite tightening labor and rental markets. As Exhibit 7 shows, the payback for the policy effects should disappear abruptly at the start of 2023, causing a quick rebound to about 2% at the start of 2023.

Spencer Hill

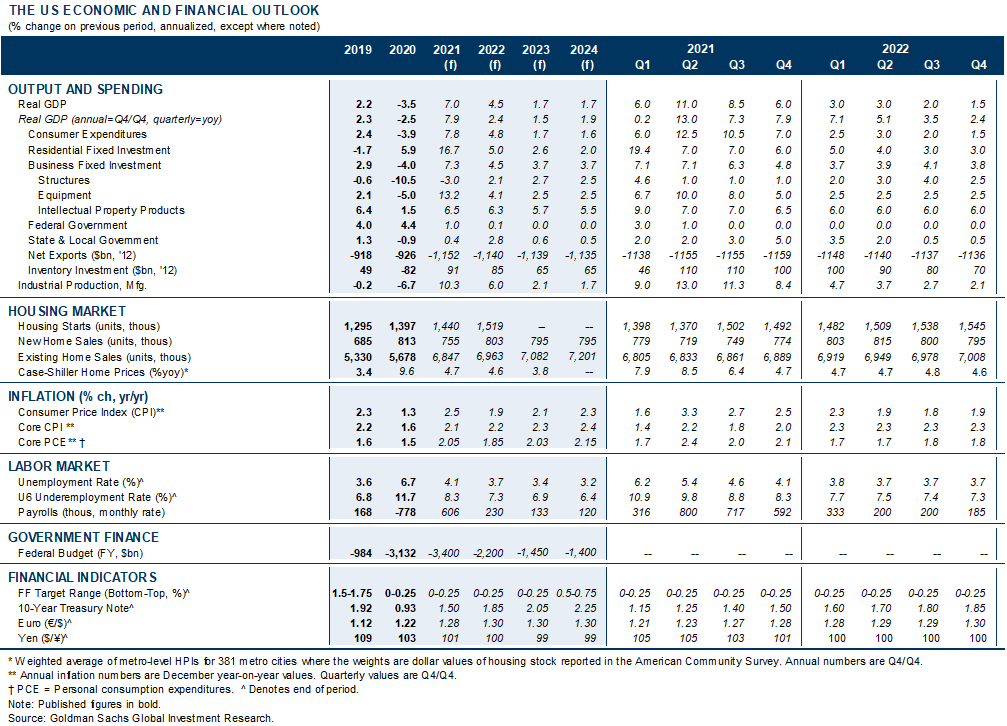
The US Economic and Financial Outlook
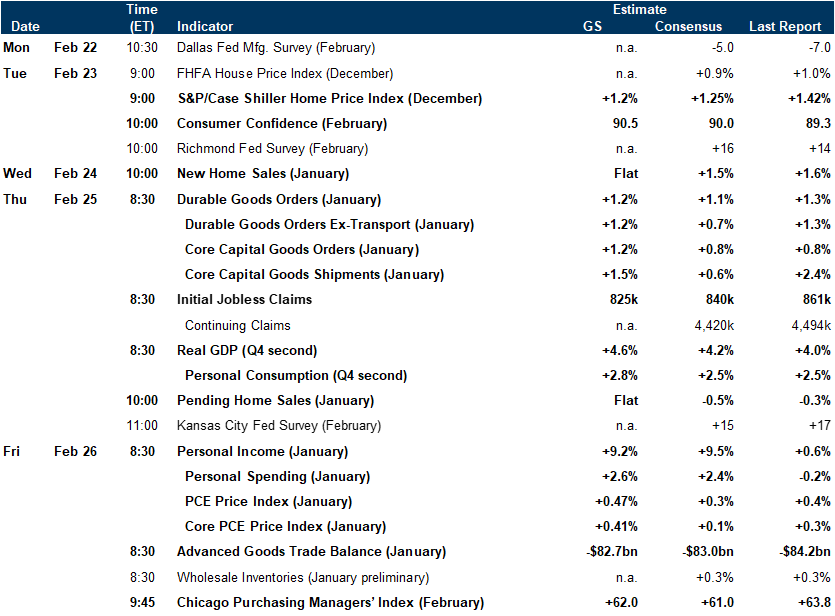
Data available on request.
Source: Goldman Sachs Global Investment Research

Economic Releases

Data available on request.
Source: Goldman Sachs Global Investment Research
  1. 1 ^ Historical relationships suggest the 5.2pp acceleration in home prices since the start of the coronacrisis would boost shelter inflation in 2020 and 2021, with a peak impact of around +0.5pp.
  2. 2 ^ We also do not believe the BLS will treat federal rental assistance programs as a discount relevant for the CPI shelter index, because the BLS collects information only about payments directly from the tenant to the owner/landlord.
  3. 3 ^ REIS and Costar vacancy rate measures have already risen 0.5pp and 0.4pp respectively.
  4. 4 ^ On our estimates based on the American Community Survey, the Housing Vacancy Survey, and the residential capital stock data from the National Income and Product Accounts (NIPA).
  5. 5 ^ Zillow rent indices are already constructed to be representative of the rental market
  6. 6 ^ Once the Zillow trends are fully reflected in the CPI data, which we expect by mid-year given the typical leading relationship.
  7. 7 ^ Put another way, urban flight is a flow effect, whereas vacancies are a stock measure.
  8. 8 ^ The Survey of Business Uncertainty suggests that employers expect that work-from-home will roughly triple in the post-pandemic economy,
  9. 9 ^ Paid by governments to healthcare providers, on a dollar-weighted basis. Specifically, CMS revised the pricing of some medical treatments in order to more accurately reflect physician time and operating costs. While some quantities were revised as well (e.g. time spent), the impact from an inflation perspective is a net increase in measured healthcare prices. These changes are not related to the pandemic.
  10. 10 ^ We don’t expect this headwind to prevent core inflation from rising further at this horizon (due to reopening and the anniversary of the depressed prices of the spring 2020 lockdowns). But the waning policy boost increases the likelihood that core PCE inflation falls back below 2% in the fall.

Investors should consider this report as only a single factor in making their investment decision. For Reg AC certification and other important disclosures, see the Disclosure Appendix, or go to www.gs.com/research/hedge.html.