Goldman Sachs Research
US Economics Analyst
Housing on Fire (Walker)
2 May 2021 | 8:59PM EDT | Research | Economics| By Jan Hatzius and others
More
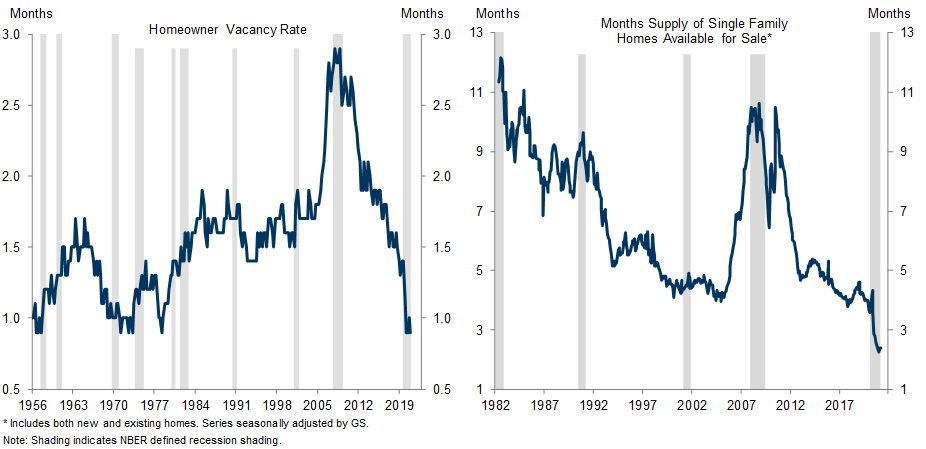
  • The US housing sector is on fire. New home sales and housing starts both reached their highest levels since 2006 in March, and red-hot demand has brought the supply of homes available for sale down to the lowest level since the 1970s. Competition among buyers for a dwindling national housing supply has sent prices 12% higher over the last year, but so far this has done little to reduce the severe imbalance between supply and demand in the housing market.

  • Strong demand for housing looks sustainable. Even before the pandemic, demographic tailwinds and historically-low mortgage rates had pushed demand to high levels. A shift in preferences during the pandemic caused demand to spike, and consumer surveys indicate that household buying intentions are now the highest in 20 years. This is especially impressive because unlike in the mid-2000s, mortgage lending standards have remained fairly tight. With demographic trends still strong, mortgage rates very low, housing affordability still high, and household wealth as a share of income at the highest level in US history, demand should remain strong.

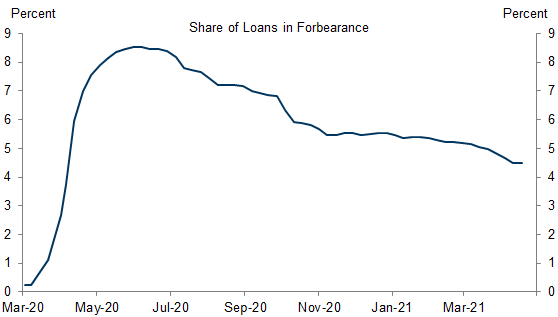
  • The supply picture offers no quick fixes to the shortage of available homes. Homebuilders are again facing headwinds that were already present before the pandemic, especially a lack of available plots to build on and a lack of construction workers. These constraints are likely to limit the pace of annual homebuilding to around 1.5mn in coming years. The expiration of pandemic-related forbearance provisions later this year should put some additional homes on the market, but this will only modestly alleviate the lack of supply.

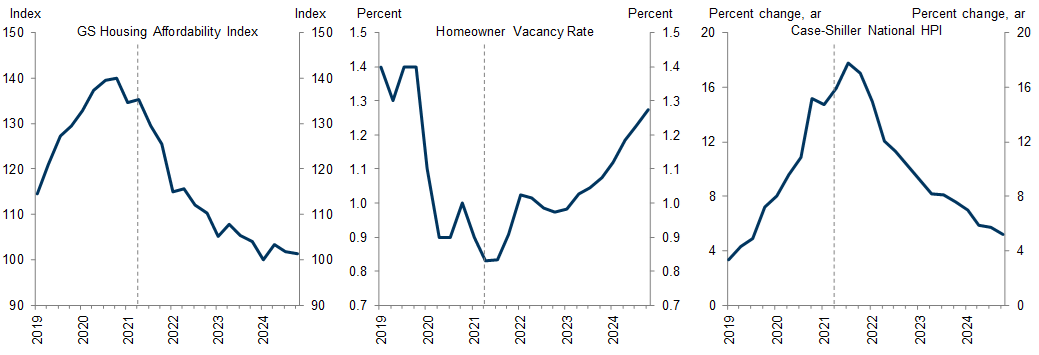
  • The resulting picture is one of a persistent supply-demand imbalance in the years ahead. To forecast what this means for home prices, we estimate a model that jointly considers supply, demand, affordability, and home prices. The model suggests that rising prices will only gradually reduce affordability enough to dampen demand and mitigate the supply-demand imbalance. As a result, the model projects double-digit price gains both this year and next.

  • House price growth does not directly enter the inflation statistics, but it does spill over to rent inflation, as economic intuition would suggest. This is one reason we expect an acceleration in the shelter category this year and next to provide a meaningful boost to core inflation.

Housing on Fire

After slowing in the early months of the pandemic, the US housing sector has boomed. New home sales reached the highest level since 2006 in March (Exhibit 1) and existing home sales have exceeded the prior cycle’s high in each month since July.

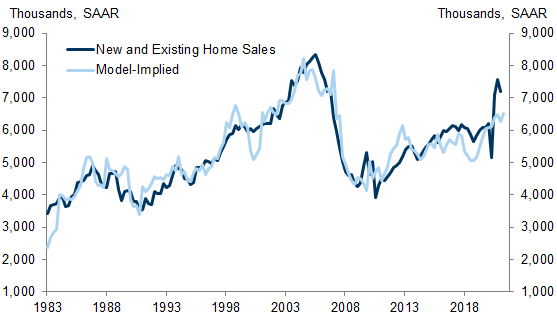
Exhibit 1: New Home Sales Have Risen to the Highest Level Since 2006

1. New Home Sales Have Risen to the Highest Level Since 2006. Data available on request.
Source: Department of Commerce, Goldman Sachs Global Investment Research
That surge in demand has dramatically reduced the supply of homes available for sale. The homeowner vacancy rate — which measures the share of housing units that are not currently being lived in full-time — is at the lowest level since 1978 and equal to the lowest level in the measure’s 65-year history (Exhibit 2, left).[1] The months’ supply of new- and existing- single family homes available for sale — the number of months that it would take for the current inventory of houses on the market to sell at the current sales pace — is at the lowest level on record (Exhibit 2, right).

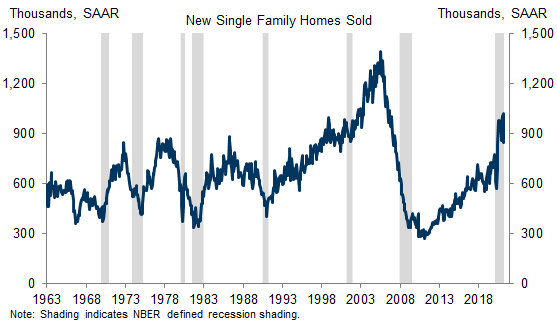
Exhibit 2: Booming Demand Has Reduced the Supply of Homes to the Lowest Level Since the 1970s

2. Booming Demand Has Reduced the Supply of Homes to the Lowest Level Since the 1970s. Data available on request.
Source: Department of Commerce, National Association of Realtors (NAR), Goldman Sachs Global Investment Research
Competition among buyers for a dwindling national housing supply is intense: new homes are being purchased earlier in the development process and newly listed existing homes are being purchased in record time. This competition has sent home prices 12% higher over the last year, but so far this has done little to reduce the severe imbalance between supply and demand.
In this week’s Analyst, we assess the outlook for the housing market. We first take an in-depth look at the drivers of strong demand and the reasons that homebuilders are struggling to keep up. We then estimate a model that jointly considers supply, demand, and evolving affordability to project where home prices are headed from here.

The Demand Picture: Sustainable Strength

The Conference Board’s consumer survey indicates that household buying intentions are now the highest in 20 years (Exhibit 3). Part of the increase in demand appears to pandemic-related; we previously noted that the pandemic accelerated the housing search of potential homebuyers, and demand for second homes has increased significantly over the last year.

Exhibit 3: Survey-Based Measures of Housing Demand Are at the Highest Level in 20 Years

3. Survey-Based Measures of Housing Demand Are at the Highest Level in 20 Years. Data available on request.
Source: The Conference Board, Goldman Sachs Global Investment Research
But even aside from the pandemic boost, the fundamentals that tend to drive housing demand are strong and appear sustainable for two reasons.
First, the ongoing shift of the millennial cohort — now the largest age group in the US — into the age range where household formation and home buying tend to peak had already started to boost owner-occupied housing demand before the pandemic. Much of the millennial boost is still ahead of us because homeownership rates rise rapidly around age 30.
To estimate how demographic change will affect the rate of household formation in the years ahead, we combine our projections of headship rates (the share of people who are heads of a household) by age group with Census projections of population growth by age group. This approach yields an estimated rate of household formation of 1.3mn per year for the next few years, modestly higher than the recent trend (Exhibit 4).[2]

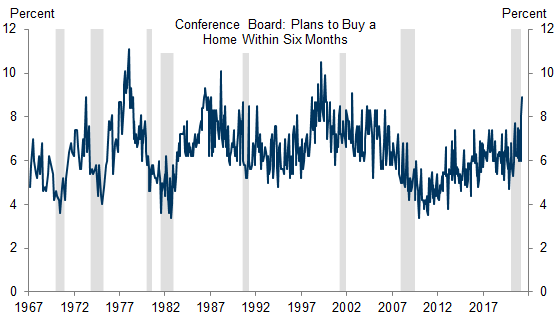
Exhibit 4: Demographic Trends Imply 1.3mn New Households Per Year

4. Demographic Trends Imply 1.3mn New Households Per Year. Data available on request.
Source: Haver Analytics, Goldman Sachs Global Investment Research
Second, housing in the US remains affordable relative to historical standards. Our credit strategists’ Housing Affordability Index[3] (HAI) measures the ability of a typical household to pay for a 30-year fixed rate mortgage loan on a typically-priced home based on the most recent house price and income data (Exhibit 5). Home prices have increased significantly over the last year and mortgage rates have recently edged up, which has caused the HAI to decline, indicating that housing is less affordable. But the HAI has only declined to roughly the pre-pandemic level and remains well above pre-2010 levels, as rates are still low on an absolute basis and household incomes have remained largely intact.

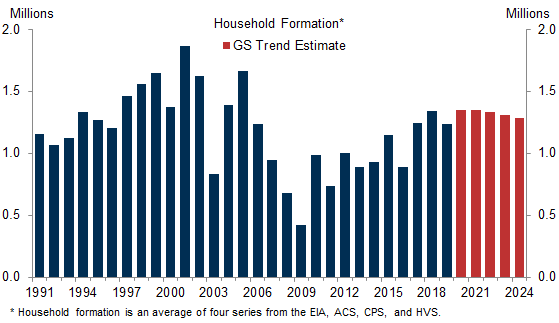
Exhibit 5: Despite Recent Price Increases, Low Rates Have Kept Housing Affordable by Historical Standards

5. Despite Recent Price Increases, Low Rates Have Kept Housing Affordable by Historical Standards. Data available on request.
Source: Goldman Sachs Global Investment Research
To estimate how strong demand is likely to be even if the pandemic boost begins to fade, we first model total sales of new and existing homes in excess of demographic-implied household formation. We model these “excess sales” using the GS HAI, forward-looking measures of housing demand from consumer surveys, and credit availability. We then add back in our estimates of household formation based on demographic trends to arrive at a forecast for total housing demand. Those two factors imply that new and existing home sales should currently total roughly 6.5mn on an annualized basis (Exhibit 6). This suggests that while pandemic preference shifts are providing a boost,[4] underlying demand is very strong and solidly above levels seen last cycle.

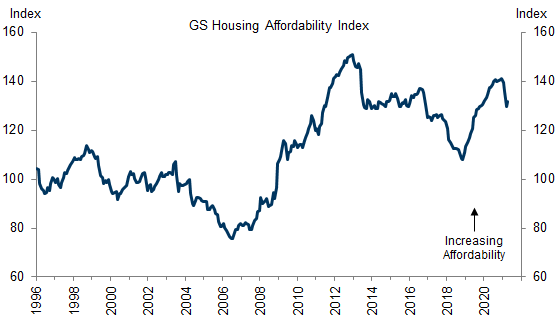
Exhibit 6: Our Model Based on Demographics, Affordability, and Credit Availability Suggests That Housing Demand Will Remain Strong

6. Our Model Based on Demographics, Affordability, and Credit Availability Suggests That Housing Demand Will Remain Strong. Data available on request.
Source: Department of Commerce, National Association of Realtors (NAR), Goldman Sachs Global Investment Research

The Supply Picture: No Quick Fixes to the Housing Shortage

The supply picture offers no quick fixes to the shortage of available homes shown in Exhibit 2.
Homebuilders are again facing headwinds that were already present before the pandemic, especially a lack of construction workers and a lack of available plots to build on.
Homebuilders have faced a shortage of labor for several years, especially for the most-skilled workers. Heading into the pandemic recession, the construction industry labor market was very tight, even compared to the tight overall labor market, and the job openings rate was much higher than during the mid-2000s construction boom (Exhibit 7, left). With labor scarce over the last few years, homebuilders have struggled to find workers to keep pace with surging demand.
Rising land costs and an overall scarcity of buildable land present another significant headwind. Regulatory requirements and related costs have trended upwards for decades, increasing the time required to secure permits. Past the permitting stage, the time to completion has also risen for several years (Exhibit 7, right), with homebuilders increasingly citing both these rising costs and the long delays between land acquisition and final home sales as an obstacle to building. The pandemic has likely caused even further delays in the form of supply chain disruptions, lumber and labor shortages, and enhanced safety protocols in place for construction workers due to the virus.
These constraints are likely to limit the pace of annual homebuilding to around 1.5mn in coming years. Subtracting roughly 250k demolitions per year implies a trend level of new housing supply of 1.2-1.3mn units per year.

Exhibit 7: Homebuilders Are Constrained by the Lack of Available Labor and Land

7. Homebuilders Are Constrained by the Lack of Available Labor and Land. Data available on request.
Source: Department of Labor, Department of Commerce, Goldman Sachs Global Investment Research
The expiration of pandemic-related forbearance provisions later this year should put some additional homes on the market, but this will only modestly alleviate the lack of supply. 4.5% of the roughly 45mn mortgages in the US are currently in forbearance (Exhibit 8). However, it is unlikely that the majority of those mortgages will enter foreclosure because the substantial improvement in the labor market we expect in coming months should increase households’ ability to resume mortgage payments. Starting in the second half of this year, we assume that 600k housing units — one-third of those currently in forbearance — will gradually be added to the supply of existing homes, which includes both homes undergoing foreclosure and people choosing to sell their homes because they are unable to make payments.

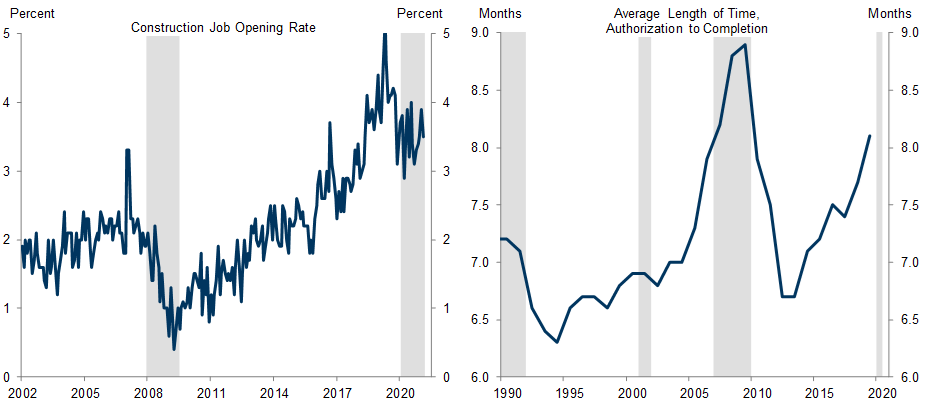
Exhibit 8: Foreclosures Following the Expiration of Pandemic-Related Forbearance Should Provide a Modest Boost to the Supply of Homes for Sale

8. Foreclosures Following the Expiration of Pandemic-Related Forbearance Should Provide a Modest Boost to the Supply of Homes for Sale. Data available on request.
Source: MBA, Goldman Sachs Global Investment Research

Home Prices: A Multi-Year Boom

The resulting picture is one of a persistent supply-demand imbalance in the years ahead. To see what this means for home prices, we build a model of home prices that consists of the prior quarter value of the GS HAI, the homeowner vacancy rate, months’ supply of available homes for sale, consumer survey questions on housing demand and inflation expectations, and credit availability[5] (Exhibit 9). The model’s Q1 signal is consistent with the current pace of home price appreciation (+16% QoQ ar), reflecting well-above average contributions from the historically-low supply measures in the prior quarter.

Exhibit 9: Our Home Price Model Accounts for Supply, Demand, and Affordability

9. Our Home Price Model Accounts for Supply, Demand, and Affordability. Data available on request.
Source: Standard and Poor's, Goldman Sachs Global Investment Research
To get forecasts from our home price and demand models, we estimate both models simultaneously while also keeping track of implied changes to the HAI and housing supply variables. When projecting the HAI, we assume that mortgage rates increase over the next few years — in line with our strategists’ forecasts — and that income growth improves in line with our economic forecast.[6]
The exercise suggests that rising prices will only gradually reduce affordability (Exhibit 10, left). That in turn reduces demand, which slowly boosts the supply of available housing as the rate of housing completions remains steady and new listings of existing homes recover to the pre-pandemic trend (Exhibit 10, middle). That dynamic eventually mitigates the supply-demand imbalance and reduces price pressures, but not before—the model projects—home prices grow at double-digit rates both this year and next (Exhibit 10, right).

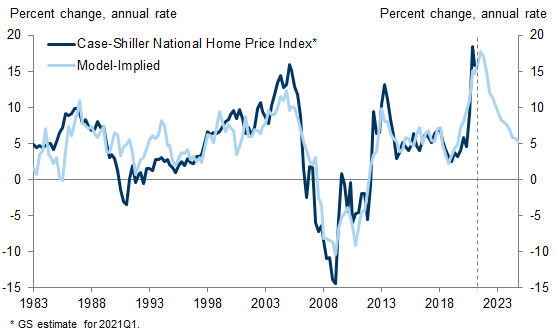
Exhibit 10: Higher Prices Will Only Gradually Reduce Affordability Enough to Dampen Demand and Reduce the Supply-Demand Imbalance in the Housing Market

10. Higher Prices Will Only Gradually Reduce Affordability Enough to Dampen Demand and Reduce the Supply-Demand Imbalance in the Housing Market. Data available on request.
Source: Goldman Sachs Global Investment Research
There is certainly some uncertainty around our assumptions. For example, housing supply could grow more quickly if homebuilders find ways around building constraints or if there are more foreclosures than we expect following the end of pandemic-related forbearance. Those scenarios would alleviate some of the prices pressures. Cutting in the other direction, President Biden has previously supported lifting the cap on deductions for state and local taxes and a tax credit for first-time homebuyers. If implemented, those types of proposals could boost housing demand and increase price pressures, although we previously found only a small impact of the dilution of tax incentives by the TCJA on both home prices and homeownership.
What does rapid home price appreciation mean for measured inflation? Home price growth does not directly enter the official inflation statistics, but it does spill over to rent inflation.[7] This is one reason we expect an acceleration in the shelter category this year and next to provide a meaningful boost to core inflation.

Ronnie Walker

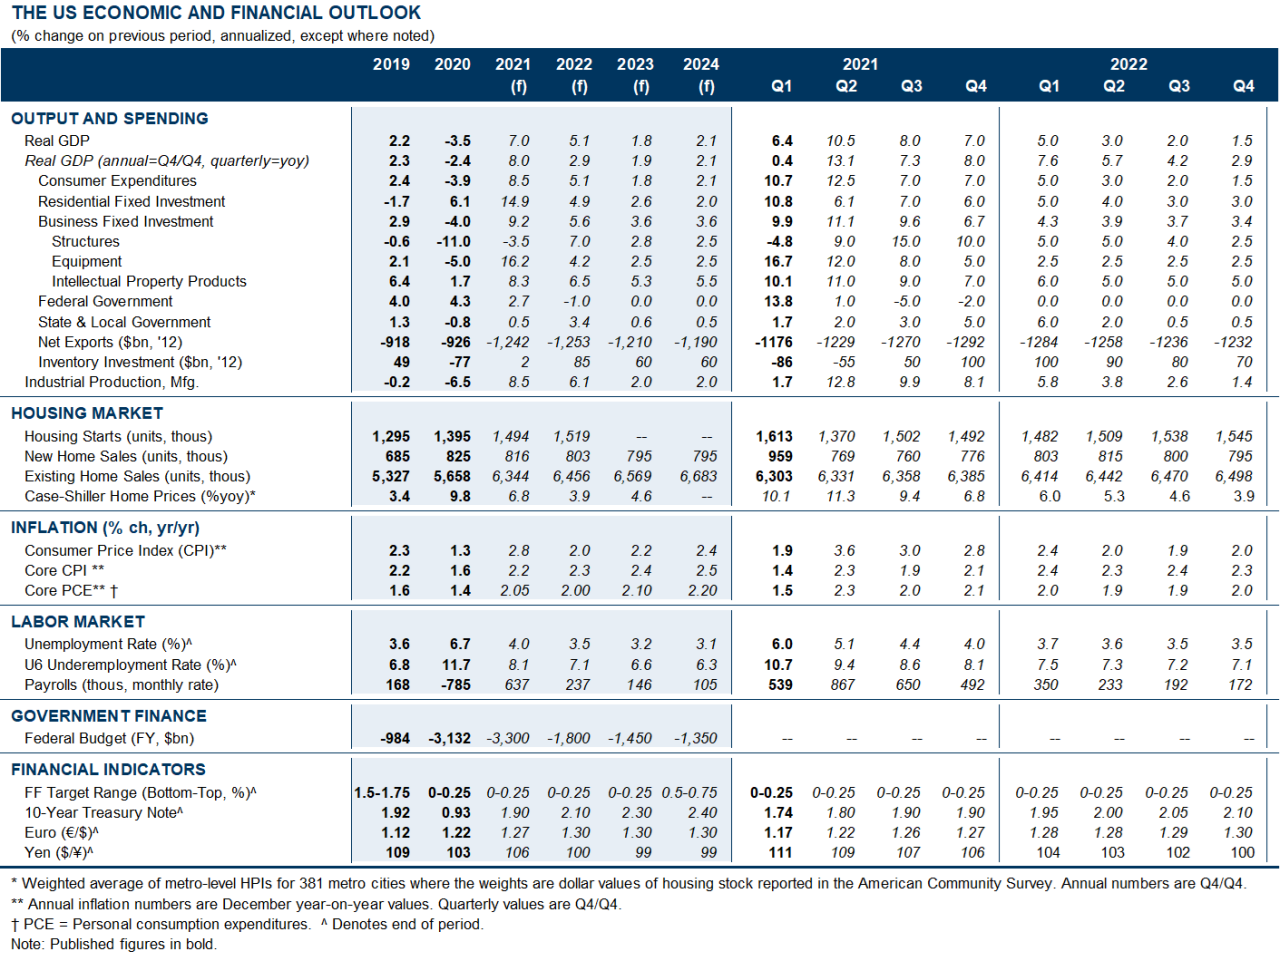
The US Economic and Financial Outlook
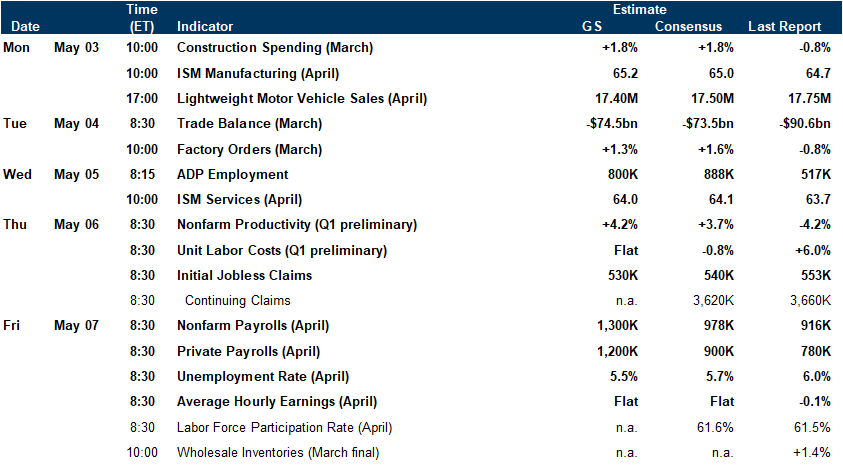
Data available on request.
Source: Goldman Sachs Global Investment Research

Economic Releases

Data available on request.
Source: Goldman Sachs Global Investment Research
  1. 1 ^ Changes in surveying procedures and response rates during the pandemic appear to have distorted the Housing Vacancy Survey for most of 2020, but the impact appear to have been mostly unwound by 2021Q1 (see Census FAQ here).
  2. 2 ^ Because individual household formation series are noisy, we average data from the monthly Housing Vacancies and Homeownership (HVS) survey, the annual American Community Survey (ACS), the March Current Population Survey (CPS), and estimates based on residential electricity meter data from the Energy Information Administration (EIA). The household formation data for 2020 that is already released points to a wide range of values, in part because of pandemic-related distortions to survey procedures (see previous footnote). We assume that household formation for the year as a whole remained firm, in part because of the rapid pace of home sales (Exhibit 1) and surveys of homebuyers.
  3. 3 ^ Apurva Gundaria and Marty Young, “The Credit Line: US Housing Remains Relatively Affordable,” 2021.
  4. 4 ^ While the model is well below the actual level of 2021Q1 home sales of 7.2mn, the current pace likely reflects some pent-up demand from sales that didn’t occur early in the pandemic: the gap between the model and actual is cut in half on a 4QMA basis.
  5. 5 ^ For discussion on the impact of consumer expectations and credit availability on home prices, see Brian Chen and Marty Young, “US Daily: Will Home Price Growth Slow Further?” 2019.
  6. 6 ^ We assume that inflation expectations – an input to our home prices model – evolve in a manner consistent with our inflation forecasts, as outlined in Joseph Briggs, “US Daily: A Top-Down Checkup On Our Inflation Forecast,” 2021. We assume that credit availability and surveys of consumer demand remain roughly unchanged.
  7. 7 ^ David Mericle, “US Daily: Shelter Inflation Likely to Rise a Bit Further,” 2014.

Investors should consider this report as only a single factor in making their investment decision. For Reg AC certification and other important disclosures, see the Disclosure Appendix, or go to www.gs.com/research/hedge.html.