Goldman Sachs Research
US Economics Analyst
Mind the Gap: Core CPI Surges, But Core PCE Should Still Average 2% in 2022 (Hatzius/Hill)
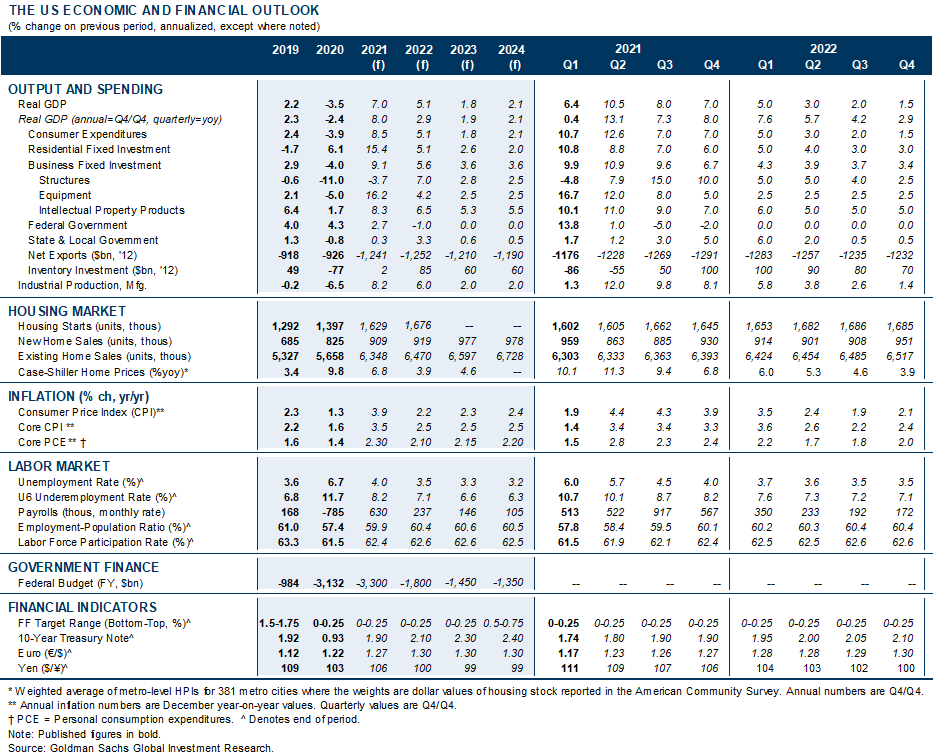
  • We are boosting our core CPI forecasts significantly further and now forecast a peak of 3.6% year-on-year in June, followed by 3.5% at end-2021 and an average of 2.7% in 2022. The latest revisions reflect a further increase in used car auction prices and downward revisions to auto production schedules, as well as signs that health insurance prices will rise sharply this fall.

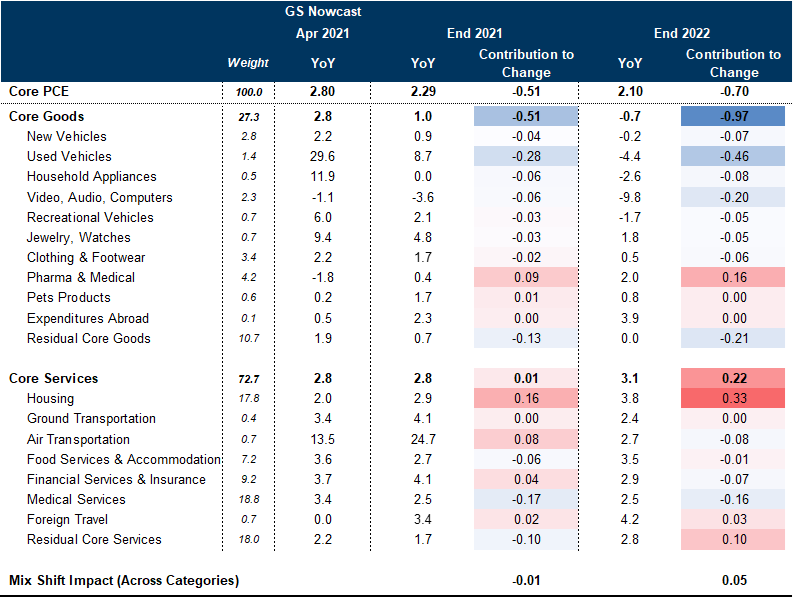
  • Our core PCE inflation forecast remains at 2.8% in April/May, followed by 2.3% at end-2021 and an average of 2% in 2022. The CPI-PCE gap is so large because the weights of both used cars and shelter are much bigger in the core CPI than in the core PCE, and because health insurance prices are not included in the PCE (which instead focuses on economy-wide medical costs).

  • More broadly, the recent inflation news has not meaningfully altered our relatively relaxed medium-term view because much of it reflects such obviously temporary factors. The best illustration is that the GS trimmed core PCE index—which systematically excludes the most volatile core price changes—only rose an estimated 1.5% year-on-year in April, 1.3pp below the official core PCE rate.

  • Our concern about second-round effects from the short-term price surge remains limited so far. Although inflation expectations have moved up, our replication of the Fed's reference measure is still below the levels seen in the 2001-2007 expansion. Meanwhile, the weakness in labor supply that is evident from April's large wage increase (and from the surge in vacancies) should end as the pandemic recedes further and the $300/week unemployment benefit top-up expires on September 6 (or earlier, at least in many Republican-controlled states).

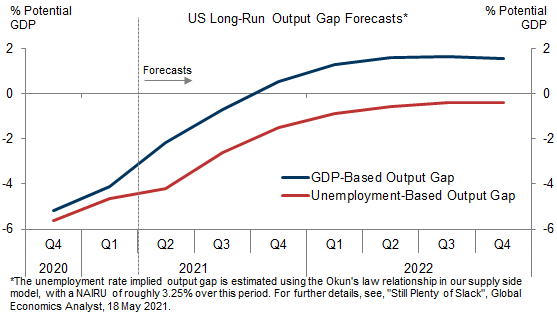
  • Ultimately, the biggest question is whether the economy will overheat, i.e. whether output and employment will rise substantially above potential. We don't expect this because the starting point is one of sizable slack—especially if we consider not just GDP-based but also employment-based measures of the output gap—and because growth is likely to slow from its current rapid pace as the fiscal impulse turns negative next year.

Mind the Gap: Core CPI Surges, But Core PCE Should Still Average 2% in 2022

Q: How much has the CPI outlook changed in recent weeks?
A: Following the upside surprise in the April CPI and more severe auto-sector bottlenecks in the late spring, we now forecast core CPI inflation to peak at 3.6% in June, to end the year at 3.5%, and to average 2.7% in 2022. Relative to our forecasts in early May, these figures reflect increases of up to 1¼pp for this year and ⅓pp for next year.
Q: What’s going on in the auto sector?
A: Following an unprecedented rise in recent quarters, used car auction prices increased another 4.6% in the first half of May (red line in Exhibit 1) and are now up 48% year-on-year. This reflects a perfect storm of supply and demand forces. Supply has been depressed by microchip-related production constraints, while demand has been boosted by the pandemic-driven shift from public to private transportation, stimulus checks, and aggressive bidding to rebuild inventory on the part of auto dealers.

Exhibit 1: Surging Used Car Auction Prices Disproportionately Boost the CPI Measure

1. Surging Used Car Auction Prices Disproportionately Boost the CPI Measure. Data available on request.
Source: Department of Labor, Manheim, Cox Automotive, Goldman Sachs Global Investment Research
Relatedly, auto production schedules were revised down for May and June, though importantly they still indicate a strong rebound from the micro-chip-related depressed levels of the prior three months (+14% mom sa in May, or 97% of January levels). Reflecting this, we now expect higher highs for auction prices and official measures of new and used car inflation in the near-term.[1] While we do not believe the current level of used car prices is sustainable given the rebound in new car production, the waning boost from stimulus checks, and the coming shift back towards mass transit and other public transportation, we nonetheless boosted our year-end assumptions to reflect our view that the normalization will take somewhat longer.
Q: What other factors do you expect to boost core CPI inflation?
A: We also updated our CPI assumptions to reflect full-year profitability data from publicly-traded health insurers. Changes in benefit payout ratios have closely tracked the multi-quarter trend in the health insurance CPI since the methodological changes introduced in mid-2018 (see Exhibit 2). Looking ahead, the robust profitability of most insurance carriers during the depths of the coronacrisis argues for a sharp rebound in this CPI category starting this fall (and continuing during the first three quarters of 2022).

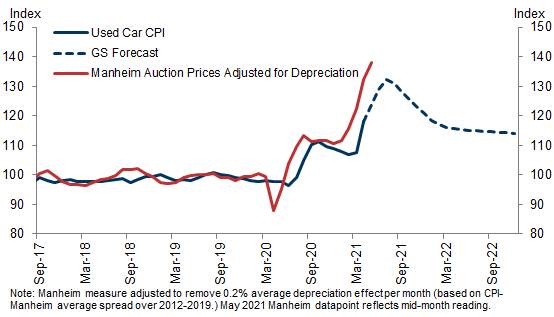
Exhibit 2: Health Insurance to Contribute Positively to CPI-PCE Gap Again Starting This Fall

2. Health Insurance to Contribute Positively to CPI-PCE Gap Again Starting This Fall. Data available on request.
Source: Department of Labor, Company Data, Bloomberg LP, Goldman Sachs Global Investment Research
Q: How much have your core PCE inflation forecasts changed?
A: Not nearly as much. We expect core PCE inflation to rise to 2.8% year-on-year in April/May and to end the year at 2.3%, both ¼pp above our view in early May. But more importantly, we still see a return to an average of 2% for core PCE inflation in 2022, followed by a slower but more sustained acceleration to 2.2% in 2024.
There are three reasons for the disproportionately bigger increase in core CPI inflation relative to the core PCE. First, the core CPI weight on used cars is more than twice that of the PCE measure (3.5% vs. 1.4%). Used car inflation also tends to be more volatile in the CPI because—unlike in the PCE—the CPI measure does not net out the prices received by consumers when they sell or trade-in. We estimate the larger size and higher volatility of this subcomponent in the CPI will contribute 0.5pp to the year-on-year CPI-PCE gap on average in the second half of the year.
Second, the PCE measure does not include a health insurance component because it tracks the economy-wide cost of care. Accordingly, the pickup in the CPI measure will contribute nearly 0.2pp to the CPI-PCE gap by late 2022 on our forecast, or a +0.4pp swing versus the fall-2021 gap. Reflecting this and the expiration of some CARES Act aid to hospitals, we expect health services CPI inflation to rise back above the PCE measure later this year.
Third, the nearly 1pp rebound we expect by year-end in rent inflation—which has a 40% weight in core CPI but only an 18% weight in core PCE—would add another +0.2pp to the gap relative to current levels.

Exhibit 3: We Expect Core CPI Inflation to Run a Point Above the PCE Measure in the Second Half of the Year

3. We Expect Core CPI Inflation to Run a Point Above the PCE Measure in the Second Half of the Year. Data available on request.
Source: Department of Labor, Department of Commerce, Goldman Sachs Global Investment Research
Q: How much has all this changed your basic inflation view?
A: Not very much, because the higher inflation news is mostly driven by temporary forces. The best way to see this is from our GS trimmed core PCE index, which systematically excludes the biggest monthly price changes while matching the official core on average over time. Because we have most of the inputs into the April PCE from the CPI and PPI, we can calculate what the trimmed-mean will show and are estimating a year-on-year rate of only 1.5% in April. This would be a remarkably large gap, illustrating the highly unusual concentration in the official index and largely ruling out broad inflation pressure outside the obvious drivers, at least so far.

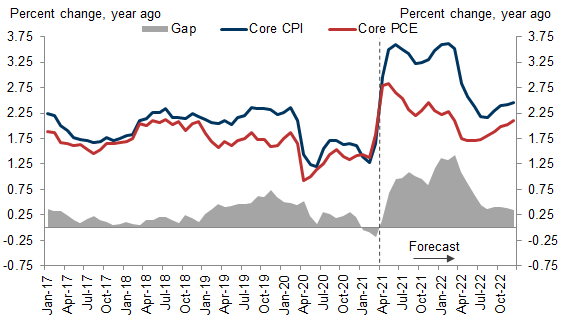
Exhibit 4: Our Core Trimmed-Mean PCE Measure Still Looks Very Benign

4. Our Core Trimmed-Mean PCE Measure Still Looks Very Benign. Data available on request.
Source: Haver Analytics, Goldman Sachs Global Investment Research
Q: But could the outsized price increases in reopening and bottlenecked industries—even if temporary—set off a spiral of second-round effects via higher input costs?
A: This is unlikely, in our view. The inflation history of the past three decades shows a number of instances—most notably the tightening scare of 2011—in which similar concerns were raised and none in which they were borne out. Empirically, measures that focus less on the outliers and more on the middle part of the distribution perform much better in predicting future inflation than measures that include the most volatile price changes. Thus, core (i.e. ex food and energy) inflation is better than headline at predicting future headline inflation, and our GS trimmed core is even better than the official core because it is less volatile. Moreover, we can already see economic adjustments that will reverse some of the recent price hikes—most importantly, an auto production pickup that should put significant downward pressure on new and used car prices in H2. If so, whatever positive second-round impulse might have resulted from the used car price increase will be gradually offset by a negative second-round impulse from the subsequent price decline.
Q: Do you worry about the increase in inflation expectations, e.g. the jump in the University of Michigan 5-10 year measure to 3.1% or the widening of TIPS breakevens to 2.5%?
A: Inflation expectations bear watching but so far we are not too worried. Our estimate of the Fed’s Index of Common Inflation Expectations (CIE)—a comprehensive measure that translates these numbers into core PCE expectations terms—has only risen to 2.08% as of early May. While up sharply from the lows, this is still very close to the Fed’s 2% target, and below levels that were routinely seen in the 2001-2007 cycle. At this point, the increase in inflation expectations since last year looks like a move to the 2% average inflation target rather than a move substantially above it. If we saw a large further increase in the CIE to levels above 2.2%—i.e. clearly above the pre-2008 peak—this would be grounds for somewhat more concern.

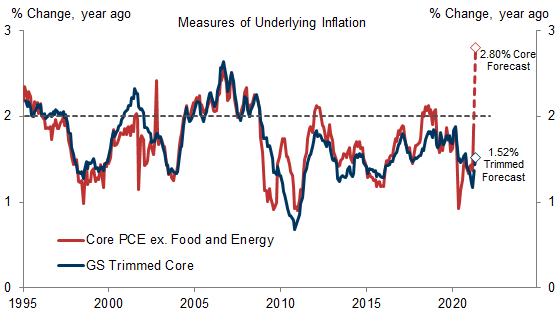
Exhibit 5: Inflation Expectations Have Risen, But Not to Extreme Levels

5. Inflation Expectations Have Risen, But Not to Extreme Levels. Data available on request.
Source: Federal Reserve, Goldman Sachs Global Investment Research
Q: Is the upward pressure on wages—specifically the 0.7% increase in average hourly earnings in the April jobs report—a sign of potentially more significant second-round effects?
A: We do view the wage increase—as well as other indicators including a big increase in vacancies and a relatively high quit rate—as a sign of labor supply shortages, resulting in part from the continued $300/week unemployment benefit top-up. This payment has raised the replacement ratio (total unemployment benefits in percent of wages) to 100%+ for about half of all unemployed workers.
That said, there are two reasons to keep this issue in perspective. First, monthly AHE numbers are volatile and part of the outsized month-on-month increase in April probably reflects noise rather than signal. The year-on-year rate did not change much on a composition-adjusted basis in April, and the Atlanta Fed’s wage growth tracker—an alternative measure that is based on individual wage changes over a 12-month period—actually showed a slowdown from 3.4% year-on-year in March to 3.2% in April.

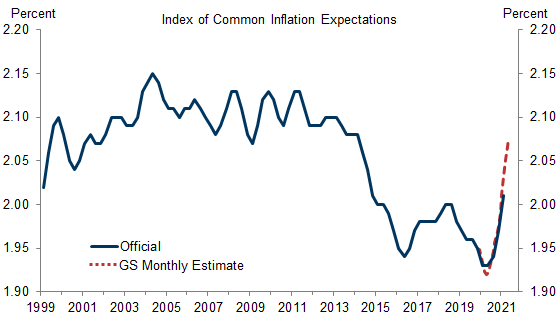
Exhibit 6: Atlanta Fed Wage Tracker Slowed in April

6. Atlanta Fed Wage Tracker Slowed in April. Data available on request.
Source: Federal Reserve, Goldman Sachs Global Investment Research
Second, the benefit top-up is scheduled to expire in early September, and there is virtually no chance of an extension following the recent concerns around labor supply shortages; many Republican-controlled states are already ending it and some have even announced that they will replace it with a re-employment bonus. Together with receding health risks, these policy changes are likely to boost labor supply dramatically in the fall. With employment still about 8 million below the February 2020 level, the main imbalance in the labor market beyond the very short term is still likely to be excess supply rather than excess demand.
Q: What would make you more concerned?
A: The key question is whether the economy moves beyond full employment of resources. Despite our optimistic growth forecast, our answer is “probably not” or at least “not by much,” although the details depend on whether we look at real GDP or employment. (In theory, both approaches should yield the same answer, but in practice this is not the case because all economic data and models are subject to error.) From a GDP perspective, our latest growth and output gap estimates suggest that output will rise 1-2% above potential by early 2022. From an employment perspective, by contrast, our forecasts only imply a full closing of the gap in the second half of 2022. If we put some weight on both of these estimates, the implication is that the economy will move modestly above potential in the next couple of years, which should mean a rise in inflation to modestly above 2%—that is, roughly what the Fed is aiming for in its AIT framework.

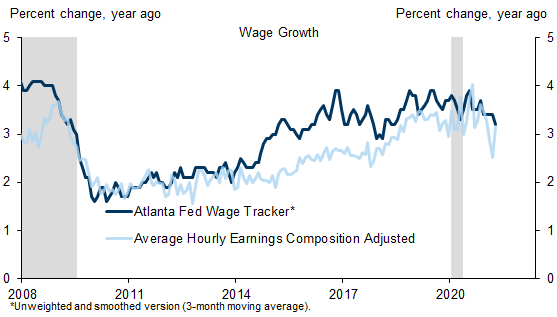
Exhibit 7: A Return to Full Employment, Or Perhaps Modestly Beyond

7. A Return to Full Employment, Or Perhaps Modestly Beyond. Data available on request.
Source: Goldman Sachs Global Investment Research
However, it is worth noting the substantial uncertainty around these estimates. It is certainly possible that growth will prove to be even stronger than our (above-consensus) forecast, perhaps because households spend a larger-than-estimated share of their pent-up saving, because the wealth effect from higher home and equity prices is larger than we are assuming, or because of the multiplier effects from what is likely to be quite a synchronized global recovery. It is also possible that potential output will be weaker than we have assumed, most plausibly because labor supply lags behind our expectations even once the obvious roadblocks have been removed.
Q: Any closing thoughts?
A: Although many forecasts—including our own—imply a rapid normalization of social and economic life in the United States in coming quarters, it is worth keeping in mind that the actual environment remains quite unprecedented for now. From an economic forecasting perspective, this probably means that we should expect larger-than-normal surprises in the economic data at least over the next several months, but should also put less-than-normal weight on what these surprises mean beyond the very near term. This is one added reason why we have not changed our medium-term inflation views much in response to the recent upside surprises.

Jan Hatzius

Spencer Hill

Appendix

In Contrast to Higher Core CPI Inflation, We Forecast a ½pp Decline in the Core PCE Measure between April and Year-End

In Contrast to Higher Core CPI Inflation, We Forecast a ½pp Decline in the Core PCE Measure between April and Year-End. Data available on request.
Source: Goldman Sachs Global Investment Research

The US Economic and Financial Outlook
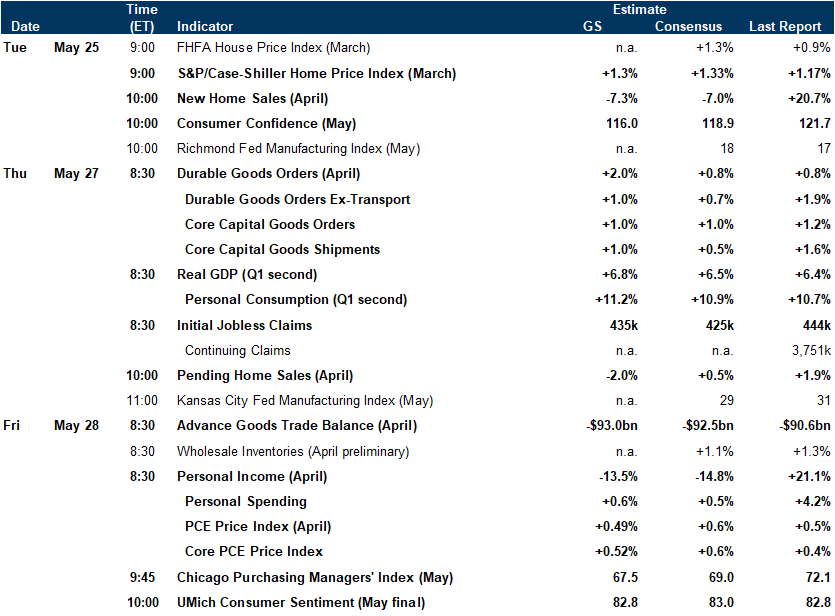
Data available on request.
Source: Goldman Sachs Global Investment Research

Economic Releases

Data available on request.
Source: Goldman Sachs Global Investment Research
  1. 1 ^ While we await publication of full-month data, we are penciling in a nearly 5% increase in the May Used Car CPI (see Exhibit 1), and we expect a further 4-7% increase before prices peak in June or July, given the lags between auction prices and the inflation statistics. Many of the more dramatic swings in the Manheim measure historically, including the April 2020 collapse, were not fully reflected in the subsequent CPI data, which is based on different source data. The CPI measure also removes an upward bias from depreciation, in order to maintain constant vehicle quality over time.

Investors should consider this report as only a single factor in making their investment decision. For Reg AC certification and other important disclosures, see the Disclosure Appendix, or go to www.gs.com/research/hedge.html.