Goldman Sachs Research
US Daily: Supply Chain Disruptions, Wage Growth, and Inflation in 2022: A Scenario Analysis (Mericle)
2 October 2021 | 10:44AM EDT | Research | Economics| By Jan Hatzius and others
More
  • The two most important questions for the 2022 inflation outlook are whether global supply chains will recover enough for goods prices to normalize and whether wage growth will stop accelerating now that enhanced unemployment benefits have expired. We construct a scenario analysis for 2022 inflation based on alternative assumptions about these two key issues.

  • We expect ongoing supply chain disruptions to raise durable goods prices further above the pre-pandemic trend through end-2021, pushing core PCE inflation to 4.25% by December. But we expect the resolution of supply problems in 2022 to reverse about 30% of that deviation above trend on average by end-2022, worth a 185bp decline in the contribution to year-on-year core PCE inflation. We assume that wage growth for low-paid jobs will moderate, but labor market tightening will keep overall wage growth steady at 3¾% next year. These assumptions generate our baseline forecast that core PCE inflation will fall to 2.0% at end-2022.

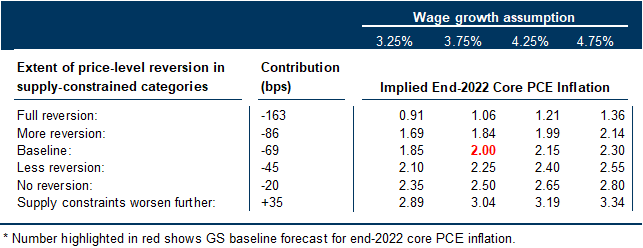
  • Our scenario analysis suggests that a wide range of inflation outcomes is plausible. The extent of payback next year for unusually large durable goods price increases this year will have an especially large impact. Moderately more price level reversion in these categories coupled with somewhat softer wage growth could subtract another ¼pp from core PCE inflation at end-2022 relative to our baseline, while no reversion coupled with stronger wage growth could add ½pp or more, and further price increases in supply-constrained categories would add even more.

Supply Chain Disruptions, Wage Growth, and Inflation in 2022: A Scenario Analysis

The two most important questions for the 2022 inflation outlook are whether global supply chains will recover enough for goods prices to normalize and whether wage growth will stop accelerating now that enhanced unemployment benefits have expired. We explain how our baseline assumptions about these issues inform our inflation forecast and show how alternative assumptions would change the forecast.
We introduced a framework for estimating the effect of supply chain disruptions on the inflation outlook in June. We focus on items where supply constraints have pushed prices well above pre-pandemic trends, primarily durable goods such as cars. We combine our sector analysts’ views on how supply will evolve as current disruptions are resolved with our own views on how demand for these items will evolve, based in part on our disposable income forecasts. We then forecast the extent and timing of reversion toward pre-pandemic price trends in each category based on the supply and demand outlook.
Exhibit 1 shows the latest update of this analysis. The key takeaway is that these categories tended to contribute about -20bp to year-on-year core PCE inflation in total before the pandemic, are contributing 105bp now, will contribute 115bp at end-2021 under our forecast, and will contribute -70bp by end-2022 under our assumption that price levels for some items will partially revert toward pre-pandemic trends as demand moderates from very elevated levels, supply disruptions are overcome, and inventories are gradually rebuilt. This implies a -185bp turnaround from end-2021 to end-2022.

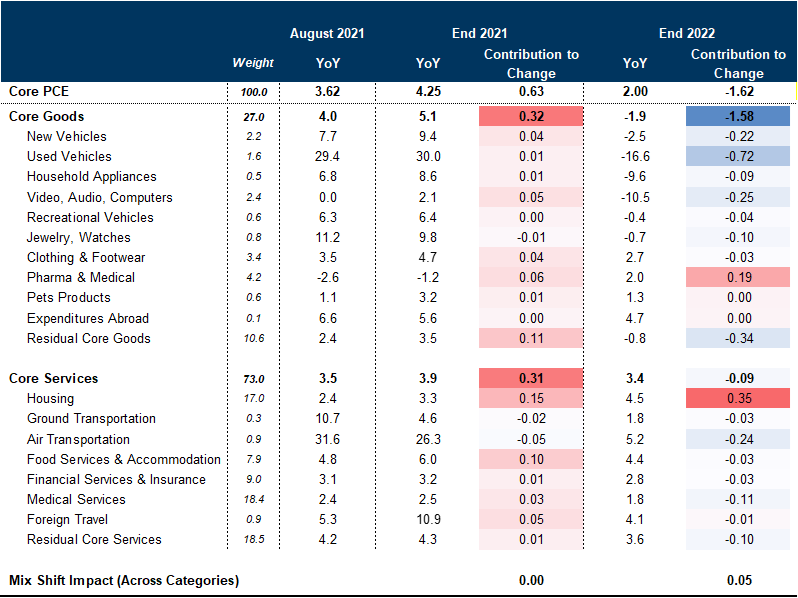
Exhibit 1: We Expect Supply-Constrained Categories to Swing from a 115bp Boost to Core PCE Inflation at End-2021 to a 70bp Drag by End-2022

1. We Expect Supply-Constrained Categories to Swing from a 115bp Boost to Core PCE Inflation at End-2021 to a 70bp Drag by End-2022. Data available on request.
Source: Bureau of Economic Analysis, Goldman Sachs Global Investment Research
Exhibit 2 lays out our underlying assumptions. For each category, the first bar (dark blue) shows the current percent deviation above the pre-pandemic trend, the second bar (light blue) shows the deviation implied by our baseline forecast by end-2021, and the third bar (grey) the deviation by end-2022. The numbers show the share of the end-2021 deviation from trend that we assume will revert by end-2022. The orange circles show alternative assumptions that imply one-third greater reversion and therefore more deflationary payback next year for elevated prices this year, while the red diamonds show alternative assumptions that imply only half as much reversion and less payback. We return to the implications of these alternative sets of assumptions for end-2022 inflation in Exhibit 5 below.
The main change since we first introduced this analysis is that we are now assuming almost no reversion through the rest of 2021 in light of the persistence of supply chain problems in recent months, caused in large part by spillover effects from the Delta variant hit in Asia in Q3. In fact, we are now assuming that ongoing supply chain disruptions will raise prices further above the pre-pandemic trend through end-2021 in some categories, pushing core PCE inflation to 4.25% by December. This, however, leaves more room for prices to fall in 2022 and beyond.
Our projections for price level reversion differ by category and depend on the supply-demand outlook, the degree of price flexibility for each item, and the extent to which higher effective prices to date are due to reduced promotional activity—which is likely to return eventually—rather than harder-to-reverse increases in sticker prices. Where possible, we also take account of company pricing announcements.
We expect used car prices to revert substantially toward the pre-pandemic price trend in 2022, because once new cars become more readily available, consumers are unlikely to pay comparable prices for used cars. For items such as new cars and appliances, we expect most but not all normal discounting activity to return by the end of 2022, resulting in a reversal of above-trend inflation to date caused by reduced promotional pricing, but no reversal of that caused by larger-than-usual sticker price increases. We expect consumer electronics prices to revert modestly because demand will likely moderate, prices tend to be flexible, and some discounting should return, but only modestly because the higher cost of microchips and other inputs has probably not yet fully passed through to consumer prices.

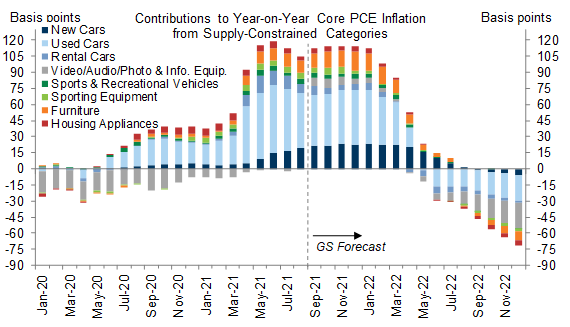
Exhibit 2: We Expect Used Car Prices to Revert Substantially Toward Pre-Pandemic Price Trends in 2022, but We Expect Less Reversion for Appliances, Consumer Electronics, and Furniture

2. We Expect Used Car Prices to Revert Substantially Toward Pre-Pandemic Price Trends in 2022, but We Expect Less Reversion for Appliances, Consumer Electronics, and Furniture. Data available on request.
Source: Bureau of Economic Analysis, Goldman Sachs Global Investment Research
The other key question for the 2022 inflation outlook is whether wage growth will stop accelerating now that enhanced unemployment benefits have expired. The left side of Exhibit 3 shows that our composition-adjusted wage tracker grew 3.7% over the last year and that our wage survey leading indicator points higher to 4%. These numbers are high relative to last cycle, but are still consistent with unit labor cost growth of roughly 2% after accounting for productivity growth. Wage growth for low-wage workers, however, has been strikingly strong at 6% year-on-year after accelerating in Q2 and Q3, as shown on the right side of Exhibit 3, resulting in above-normal inflation in categories like restaurants.

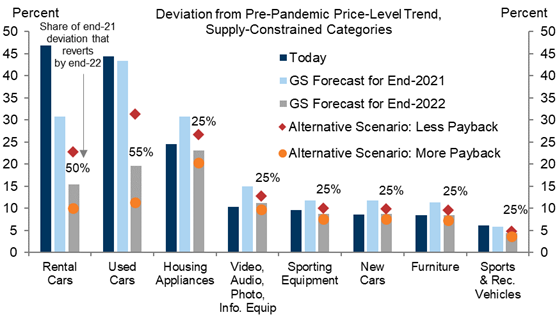
Exhibit 3: Wage Growth Is Above the Pre-Pandemic Peak, and Low-Wage Wage Growth Is Especially Hot

3. Wage Growth Is Above the Pre-Pandemic Peak, and Low-Wage Wage Growth Is Especially Hot. Data available on request.
Source: Goldman Sachs Global Investment Research
Basic economic principles imply that the end of the enhanced unemployment benefits should slow wage growth for low-paid workers. About 13 million people lost all or part of their unemployment benefit, and many millions of them are now likely to look more actively for work and be more willing to take a job. This influx of labor supply, especially among the low-paid workers who accounted for a disproportionate share of benefit recipients, seems likely to slow the pace of low-wage wage growth.
The evidence so far is mixed, however. Average hourly earnings growth for leisure and hospitality workers—a low-paid group that has seen rapid wage gains this year and should be particularly affected by the end of enhanced benefits—did not slow more in states where unemployment benefits expired early than in states where benefits remained in place until September, as shown on the left side of Exhibit 4. We have found evidence, however, that wages for drivers in the ride-hailing industry—where wages and prices are set dynamically in real time in part in response to changes in labor supply—did come down by more in the early benefit expiration states, as shown on the right side of Exhibit 4.

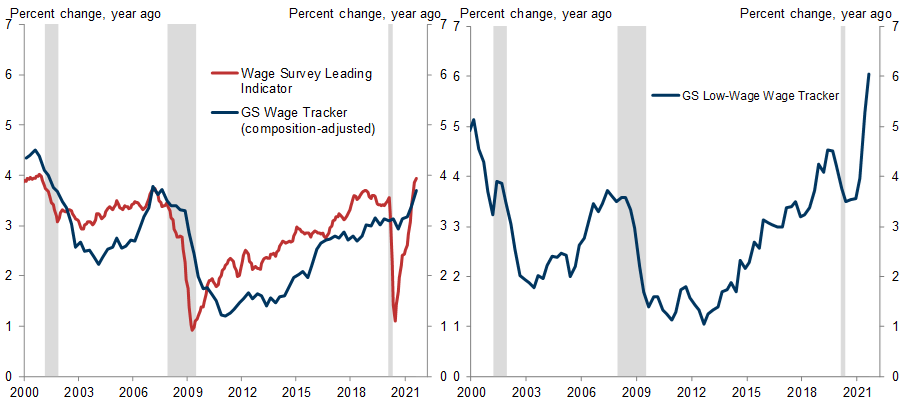
Exhibit 4: The Evidence on the Impact of Enhanced Unemployment Benefit Expiration on Wage Growth Is Mixed So Far

4. The Evidence on the Impact of Enhanced Unemployment Benefit Expiration on Wage Growth Is Mixed So Far. Data available on request.
Source: US Bureau of Labor Statistics, Gridwise, Goldman Sachs Global Investment Research
Exhibit 5 shows our scenario analysis for core PCE inflation at end-2022 under different degrees of price level reversion in supply-constrained categories and different assumptions about wage growth. Our baseline scenario assumes the moderate price level reversion discussed above and 3.75% wage growth, with a deceleration at the low end roughly offset by slight acceleration elsewhere as the labor market tightens. These assumptions generate our baseline forecast of 2.0% core PCE inflation at end-2022.
The alternative scenarios show that a very wide range of outcomes is plausible. The extent of payback next year for unusually large durable goods price increases this year will have an especially large impact on inflation. Moderately more price level reversion in these categories coupled with somewhat weaker wage growth would leave core PCE inflation at 1.7-1.8% year-on-year at end-2022. In contrast, less reversion would boost core PCE to 2.25%, no reversion whatsoever coupled with stronger wage growth would raise it to 2.5% or higher, and further increases in these categories in 2022—we use an assumption of half of the annualized pace since the pandemic began for most categories and a quarter for used cars—would raise it even higher.

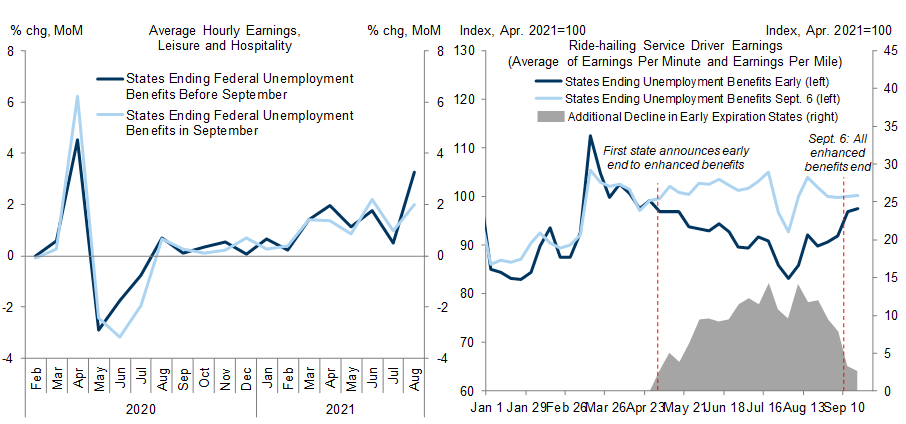
Exhibit 5: More Price Level Reversion and Weaker Wage Growth Could Leave Core PCE Below 2% at End-2022, While No Reversion Coupled with Stronger Wage Growth Could Leave It Above 2.5%

5. More Price Level Reversion and Weaker Wage Growth Could Leave Core PCE Below 2% at End-2022, While No Reversion Coupled with Stronger Wage Growth Could Leave It Above 2.5%. Data available on request.
Source: Goldman Sachs Global Investment Research
All of the scenarios shown above take as given the other aspects of our core PCE inflation forecast, which is described in an appendix below. There are of course other significant sources of uncertainty about inflation next year too, in particular the outlook for shelter inflation.

David Mericle

We thank Manuel Abecasis for help with this report.

Appendix: Our Bottom-Up Core PCE Model Points to 2.0% at End-2022

Appendix: Our Bottom-Up Core PCE Model Points to 2.0% at End-2022. Data available on request.
Source: Goldman Sachs Global Investment Research

Investors should consider this report as only a single factor in making their investment decision. For Reg AC certification and other important disclosures, see the Disclosure Appendix, or go to www.gs.com/research/hedge.html.