Goldman Sachs Research
Global Economics Analyst
Greenflation: The Impact of Net Zero on Inflation (Zhestkova/Struyven)
5 January 2022 | 11:44PM EST | Research | Economics| By Jan Hatzius and others
More
  • Surging energy prices have been an important driver of the jump in inflation. ECB President Lagarde pointed out recently that energy supply challenges related to climate change, alongside strong demand, have contributed to higher inflation. As energy investment keeps falling and policymakers have announced net zero targets, we estimate the inflation impact of this transition.

  • Based on expert estimates of what it will take to transition to carbon neutrality by 2050, we assume a carbon tax that rises linearly to $100 per ton—or roughly $1 per gallon of gasoline—by 2030. We then estimate the impact on consumer price inflation in four economies based on the carbon intensity of oil, natural gas, and coal and the contribution of these commodities to consumer prices.

  • We make three key findings. First, we estimate a boost from this transition path to the average US headline PCE inflation rate in the first three years of around 25bp annually. Second, the boost to core PCE inflation is smaller at 10bp. Third, the boost to headline inflation is larger in China at 30bp due to its greater reliance on coal. The boost is smaller in Canada (15bp) and especially Germany (just above 5bp) because both economies already have a carbon tax, Germany is relatively energy-efficient, and German gas prices are already very high.

  • The risks around our estimates are two-sided. Other mechanisms—including ESG-related market pressures to shun fossil fuel projects—could substitute for carbon pricing (which seems unlikely in the US for now), but at the cost of a somewhat larger inflation impact. The inflation boost may also be larger if the transition is delayed, if inflation expectations rise, or if fiscal stimulus boosts demand. The inflation boost may be smaller if higher policy rates cool the economy, or if producers and consumers rapidly switch to green alternatives, for instance in response to green subsidies.

  • Although the policy path is uncertain, we conclude that the eventual transition to net zero is likely to meaningfully boost inflation. This supports our view that inflation and nominal policy rates will settle above their pre-pandemic levels. At the same time, the estimated inflation effects appear modest relative to the importance and ambition of the net zero goal. A timely carbon pricing-driven transition thus appears manageable from an aggregate economic perspective.

Greenflation: The Impact of Net Zero on Inflation

Surging energy prices have been an important driver of the jump in global inflation. Energy CPI indices are 20 to 35% higher than a year ago in most advanced economies, boosting headline inflation by 250bp in the US, for instance (Exhibit 1).

Exhibit 1: Energy Inflation Has Surged

1. Energy Inflation Has Surged. Data available on request.
Source: US Department of Labor, UK Office for National Statistics, Statistics Canada, Goldman Sachs Global Investment Research
Energy supply challenges related to the climate transition, alongside the strength in energy demand, have contributed to higher inflation in both Europe and China (Exhibit 2). ECB President Lagarde pointed out recently that climate-related issues, including weaker-than-usual winds, have boosted gas prices as Europe had to resort to gas. China’s decarbonization policies—specifically its target to cut energy intensity by 3% in 2021 and increased local enforcement of emission curbs—also pushed Chinese coal prices to historic highs. As global energy investment continues to fall (Exhibit 3) and more than 130 countries now target net zero by 2050, this Analyst estimates what the inflation impact of this transition could be.

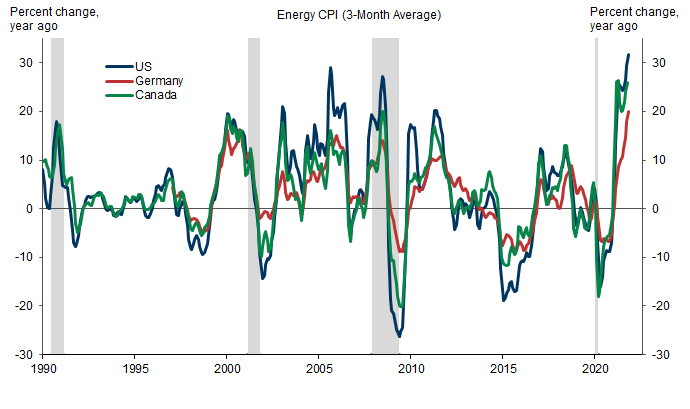
Exhibit 2: Decarbonization Efforts Have Contributed to Higher Prices of Gas in Europe and Coal in China

2. Decarbonization Efforts Have Contributed to Higher Prices of Gas in Europe and Coal in China. Data available on request.
European gas is Netherlands Title Transfer Facility (TTF) 1 month forward. China thermal coal is NBS Shanxi Q5500 10-day thermal coal.
Source: Bloomberg, China National Bureau of Statistics, Goldman Sachs Global Investment Research

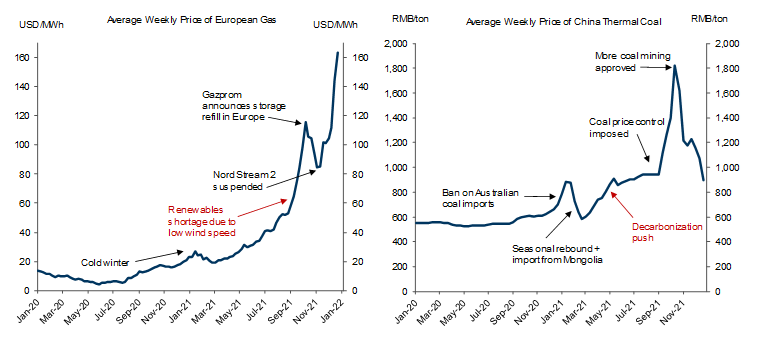
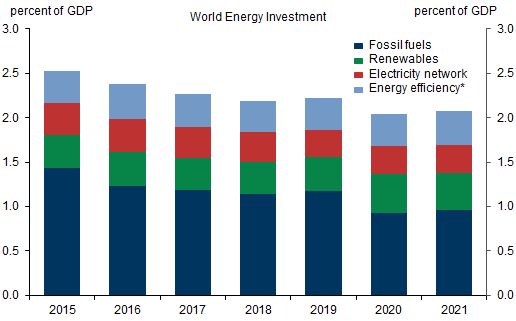
Exhibit 3: World Energy Investment Has Declined Due to Falling Investments in Fossil Fuels

3. World Energy Investment Has Declined Due to Falling Investments in Fossil Fuels. Data available on request.
Source: International Energy Agency, Goldman Sachs Global Investment Research

Modeling Net Zero

Although different countries are designing different policy mixes, most economists believe that a rising price of carbon emissions is essential to achieve net zero.[1] Over 3,500 economists, including 27 Nobel Laureates and 4 former Fed chairs, have called for a carbon tax. Based on expert estimates of what it will take to transition to carbon neutrality, we model the impact of the transition on inflation through the impact of a carbon tax path allowing to reach net zero in four large economies—the US, China, Germany, and Canada—in two steps.
First, we estimate the impact of a carbon tax that rises linearly to $100/ton (in 2021 dollars)—or roughly $1 per gallon of gasoline—by 2030 on prices of oil, natural gas, and coal. This trajectory is very similar to the carbon price required to achieve net zero by 2050 in the Global Climate Change Analysis Model from the Network for Greening the Financial System (NGFS).[2]
We assume larger carbon tax increases in the US and China, which do not have a carbon tax, than in Canada and Germany, which already have carbon taxes of around $30/ton (Exhibit 4).[3] Our estimation also relies on the higher carbon intensity of coal compared to oil and especially gas (right panel). We assume that pre-tax energy prices remain at their 2021 average level, and that the tax is fully passed through to energy prices.

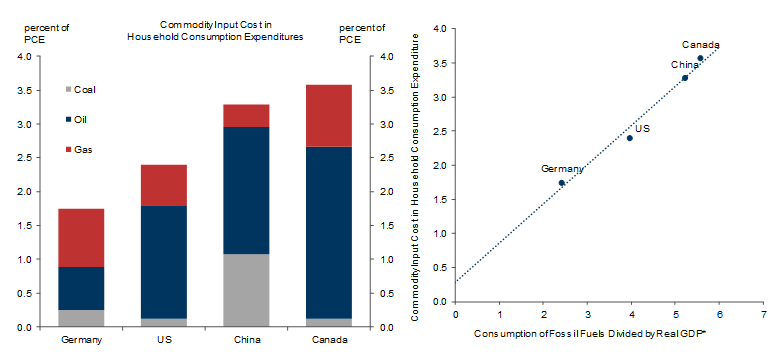
Exhibit 4: The Carbon Tax and Emission Intensity of Energy Commodities Drive our Inflation Estimates

4. The Carbon Tax and Emission Intensity of Energy Commodities Drive our Inflation Estimates. Data available on request.
Source: US Energy Information Administration, Goldman Global Investment Research
Second, we estimate the impact of higher oil, natural gas, and coal prices on consumer price inflation based on the contribution of these commodities to consumer prices. We estimate the commodity contribution using the energy intensity of industries’ input costs and industry output weights in final personal consumption from input-output tables. We again assume a full pass through of the carbon tax, in this case from commodity prices to consumer prices.[4]
Exhibit 5 shows our estimate that commodity input costs make up about 3½% of final consumption expenditures in Canada (with a large contribution from oil), 3¼% in China (with a large contribution from coal), 2½% in the US, and 1¾% in Germany. [5] Our bottom-up estimates are also strongly correlated with countries’ total consumption of fossil fuels as a share of GDP.

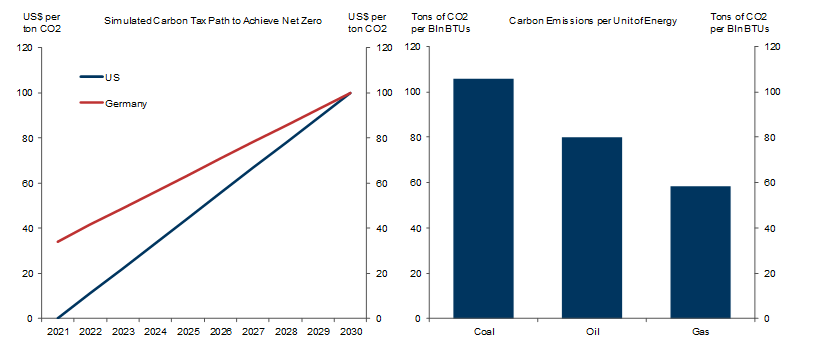
Exhibit 5: Commodity Inputs Costs Make Up More than 3% of Final Consumption Expenditures in Canada and China

5. Commodity Inputs Costs Make Up More than 3% of Final Consumption Expenditures in Canada and China. Data available on request.
*measured in Exojoules of energy from fossil fuels consumed in 2019 divided by GDP PPP in trillion $US
Source: US Department of Commerce, Statistics Canada, China National Bureau of Statistics, Germany Federal Statistics Office, Goldman Sachs Global Investment Research

Moderate Inflation Effects

We make four findings.
First, we estimate a boost from the carbon tax-driven transition to the average US headline PCE inflation rate in the first three years of the transition of nearly 25bp annually (Exhibit 6). Although coal prices rise the most, higher oil prices drive much of the inflation boost given the high oil-intensity of US consumption.

Exhibit 6: The Transition to Net Zero Would Meaningfully Boost Inflation

6. The Transition to Net Zero Would Meaningfully Boost Inflation. Data available on request.
Source: Goldman Sachs Global Investment Research
Second, the estimated boost to average core PCE inflation excluding food and energy in the first three years is smaller at 10bp.
Third, the annual boost to headline inflation is larger in China than in the US at 30bp due to its greater reliance on coal. The headline inflation boost is smaller in Canada (15bp), in part because it already has a carbon tax. The boost is the smallest in Germany (just above 5bp) because it also already has a carbon tax, it is relatively energy-efficient, and gas prices are already very high.
Fourth, the positive impact on inflation decreases over time given our assumption of a linear increase in the carbon tax (Exhibit 7). In other words, the inflationary costs of decarbonization are front loaded. The annual average boosts to consumer inflation over this decade are relatively moderate in the four economies, especially compared to the 2021 upside surprises in inflation. We estimate cumulative boosts to the 2030 price level of 0.5% in Germany, 1.2% in Canada, 1.7% in the US, and 2.0% in China.

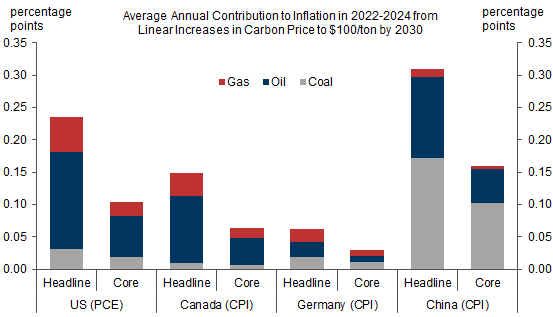
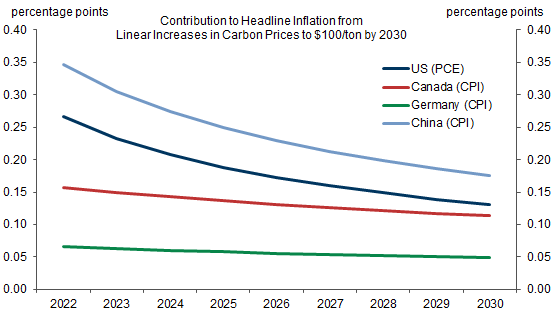
Exhibit 7: The Positive Impact of Carbon Tax Hikes on Inflation Diminishes Over Time

7. The Positive Impact of Carbon Tax Hikes on Inflation Diminishes Over Time. Data available on request.
Source: Goldman Sachs Global Investment Research

Two-Sided Risks

The risks around our estimates are two-sided.
Five factors could contribute to larger inflation effects from the transition than we estimate. First, other less cost-effective mechanisms disincentivizing fossil fuels (e.g. ESG related market pressures to shun fossil fuel projects, limits on individual emission sources, mandates on emission-reducing technologies or renewable energy shares) could substitute for carbon pricing (which seems unlikely in the US for now, at least at the federal level), but at the cost of a somewhat larger inflation impact. Second, the inflation boost would be larger if the transition is delayed. Simulations using the NGFS model estimate that a 10-year delay to the start of the transition to net zero by 2050 leaves US carbon prices and energy prices 35% higher in 2050 than in the immediate transition scenario, despite resulting in a 0.1 °C warmer world.[6] Finally, the inflation boost may also be larger if wages or inflation expectations rise, if fiscal stimulus boosts aggregate demand, or if firm-level adjustment costs to new energy sources further boost inflation.
Two factors could contribute to smaller inflation effects. First, if central banks do not accommodate the carbon tax and consumers reduce their demand for other goods due to tighter financial conditions or the negative income effect, higher energy prices may be compensated by lower prices in other categories. Second, the inflation boost may be smaller if producers and consumers rapidly switch to green alternatives, for instance in response to green subsidies.
Our estimates are also in the middle of the range of other estimates. Our estimates are somewhat smaller than those in simulations using the National Institute Global Econometric Model (NiGEM) for both the US and China. Our estimates are similar to those for the US from Columbia University, but larger than those in an empirical study based on the European and Canadian experience, which does not find any inflationary effects.

Manageable Macro Costs

Although the exact policy path remains highly uncertain, our simulation shows that the eventual transition to net zero is likely to meaningfully boost inflation. This supports our view that inflation and nominal policy rates will settle above their pre-pandemic levels.
At the same time, the estimated inflation effects appear modest relative to the importance and ambition of the net zero goal. This suggests that an early carbon pricing-driven transition is manageable from an aggregate economic perspective.
Yulia Zhestkova
Daan Struyven

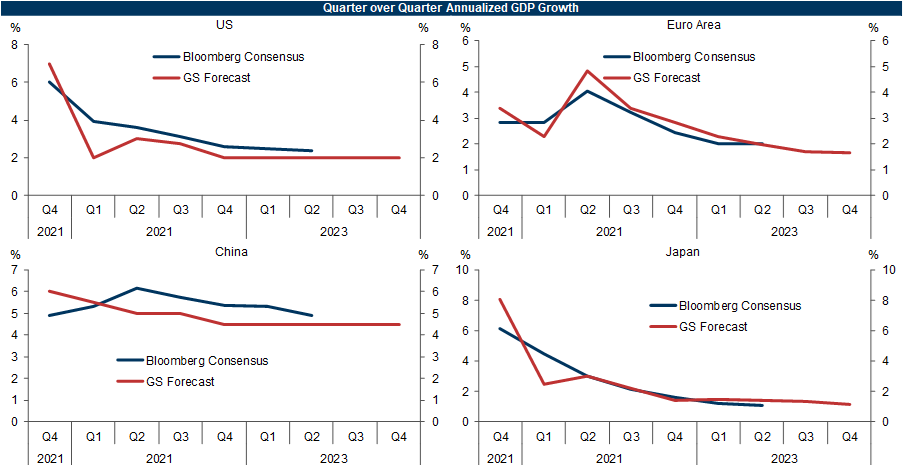
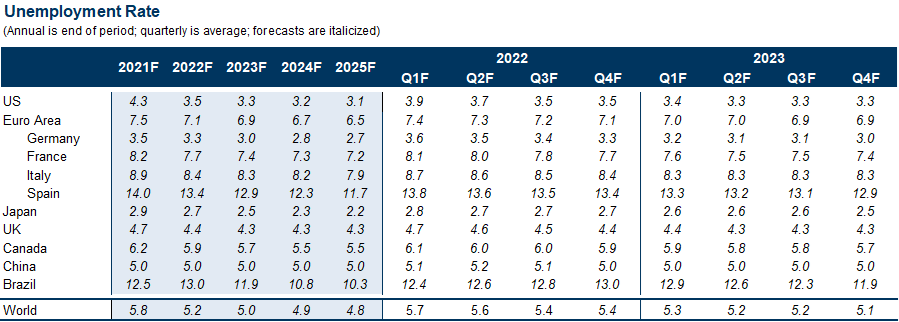
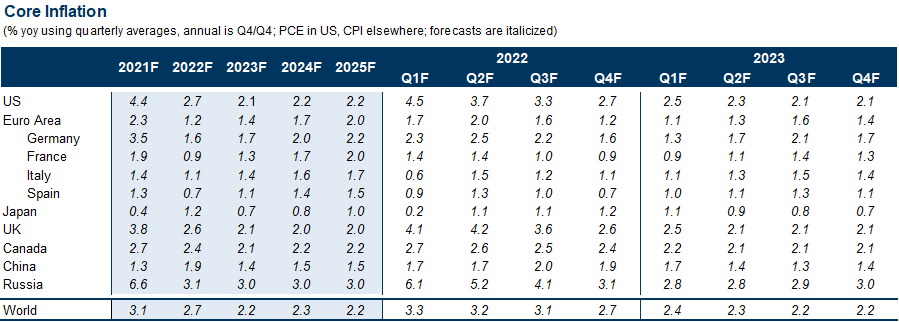
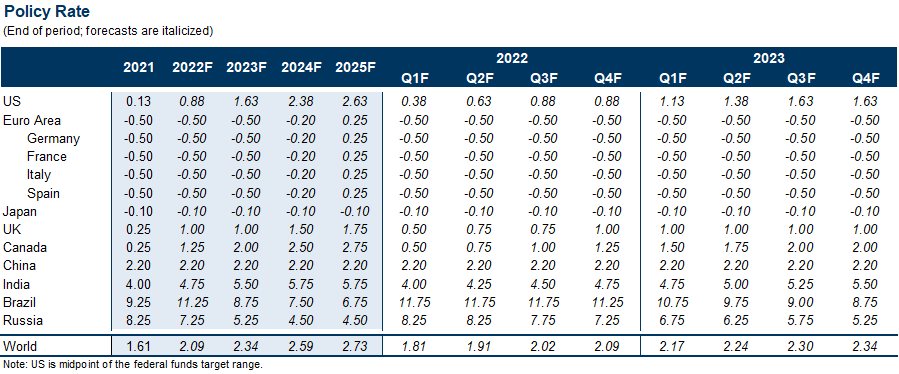
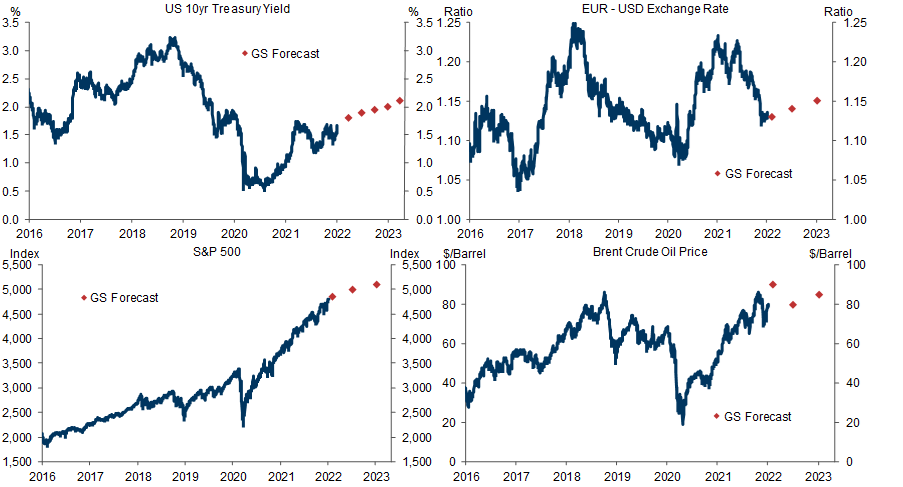
GS Global Macro Forecasts

Economic Forecasts

Data available on request.
Source: Bloomberg, Goldman Sachs Global Investment Research

Data available on request.
Source: Bloomberg, Goldman Sachs Global Investment Research

Data available on request.
Source: Goldman Sachs Global Investment Research

Data available on request.
Source: Goldman Sachs Global Investment Research

Data available on request.
Source: Goldman Sachs Global Investment Research

Market Forecasts

Data available on request.
Source: Haver Analytics, Goldman Sachs Global Investment Research
  1. 1 ^ For a discussion of carbon taxes as the most efficient solution, see Jeff Currie and Damien Courvalin, in “Investing in Climate Change 2.0”, Top of Mind, December 13, 2021.
  2. 2 ^ The Network for Greening the Financial System (NGFS) is a network of central banks (including the Fed and the ECB) and financial supervisors that shares best practices for responding to climate change. See also Naohiko Baba, ‘Net Zero and Japan's Economy: Unpacking Standardized Simulation Results’, Japan Economics Analyst, 4 January 2022.
  3. 3 ^ Germany has two systems of effective carbon taxation: the European Emission Trading System and the new National Emission Trading System. We use the latter since the targeted heating and transport industries are more relevant for consumer prices.
  4. 4 ^ This pass through assumption is standard in the economics literature. It could reflect highly elastic long-run supply in competitive (commodity) markets.
  5. 5 ^ Our estimate of a 2½% share of oil, gas, and coal inputs in total US PCE expenditures is somewhat smaller than estimates for oil and gas of 2.85% in Hobijn (2008) and of 3.9% in Hale et al (2012) based on older input-output tables. See Bart Hobijn, “Commodity Price Movements and PCE Inflation.” FRB New York Current Issues in Economics and Finance 14-8, November 2008, and Galina Hale, Bart Hobijn, and Rachna Raina. 2012. “Commodity Prices and PCE Inflation”, Economic Letters, Federal Reserve Bank of San Francisco, 7 May 2012, and Ronnie Walker, “The Growth and Inflation Consequences of Higher Energy Prices”, US Daily, 19 October 2021.
  6. 6 ^ For more details on the “Net Zero 2050” and the “Delayed Transition” NGFS scenarios, see here.

Investors should consider this report as only a single factor in making their investment decision. For Reg AC certification and other important disclosures, see the Disclosure Appendix, or go to www.gs.com/research/hedge.html.