Core CPI inflation has continued to surprise to the upside on net, with core CPI beats in each of the last two months and four of the last six reports. Additionally, the magnitude of these upside surprises is beginning to rival those of the 1960s overheating and 1970s stagflation. This raises the question of whether forecasters have simply been surprised by a strikingly long chain of unforeseen supply-side problems, or whether consensus inflation forecasts are missing something important.
Analyzing consensus inflation surprises over the last 75 years using the Livingston survey, we find that forecasters on average failed to incorporate the signal from short-term consumer inflation expectations, business inflation expectations, and the jobs-workers gap. This suggests that today’s models might also be underestimating the significance of these factors.
We test these variables in our component-level inflation models, finding significance in nearly half of the categories. Our models also continue to include (1) measures of labor and product market slack; (2) indicators related to pass-through from commodity, import, and asset prices; and (3) alternative price indices available from non-government sources.
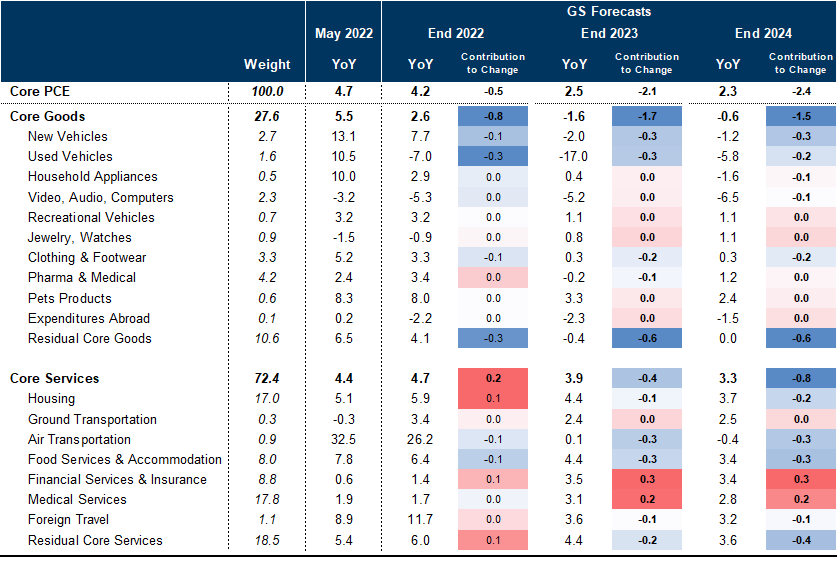
We are raising our year-end core PCE inflation forecasts for 2022-2024 to 4.2%, 2.5%, and 2.3% respectively (vs. 4.0%, 2.3%, and 2.2% previously, and compared to 4.7% in May). This reflects additional upward pressure in cyclical services categories like household maintenance, personal care, and food services and accommodation. However, we are leaving our 2023 and 2024 shelter inflation forecasts unchanged despite the May price spike because alternative rent measures are already slowing and the May geographic cross-section is consistent with a one-off boost from the reversal of pandemic discounts.
We also introduce a new bottom-up core CPI model, which we will update alongside our PCE forecasts in our Monthly Inflation Monitor. Unlike the PCE measure, we expect year-on-year core CPI inflation to reaccelerate in late summer—from 6.0% in May to 6.3% in September—before falling to 5.5% at year-end, 2.4% in December 2023, and 2.6% in December 2024 (vs. 5.1%, 2.6%, and 2.6% previously).
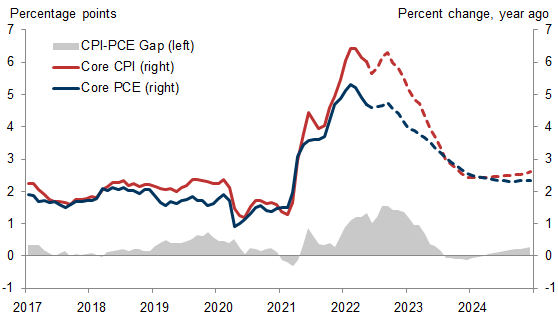
As we highlighted last fall, the CPI-PCE gap will be much larger than usual this year because of the larger weights on the shelter and durable goods categories and differences in the measurement of health care inflation. However, we continue to expect the gap to narrow beyond this fall, when durable goods prices should start to normalize and the CPI’s health insurance category should transition from very strong to very weak as new annual source data are incorporated.
Back to the Future: Forecasting Inflation When Expectations Are Evolving
Exhibit 1: Large and Persistent Core Inflation Surprises Reminiscent of the 1960s Overheating and 1970s Stagflation
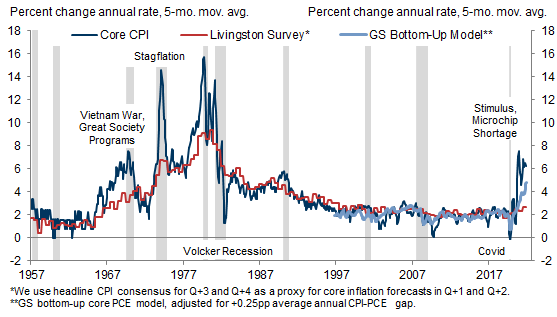
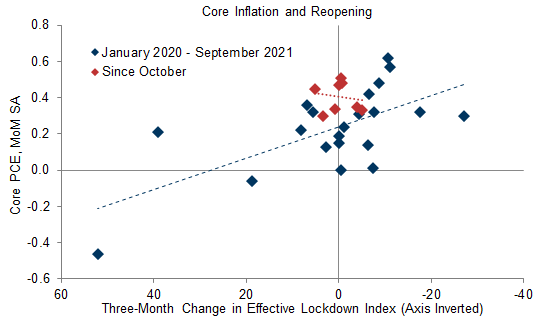
Exhibit 2: Reopening Contributed to Higher Prices Last Year but Can’t Explain Most of the Recent Strength
What to Expect When You're Expecting High Inflation
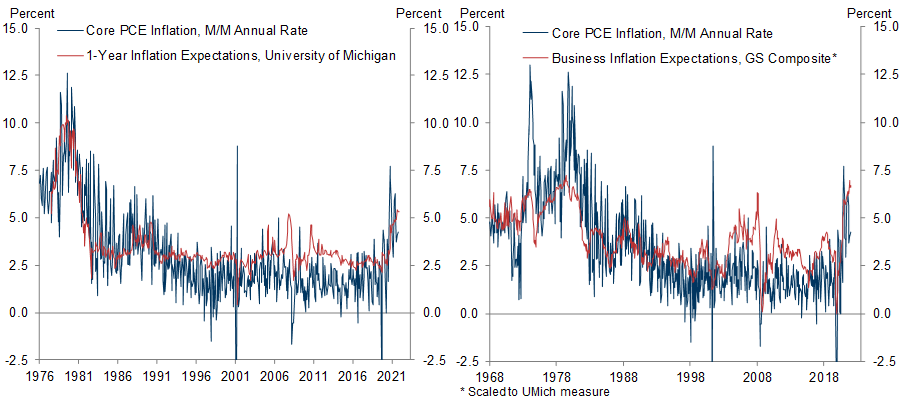
Exhibit 3: Short-Term Inflation Expectations Are Elevated, but Long-Term Expectations Have So Far Risen More Modestly
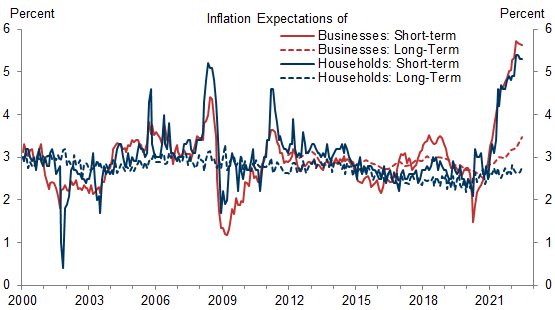
Exhibit 4: Inflation Expectations Surveys Could Have Prevented Some of the Post-War Inflation Forecast Errors
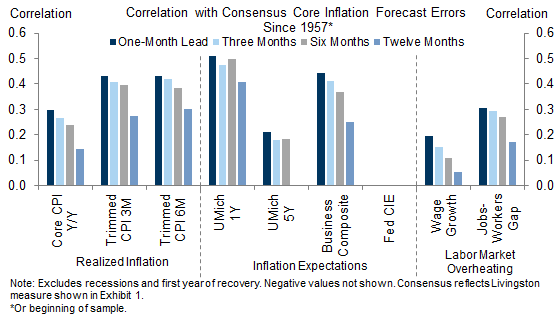
Exhibit 5: Inflation Expectations Surveys Are Helpful Guideposts of the Current Trend in Core Inflation
Updating Our Bottom-Up Core PCE Model
Exhibit 6: Near-Term Inflation Expectations Are Additive in Nearly Half of Our Category-Level Models
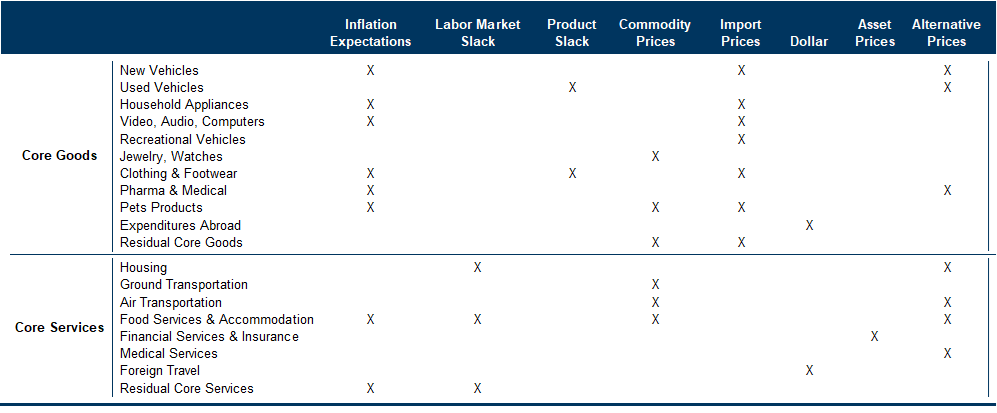
Exhibit 7: We Forecast Core PCE to Remain Above 4% Throughout 2022 Before Falling to 2.5% in December 2023 and 2.3% in December 2024
A Hot Summer for Core Inflation and the CPI-PCE Gap
Exhibit 8: We Forecast Core CPI at 5.5% in December 2022, 2.4% in December 2023, and 2.6% and in December 2024
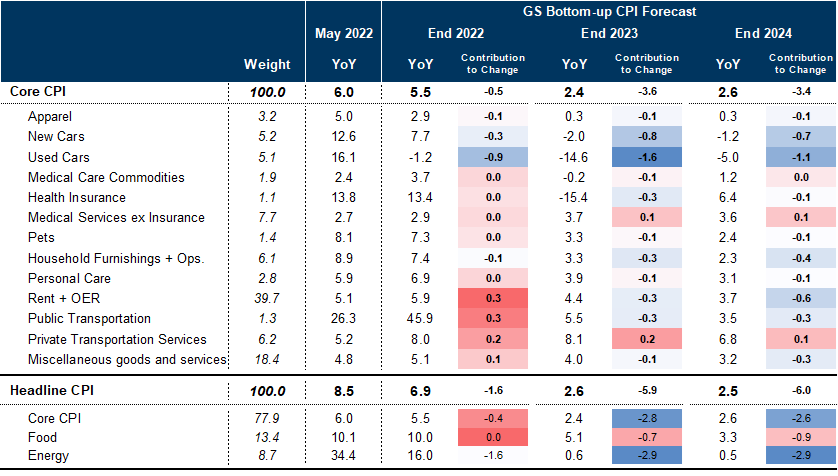
Exhibit 9: Monthly Shelter Inflation Overshot Alternative Measures in May—and Those Measures Were Already Decelerating
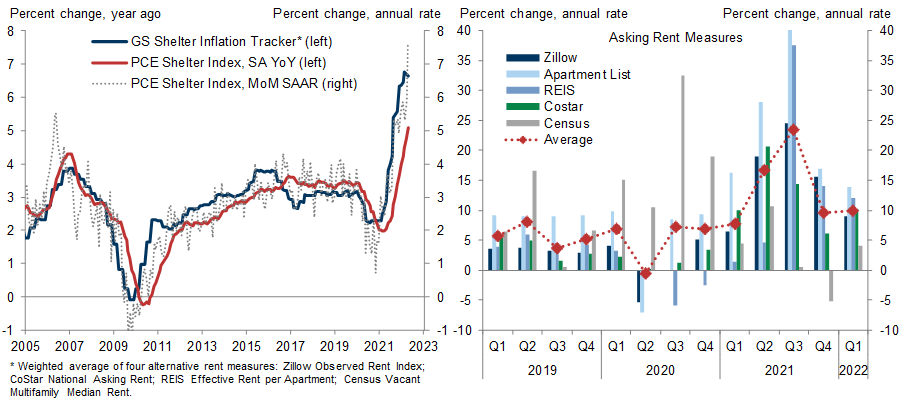
Exhibit 10: Health Insurance CPI Tailwind to Reverse Starting This Fall
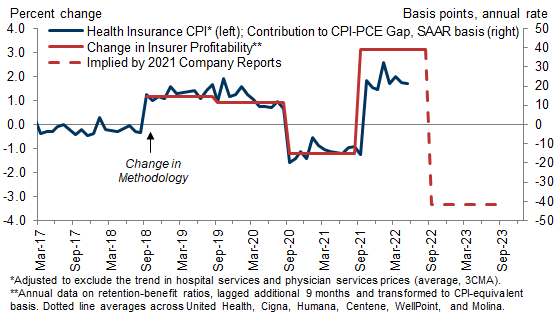
Exhibit 11: CPI-PCE Gap to Widen Further This Summer, Disappear in December 2023 as Health Insurance CPI Swings Negative and Auto Prices Fall
Spencer Hill
Ronnie Walker
Manuel Abecasis
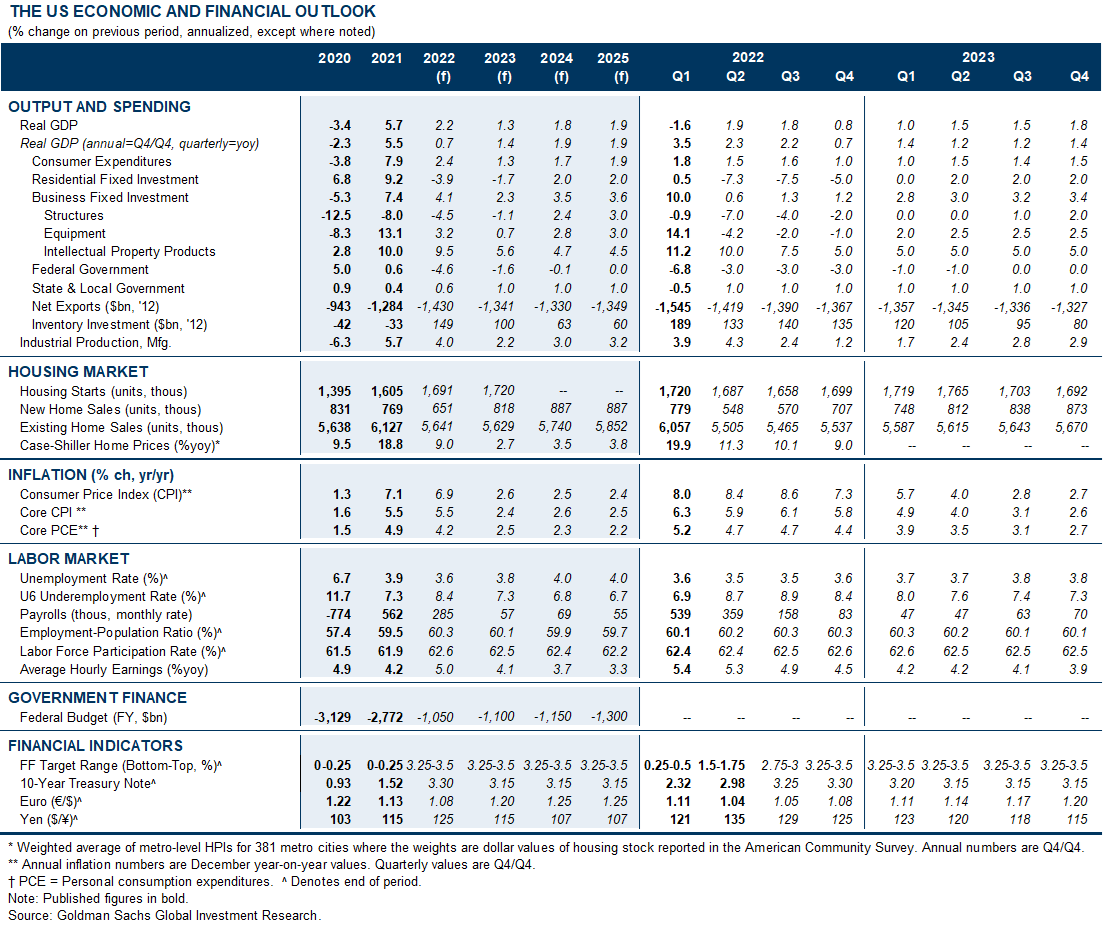
The US Economic and Financial Outlook
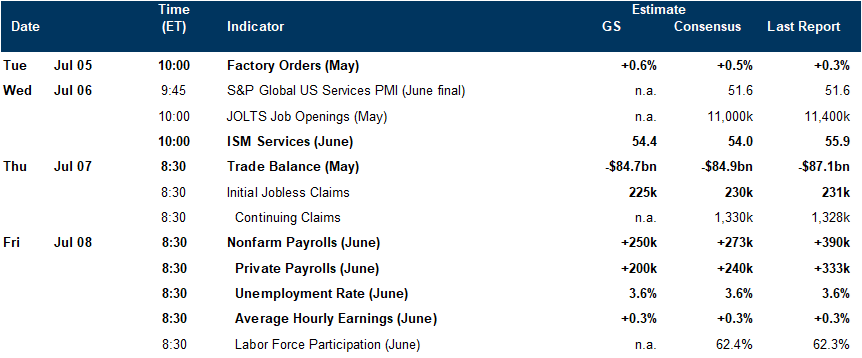
Economic Releases
- 1 ^ The survey collects data only on headline inflation, and respondents generally incorporate the recent path of oil and food prices into their forecasts of near-term inflation. Accordingly, we construct a proxy for core CPI consensus using the headline CPI forecast for quarters Q+3 and Q+4—for which the recent path of commodity prices is often a secondary or minor factor from a forecasting perspective. We find broadly similar results when replicating our analysis using headline CPI consensus, except generally lower correlations with realized inflation.
- 2 ^ We also cannot rule out the risk that elevated realized inflation leads short-and long-term inflation expectations even higher, particularly if the labor market continues to overheat.
- 3 ^ The lag structure for dependent variables differs by category based on statistical and economic significance.
Investors should consider this report as only a single factor in making their investment decision. For Reg AC certification and other important disclosures, see the Disclosure Appendix, or go to www.gs.com/research/hedge.html.