Goldman Sachs Research
US Economics Analyst
Why Depressed Sentiment, Bank Stress, and Empty Offices Won’t Derail Capex Growth (Walker)
10 July 2023 | 8:58PM EDT | Research | Economics| By Jan Hatzius and others
More
  • Business investment has grown a solid 3½% over the last year, defying consensus forecasts for the sharp declines usually seen in recessions. However, weak business sentiment, banking stress, and falling office investment threaten to slow capex growth going forward. In this note, we assess the outlook and discuss how these three headwinds will affect capex.

  • First, forward-looking survey measures of capital spending expectations have fallen to their lowest levels since the financial crisis and are currently in contractionary territory. However, hard indicators on spending plans have not fallen as sharply, and a tracker based on capex-specific hard data—which has historically been a better predictor of realized capex than a soft data equivalent—has remained in expansionary territory throughout this year.

  • Second, the Fed’s H.8 release indicates that bank lending to businesses has stagnated in recent weeks. The slowdown in bank lending poses an acute threat to structures investment, as commercial real estate is particularly exposed to bank lending, and academic research suggests that alternative financing options can be several hundred basis points more expensive. But reassuringly, small businesses report in the NFIB survey that they have not had a harder time accessing credit since the bank failures.

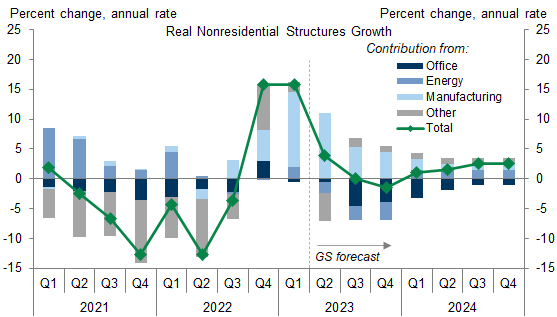
  • Third, the fundamental backdrop for some segments of structures investment remains weak. Office investment is likely to fall further because office vacancy rates have continued to increase sharply, and guidance from energy companies suggests that oil and gas investment will continue to decline. However, strong investment in domestic manufacturing incentivized by the CHIPS Act and the Inflation Reduction Act should at least partly offset these headwinds. Over the last two years, companies have pledged to spend $365bn in new semiconductor and battery investments, of which we estimate less than one-fourth has been spent.

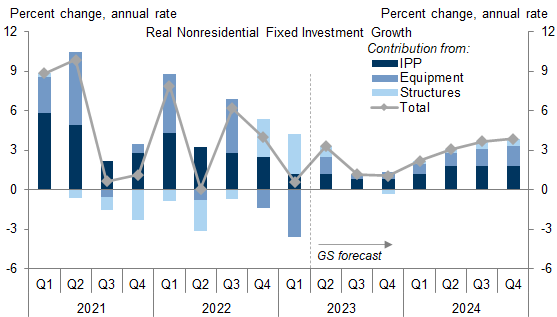
  • Structures investment growth looks likely to turn slightly negative after increasing 3.1% over the last year. Equipment investment growth is likely to rebound after a 1.2% decline last year as the drags from tighter financial conditions and fears of imminent recession fade. Intellectual property product investment looks likely to slow from the +6.2% pace of the last year, as company guidance suggests businesses are limiting growth in IT investments amid uncertainty about the economic outlook and after pulling forward demand in the immediate aftermath of the pandemic.

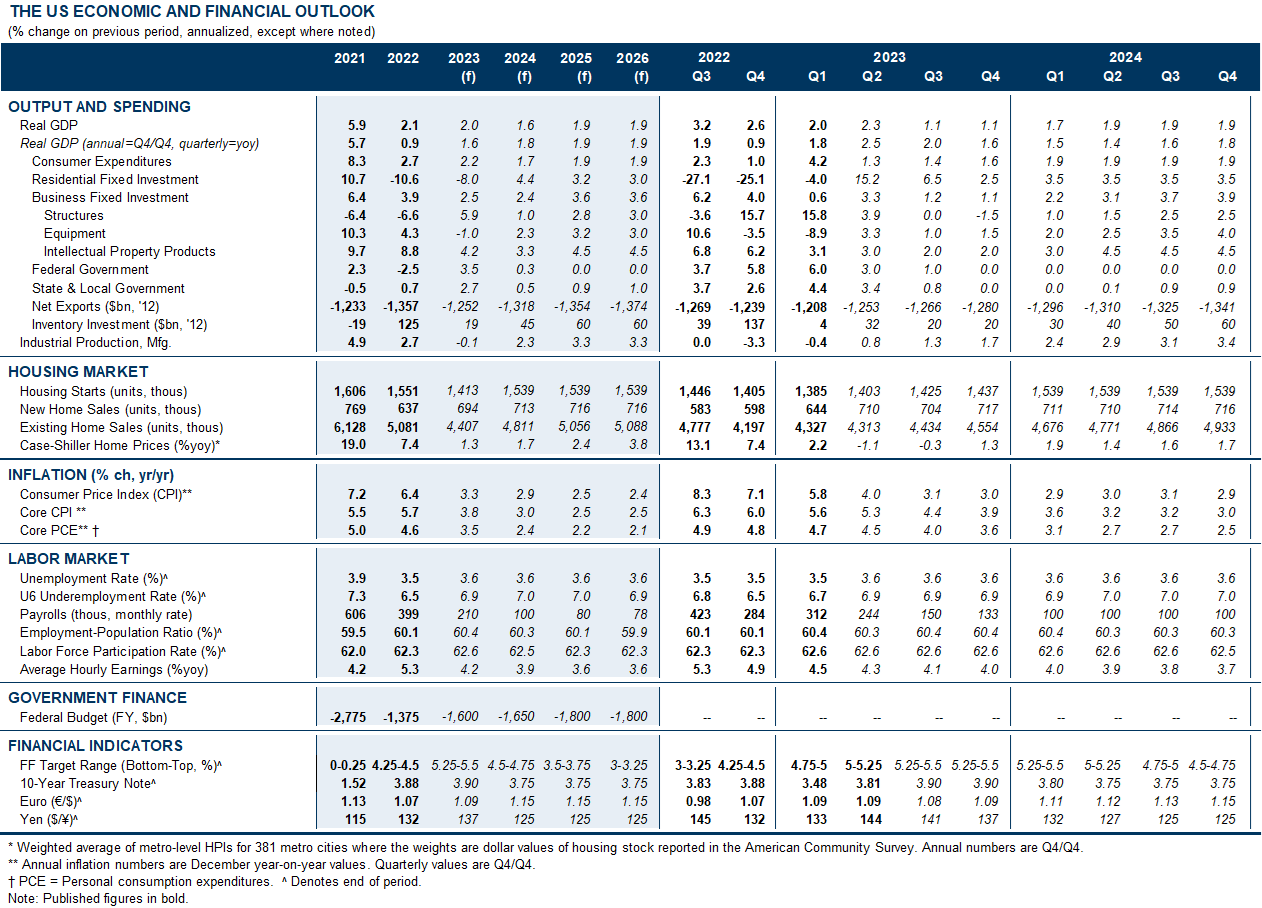
  • Taken together, we expect that business fixed investment growth will slow from a +2% annualized growth rate in 2023H1 to a roughly +1% annualized rate in 2023H2, before rebounding to a +3% rate in 2024. We now expect GDP growth of 2.3%/1.1%/1.1% in 2023Q2-Q4. Our new path translates to 2023 GDP growth of 2.0% on a full-year basis (vs. consensus of 1.3%) or 1.6% on a Q4/Q4 basis.

Why Depressed Sentiment, Bank Stress, and Empty Offices Won’t Derail Capex Growth

Business investment has grown a solid 3½% over the last year (GS tracking for Q2), defying consensus forecasts for the sharp declines historically seen in recessions. However, weak business sentiment, banking stress, and falling office investment threaten to slow capex growth going forward. In this note, we assess the outlook and discuss how these three headwinds will affect capex.

A Tale of Three Headwinds

First, forward-looking survey measures of capex have fallen to their lowest levels since the financial crisis, pushing our capex tracker to roughly -5%. However, business surveys have been sending misleading signals about the economy over the last few years, and hard data on spending plans (for example, the number of commercial buildings entering planning stages tracked by Dodge Analytics; see Exhibit 7 here) have not fallen as sharply. The right panel of Exhibit 1 shows versions of our capex tracker based solely on soft or hard indicators. While the soft version currently signals contraction, the hard version has remained in expansionary territory throughout this year. A regression-based horse race of those series suggests that putting a 75% weight on hard data and a 25% weight on soft data provides the best explanation of near-term capex growth in the national accounts.

Exhibit 1: Our Capex Tracker Has Fallen to Contractionary Levels, Reflecting Weaker Survey Data

1. Our Capex Tracker Has Fallen to Contractionary Levels, Reflecting Weaker Survey Data. Data available on request.
Source: Department of Commerce, Goldman Sachs Global Investment Research
Second, the Fed’s H.8 release indicates that bank lending to businesses has slowed steadily over the last year and stagnated in recent weeks (Exhibit 2). The slowdown in bank lending poses an acute threat to structures investment because commercial real estate is particularly exposed to bank lending.

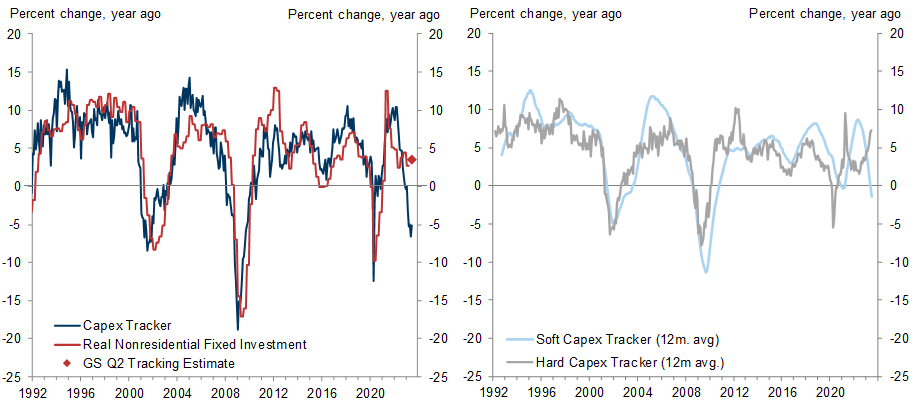
Exhibit 2: CRE and C&I Lending Have Slowed Steadily Over the Last Year

2. CRE and C&I Lending Have Slowed Steadily Over the Last Year. Data available on request.
Source: Federal Reserve Board, Goldman Sachs Global Investment Research
Alternative financing options for businesses unable to borrow from banks are likely more expensive. Academic research suggests that, after controlling for firm and loan characteristics, nonbank loans for mid-sized public companies typically carry interest rates that are roughly 200 basis points higher than those of bank loans.[1] The same research suggests that nonbank lenders originate roughly 30% of loans (or 15% on a value-weighted basis) to mid-sized public companies, with finance companies unaffiliated with banks originating the largest share of nonbank loans (23%), and smaller shares being originated by private equity and venture capital firms (19%), hedge funds (16%), bank-affiliated finance companies (13%), investment banks (10%), investment managers (8%), and insurance companies (6%).

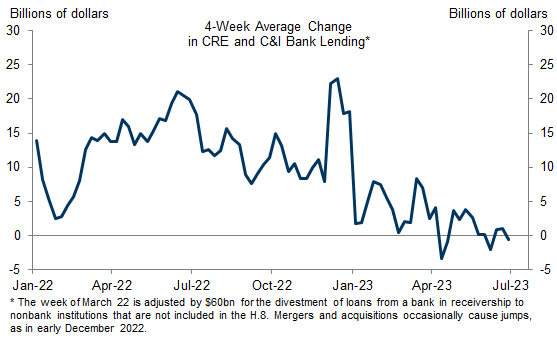
Exhibit 3: Nonbank Loans Can Be Substantially More Expensive Than Bank Loans

3. Nonbank Loans Can Be Substantially More Expensive Than Bank Loans. Data available on request.
Sergey Chernenko, Isil Erel, and Robert Prilmeier, “Nonbank Lending,” 2018.
Nevertheless, academic research suggests that an increase in the cost of capital is likely to be a manageable headwind for business investment. Surveys of CFOs find that firms’ investment hurdle rates are surprisingly insensitive to the cost of capital, and economic studies often fail to find an empirical relationship between interest rates and investment.[2] The upshot is that if some firms cannot access bank loans but are still able to find alternative funding sources, many might borrow and invest anyway despite the higher financing costs. After all, capex has continued to grow even as the federal funds rate has increased by 500bp over the last year. And reassuringly, the most recent NFIB survey of small businesses suggests that the availability of loans has not meaningfully changed relative to before the recent banking stress.
Third, the fundamental backdrop for office, energy, and retail structures investment remains weak. Investment in office structures has declined at a 12% annualized rate over the past three years, and spare office capacity remains high, as the share of the workforce working remotely remains above pre-pandemic levels. The most recent Business Response Survey indicated that 54% of private-sector establishments in industries with a greater share of office workers had employees that teleworked at least some of the time (vs. 41% pre-pandemic).[3] Data on office vacancy rates, which lead office investment, points to sharper declines ahead (Exhibit 4), and the recent underperformance of office real estate could make banks particularly averse to lending to new projects. We expect office investment to fall an additional 30% cumulatively by the end of 2024. With offices representing just under 15% of structures investment, such a decline would impose a 3pp annualized drag on overall structures investment growth through the end of next year.

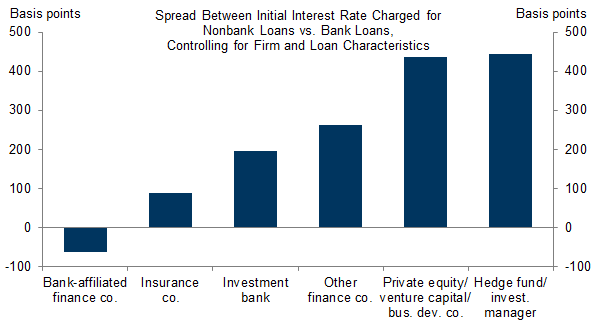
Exhibit 4: Office Investment Is Likely to Fall Further as Firms Continue to Adapt to the New Remote Work Environment

4. Office Investment Is Likely to Fall Further as Firms Continue to Adapt to the New Remote Work Environment. Data available on request.
Source: Department of Commerce, CoStar, Goldman Sachs Global Investment Research
Additionally, guidance from energy companies suggests that oil and gas structures investment is set to decline this year, reflecting the recent declines in energy prices and a continued reluctance to invest following lackluster returns last cycle and amidst regulatory uncertainty (Exhibit 5).

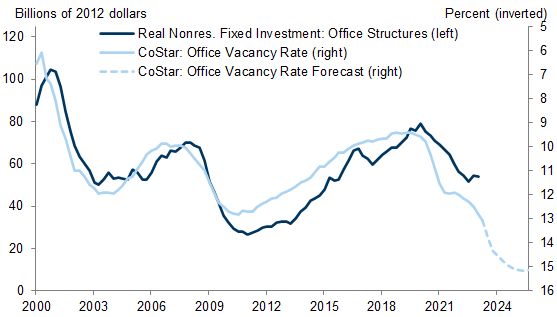
Exhibit 5: Guidance from US Energy Producers Suggests Weaker Energy Structures Capex This Year

5. Guidance from US Energy Producers Suggests Weaker Energy Structures Capex This Year. Data available on request.
Source: Department of Commerce, Company data, Goldman Sachs Global Investment Research
Nevertheless, continued strength in manufacturing structures investment—which has grown at an average annualized rate of 43% over the last three quarters on the back of investment in battery and semiconductor facilities—should at least partly offset these headwinds to structures investment. The White House reports that companies have pledged $365bn of new battery and semiconductor investments over the last two years (and almost $500bn across the sectors that would benefit most from the Inflation Reduction Act and CHIPS Act; Exhibit 6). So far, only $90bn of investment has been tallied in the relevant construction spending category for battery and semiconductor facilities since the start of 2021, suggesting that the level of spending could remain elevated for quite some time (the current monthly annualized rate stands at $112bn vs. ~$10bn two years ago, or 0.40% of annual GDP vs. 0.05% of GDP).

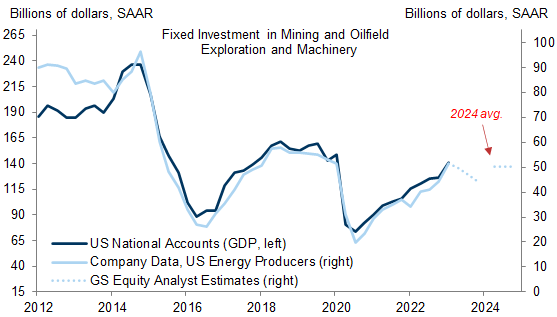
Exhibit 6: Almost $500bn in New Semiconductor, Electric Vehicle, Battery, and Clean Energy Investments Have Been Announced Over the Last Two Years

6. Almost $500bn in New Semiconductor, Electric Vehicle, Battery, and Clean Energy Investments Have Been Announced Over the Last Two Years. Data available on request.
Source: White House
Taken together, we expect nonresidential structures investment growth of -0.75% annualized on average in H2, which is a notable slowdown vs. the +3% pace of the last year but an upgrade from our previous forecast.

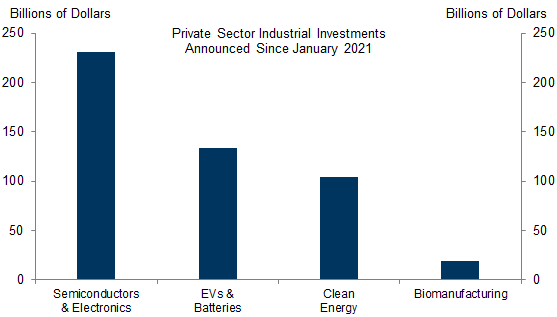
Exhibit 7: We Expect an Outsized, Albeit Shrinking, Growth Contribution from Manufacturing Structures Investment to Offset a Drag From Falling Office Investment in Coming Quarters

7. We Expect an Outsized, Albeit Shrinking, Growth Contribution from Manufacturing Structures Investment to Offset a Drag From Falling Office Investment in Coming Quarters. Data available on request.
Source: Department of Commerce, Goldman Sachs Global Investment Research

Equipment Rebounds First, Then IPP

To forecast equipment investment excluding energy, we rely on a statistical model that incorporates changes in our financial conditions index, lagged consumption growth, corporate cash flows, forward-looking expectations of demand such as consensus growth forecasts, and survey measures of forward-looking company expectations. Our model suggests that equipment investment growth is likely to rebound from a -1.2% decline over the last year, because the drag from tighter financial conditions is waning, expectations for demand growth are likely to improve, and recession fears are starting to abate. We expect overall equipment investment to grow at a +1.25% annualized pace in H2 before rebounding further next year (+3% in 2024 Q4/Q4).

Exhibit 8: Our Equipment Investment Model Suggests Growth Should Gradually Rebound Through the Start of Next Year

8. Our Equipment Investment Model Suggests Growth Should Gradually Rebound Through the Start of Next Year. Data available on request.
Source: Department of Commerce, Goldman Sachs Global Investment Research
Intellectual property product (IPP) investment—which has driven much of the strength in overall capital spending over the last two years as companies adapted to new working arrangements—looks likely to slow from the +6.2% pace of the last year. The most recent GS IT Spending Survey—which surveys CIOs about spending intentions—fell to its lowest level since the start of the pandemic, with most companies indicating they intend to slow growth in both total IT and IT hardware spending this year. Company guidance suggests that the expected slowdown reflects uncertainty about the economic outlook and some payback from spending that was pulled forward over the last two years. We expect IPP investment to grow at a +2% annualized rate in H2 before rebounding next year (+4% in 2024 Q4/Q4).

Exhibit 9: The GS Spending Survey Points to Below Trend IT Investment This Year

9. The GS Spending Survey Points to Below Trend IT Investment This Year. Data available on request.
Source: Department of Commerce, Goldman Sachs Global Investment Research
While investment in artificial intelligence poses an upside risk to the long-run capex outlook, we expect the impact over the next year to be muted.
Combining our forecasts for the three components of nonresidential fixed investment, we forecast that growth will slow from a +2% annualized rate in 2023H1 (using our tracking estimates for Q2) to a roughly +1% annualized rate in 2023H2, before rebounding to a +3% rate in 2024.
Revisions to our capital spending path and some minor adjustments to our residential fixed investment forecast now imply a GDP growth path of 2.3%/1.1%/1.1% in 2023Q2-Q4. Our new path translates to 2023 GDP growth of 2.0% on a full-year basis or 1.6% on a Q4/Q4 basis.

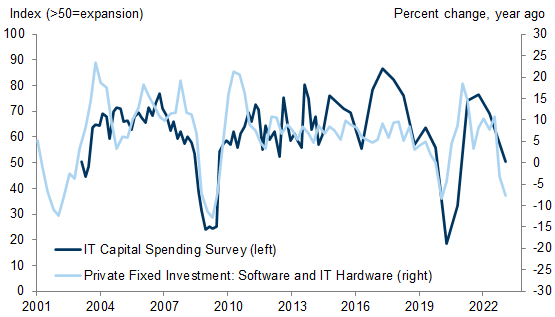
Exhibit 10: We Expect Capex to Grow 1.5% in 2023 and 3.2% in 2024 (Q4/Q4)

10. We Expect Capex to Grow 1.5% in 2023 and 3.2% in 2024 (Q4/Q4). Data available on request.
Source: Department of Commerce, Goldman Sachs Global Investment Research

Ronnie Walker

The US Economic and Financial Outlook

Data available on request.
Source: Goldman Sachs Global Investment Research
  1. 1 ^ Sergey Chernenko, Isil Erel, and Robert Prilmeier, “Nonbank Lending,” 2018.
  2. 2 ^ John Graham, “Presidential Address: Corporate Finance and Reality,” 2022.
  3. 3 ^ We are reporting an employment-weighted rate across the information, financial services, and professional and business services industries.

Investors should consider this report as only a single factor in making their investment decision. For Reg AC certification and other important disclosures, see the Disclosure Appendix, or go to www.gs.com/research/hedge.html.