Goldman Sachs Research
Global Markets Analyst
DM Debt - How to Move Mountains (Cole/Grut)
Table of Contents
11 September 2023 | 8:46PM BST | Research | Economics| By George Cole and others
More
  • With public debt-to-GDP levels in developed markets at multi-decade highs, the recent rise in inflation and policy rates is refocusing attention on debt dynamics as interest costs increase and fiscal policy adjusts following the pandemic.

  • Using a debt accounting exercise, we show that periods of sustained debt reduction are typically driven by strong primary balances and above-average growth. Following 1980, inflation has played little role in debt reductions.

  • Current fiscal projections and current market interest rates on average do not point to declines in debt-to-GDP ratios across DMs. We estimate that market implied r - g, the difference between real interest rates and growth rates, is now positive for many countries.

  • Japan provides an example of high debt peaceably coexisting with low interest rates. However, given current high inflation, wider deficits, and rising interest costs, we think it unlikely that we return to the era of structurally low interest rates in the US, UK or Europe. As a result, we see the risks to term premia skewed higher as fiscal risks simmer.

Public debt-to-GDP levels in developed markets are at multi-decade highs and are well above historical averages following successive shocks from the 2008 financial crisis to the pandemic to the invasion of Ukraine (Exhibit 1). Normative judgements about the ‘right’ or ‘safe’ level of government debt are contested, but the period of low interest rates following the 2008 financial crisis suggested that high debt levels may not constrain fiscal space, and have posed less risk than previously thought (see for example Blanchard and Summers). However, the recent rise in inflation and interest rates has returned focus on the implications of high debt burdens and whether or not they do constitute a risk, and whether they can be reduced. To understand the feasibility of reducing debt, we analyse the dynamics of developed market debt historically, and provide an accounting of debt ratio changes over time.

Exhibit 1: DM debt ratios near historical highs

Average debt ratios across DMs
1. DM debt ratios near historical highs. Data available on request.
Source: IMF, Goldman Sachs Global Investment Research

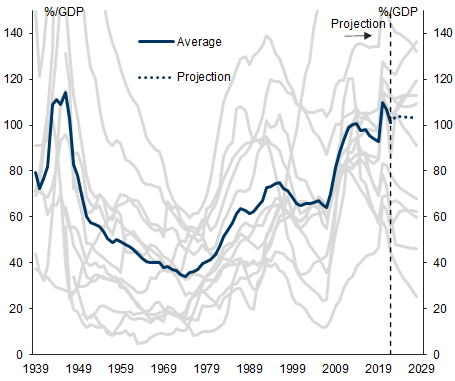
Exhibit 2: From tailwind to headwind: r - g is rising

Real interest rate - growth rate differential
2. From tailwind to headwind: r - g is rising. Data available on request.
Source: IMF, Goldman Sachs Global Investment Research
From tailwind to headwind: r – g
Debt-to-GDP ratios are a function of the primary balance, real growth rate, inflation rate, and nominal interest rates[1]. The conditioning environment for debt dynamics is described by r – g, where r is the ex post real interest rate and g is the real growth rate. If r – g is negative, then debt will fall, or could support a modest primary deficit. If r – g is positive, then debt ratios will rise in the absence of primary surpluses. In the immediate post-war period, r – g was negative due to a combination of low interest rates (including financial repression and capital controls), strong productivity growth, and unexpected inflation surprises (Exhibit 2). On average, this was also a period characterised by falling debt-to-GDP ratios. From the 1980s until 2000 r – g was positive, and debt began to rise. From 2000 onwards, r – g has typically been negative. Despite this tailwind, debt ratios have increased – on average by 40ppt of GDP since 2007 as governments have responded to successive shocks resulting in substantial primary deficits.
To show the dynamics behind these changes in debt and quantify the contribution from each macro factor, we follow the method of Hall & Sargent for 13 developed market countries over the last 150 years (full details in data appendix). We typically find that growth and inflation pull down debt ratios, with interest rates pulling them up – over long periods of time these forces generally offset. The primary balance shows the most variance, at times contributing to higher debt and at others to debt reduction. Our estimates naturally have a residual term given measurement errors, accounting changes or stock adjustments, but generally these remain small across the sample.

Exhibit 3: US and UK debt increases equal the accumulated primary balance. Japan has little help from inflation, Italy little help from growth.

Breakdown of change in debt-to-GDP ratio
3. US and UK debt increases equal the accumulated primary balance. Japan has little help from inflation, Italy little help from growth.. Data available on request.
Source: IMF, Goldman Sachs Global Investment Research
Exhibit 3 shows a panel of four country-level examples of the decomposition in the change of debt to GDP ratios since 1980. For the US and the UK, nominal growth (real growth + inflation) has been balanced by nominal rates, with the change in debt-to-GDP ratios corresponding to the accumulated impact of the government primary balance. Japan stands out for having not only a large accumulated deficit but also having a very small negative contribution from inflation. Italy in contrast has seen the downward impact of high inflation and a strong primary balance outweighed by high nominal interest rates. Also notable is Italy's small accumulated impact of real GDP growth given its history of weak growth outcomes.
Moving debt mountains: Strong primary balances required
Beyond the country level, where each country faces a unique combination of input variables over time, we can see patterns emerge on aggregate when debt ratios change. Exhibit 4 shows the average contribution to persistent increases (decreases) in debt ratios – defined as a change of 10ppts or more – from the primary balance, inflation, growth and nominal interest rates vs the unconditional sample average. During periods of debt ratio reduction we find primary balances are stronger than average, nominal rates are lower than average, and both real growth and inflation are higher than average – the latter three combine such that real interest rates are lower than average, as is r – g. During periods of persistent debt increases, the opposite occurs – larger deficits, higher nominal interest rates, lower growth and substantially lower inflation - this result is consistent with our previous work.

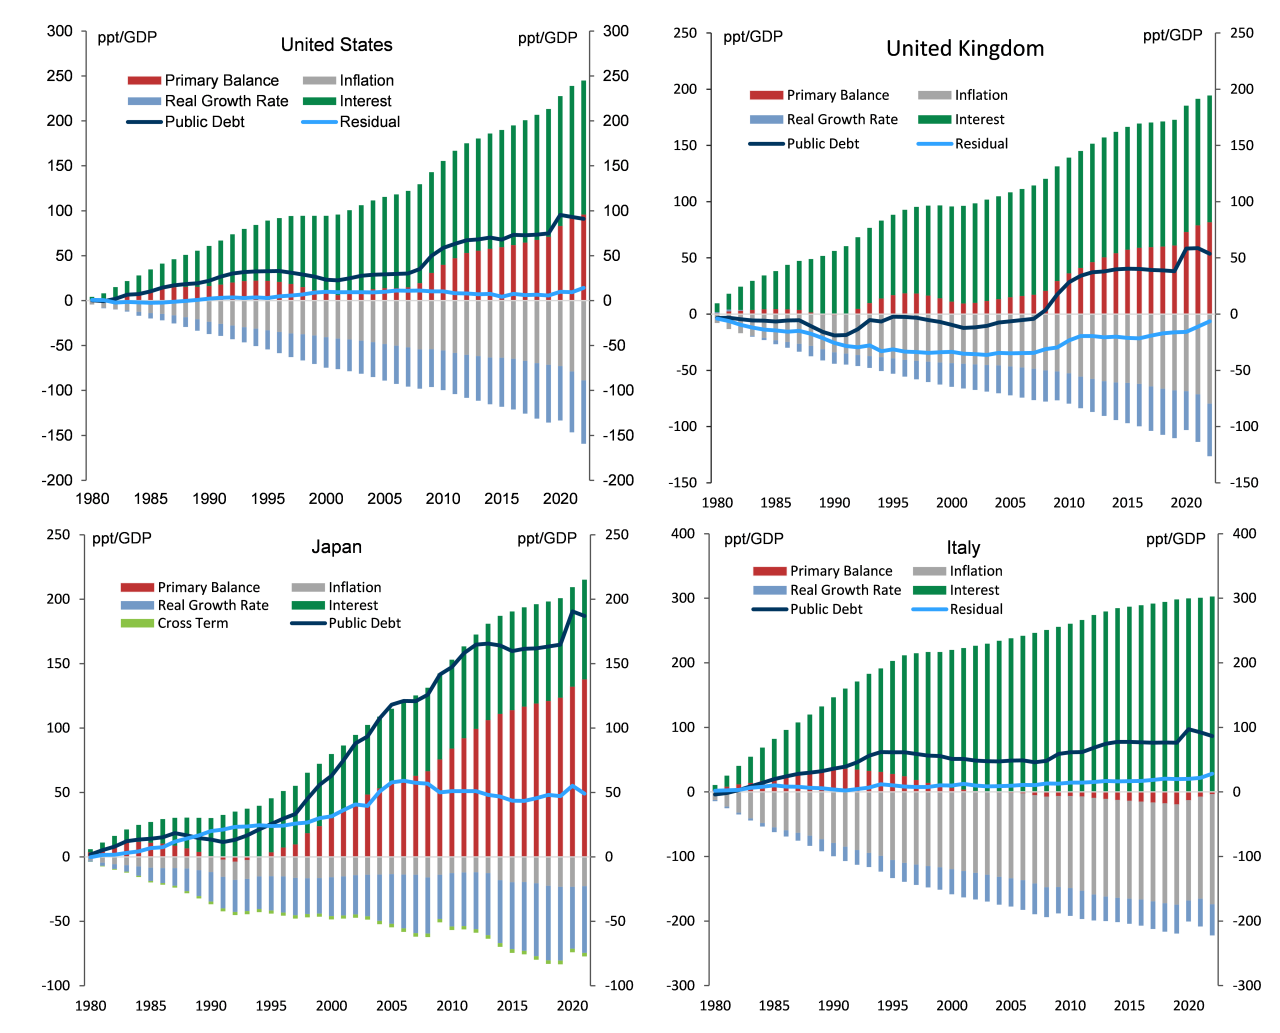
Exhibit 4: Debt reductions driven by strong primary balances, high growth and high inflation

Average contribution to 10ppt changes in debt ratios
4. Debt reductions driven by strong primary balances, high growth and high inflation. Data available on request.
Source: Goldman Sachs Global Investment Research
Splitting the sample in two at 1980 helps us to understand the differences between pre- and post-inflation targeting era. Exhibit 5 & Exhibit 6 show that persistent debt reductions before 1980 relied much more on lower interest rates and higher inflation. In contrast, after 1980, debt reductions were associated with much lower inflation but stronger fiscal balances. Persistent debt increases show the mirror image. This suggests that primary balances play a much larger role in determining changes in debt burdens post-1980, which is consistent with the notion that inflation volatility fell as a result of the Great Moderation, and thus neutering the impact of the inflation channel for debt dynamics.

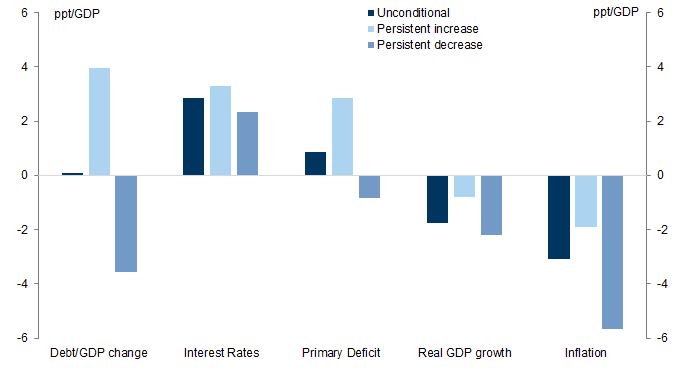
Exhibit 5: Debt reductions post-1980 primarily driven by stronger primary balances

Average contributions to debt reductions
5. Debt reductions post-1980 primarily driven by stronger primary balances. Data available on request.
Source: Goldman Sachs Global Investment Research

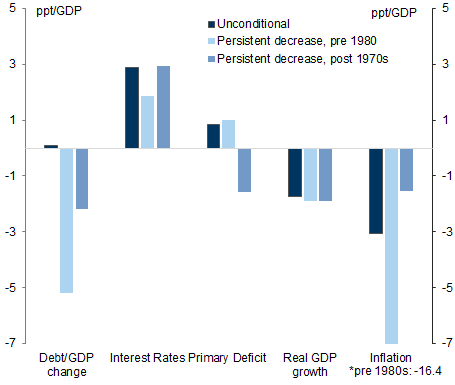
Exhibit 6: Debt increases post-1980 also driven by primary deficits

Average contribution to debt increases
6. Debt increases post-1980 also driven by primary deficits. Data available on request.
Source: Goldman Sachs Global Investment Research
Is the impact of the primary balance in reducing debt a matter of active policy choices, or simply good fortune resulting from better nominal growth? We replicate our analysis for government revenue and expenditure as a share of GDP. To do this, we adjust for the trend increase in government expenditure as a share of GDP for most countries in our sample since 1980. In periods of increasing public debt, we find expenditures rose significantly faster than the unconditional average, and in periods of declining public debt, public expenditure declined more than the trend would suggest (Exhibit 7). In contrast, revenues have seen less fluctuation than expenditures. Automatic stabilisers may explain some of the fluctuation in expenditure, however these results suggests that public policy choices are generally required to affect debt ratios via primary balances. However, it is notable that successful debt reductions typically occur alongside better-than-average growth, which would create an easier backdrop for fiscal adjustment. Indeed, it is this trade-off between fiscal tightening and growth that made limited the amount of debt consolidation in 2010-2012 in major economies.

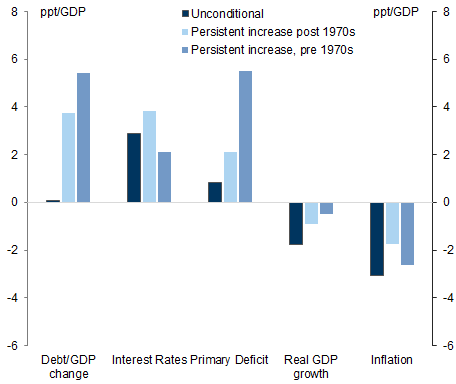
Exhibit 7: Public expenditure drives the fluctuations in primary balance

Trend changes in expenditure and revenue during persistent changes in debt-to-GDP
7. Public expenditure drives the fluctuations in primary balance. Data available on request.
Source: Goldman Sachs Global Investment Research
Challenging arithmetic on the current fiscal path
Our analysis suggests that in a regime of stable inflation, strengthening the primary balance is the main way to reduce debt burdens (although Italy shows it is a necessary but not sufficient condition). Current projections for primary deficits show a mixed picture across developed economies. European deficits are set to improve, at least according to stated government policy, on a multi-year horizon. In the US and Japan, deficits are set to remain wide. Taking these deficit paths, we can use market pricing for rates and consensus expectations for growth and inflation to roll forward the equation for the evolution of debt.
We find debt-to-GDP ratios at best fall gradually, but generally remain stable. In the case of the US and Japan, they increase substantially. As shown earlier in Exhibit 1, the developed market average debt-to-GDP ratio is unchanged on these projections in coming years. Moreover, it may be that these deficit paths are if anything too optimistic – as Arslanalp and Eichengreen argue, the political economy considerations after years of post-financial crisis and pandemic era pressures make a sustained tightening in fiscal policy unlikely.
We can also project r – g, across countries, according to the impact of rolling debt over the next five years on the current forward rates curve (Exhibit 8). Italy and the UK have the highest r – g, whereas despite high interest rates the US benefits from stronger growth expectations, leading to r – g only just positive. Japan, Germany, Australia and Canada have low levels of r – g. And finally, we can estimate the increase in interest costs as a share of GDP given these fundamental inputs (Exhibit 9). Here, the US sees the biggest increase – a function of high debt with low maturity, and high interest rates. Japan also sees a substantial change as do Italy and Spain. The UK shows a smaller increase given its already-high interest burden thanks to a high proportion of inflation index-linked debt, but also its long maturity of debt means limited rollover needs in coming years.

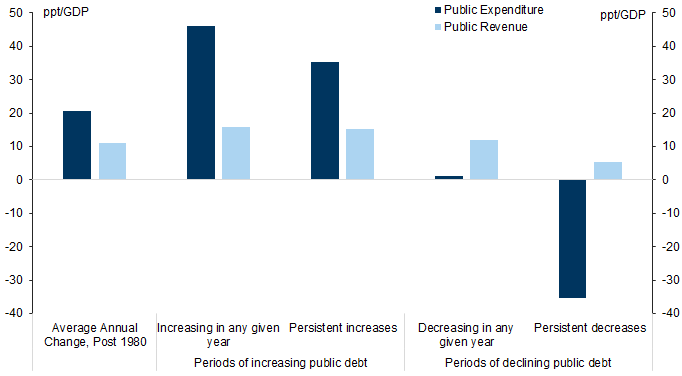
Exhibit 8: Market-implied r - g highest in European economies

Nominal forward WAM yield minus consensus growth and inflation forecasts
8. Market-implied r - g highest in European economies. Data available on request.
Source: Consensus Economics, Goldman Sachs Global Investment Research

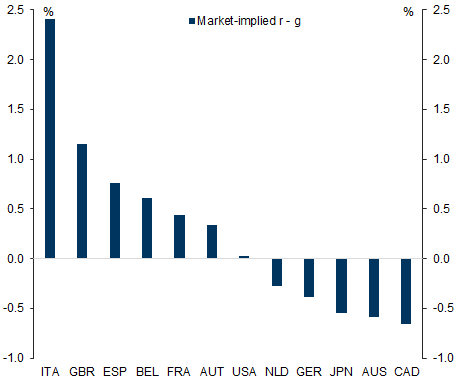
Exhibit 9: US will see largest rise in interest costs

5y change in interest costs / GDP using market rates and current debt profile
9. US will see largest rise in interest costs. Data available on request.
Japan's effective interest cost is less given the BOJ own around 50% of government debt, and currently set zero or negative rates on excess reserves. For other economies, high policy rates imply the effective interest bill on overall government liabilities is in fact larger due to QE. Current UK interest costs impacted by high rates of inflation and high share of index-linked debt.
Source: GS GIR
Can we all 'be' Japan?
To think about the market consequences of higher debt, we need to consider the country-specific factors that can drive different market outcomes. One possibility is that debt simply rises with little consequence, and that high debt ratios can peaceably coexist with low interest rates. This was the environment from 2008-2021 across most developed markets, and of course has characterised Japan for a much longer period.
For this to be an equilibrium, markets must be sufficiently pessimistic on growth and inflation outcomes to allow for low interest rates, and a low price of duration risk. The post-GFC environment was characterised by a deep cyclical downturn and balance sheet deleveraging, coupled with a rise in primary balances across the US, Europe and UK. This created a substantial demand shortfall in the economy, and the corresponding drop in interest rates sent r – g lower. In addition, it also created the inflationary environment in which central banks could drive yields and duration risk premium lower both through low (and sometimes negative) policy rates but also quantitative easing. These are macro conditions where investor demand for bonds is strongest.
Can we return to such a world? Demographics suggest that other countries, such as China (although not part of this exercise) and parts of Europe face similar dynamics to Japan. However, we are sceptical that economies such as the UK or US will return to such a low interest rate environment. Even Europe has demonstrated the capacity to generate (or be vulnerable to) enormous rates of inflation, and in cyclically adjusted terms is set to run a much looser fiscal stance than in the prior decade. As a result, we are sceptical that we will quickly return to the low rate environment that prevailed in Europe from 2014-2021.
Higher rates, higher term premium, steeper curves
The alternate possibility is that a combination of rising debt and loose fiscal policy leads to higher real rates and higher duration risk premium. This is because in the absence of a credible plan to improve primary balances, markets may worry that other means to reduce real rates are employed, such as unanticipated inflation or financial repression. Although the feasibility or cost-effectiveness of such policy approaches would be questionable, markets may need additional insurance against such risks.

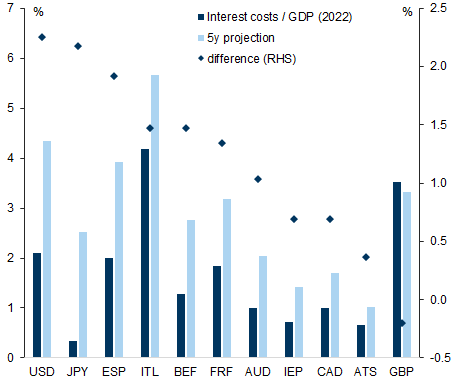
Exhibit 10: US and UK typically exhibit twin deficits

30 year average primary balance and current account
10. US and UK typically exhibit twin deficits. Data available on request.
Source: IMF, Goldman Sachs Global Investment Research

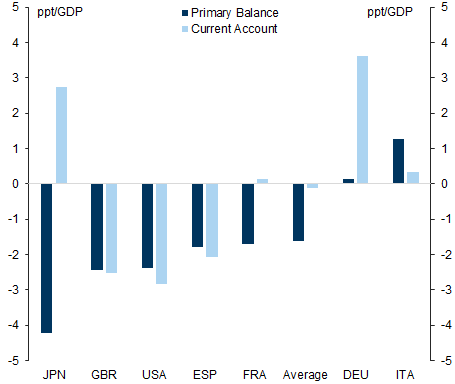
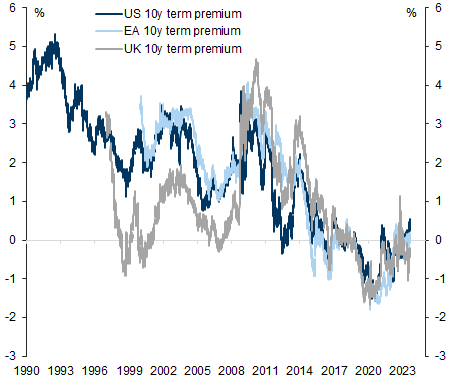
Exhibit 11: Global term premia remain low according to history

GS 10y term premium estimates
11. Global term premia remain low according to history. Data available on request.
Source: Goldman Sachs Global Investment Research
Higher rates are already pressuring government balances via increasing interest costs. Central banks acting to stabilise inflation – including through quantitative tightening – exacerbate this increase in rates, and simultaneously limit the ability for inflation to erode debt. Ultimately this risks a slow-motion collision between inflation targeting and high debt loads, where a loose fiscal stance skews inflation risk and thus interest rates to the upside until a fiscal correction arrests the process.
So which countries are likely to see this? Countries that have a track record of higher inflation, and limited appetite to run tighter fiscal policy seem most at risk - this macro combination would likley coincide with low invester demand for bonds. The combination of a high foreign ownership of debt and current account deficits are also likely risk factors. This suggests the US and UK are the most obvious candidates for a duration risk premium repricing. We have already seen one version of this story this cycle in the UK during the Truss government of September/October 2022, and we do think the UK term premium in Gilts is at risk of further correction higher. The recent rise in US term premium may have been exacerbated by summer liquidity but nonetheless reflects the asymmetry of with estimates of the term premium still at historically low levels.
On paper Europe has the most impressive plans for fiscal consolidation in future years, suggesting less need for substantial term premium repricing. However, compared with the previous decade Europe is also increasing its net bond supply substantially, and we continue to expect Bund risk premium to reprice higher. All this suggests that although we expect term premia repricing to be a gradual phenomena in response to fiscal risks, we think that current fiscal trajectories offer little comfort given current relatively low levels of duration risk premium. This suggests global term premia are biased higher.
George Cole and Sara Grut
The authors would like to thank Friedrich Schaper for his contribution to this note. Friedrich is an intern on the Global Markets team.

Appendix

Debt-to-GDP dynamics are described by the following equation:

Data available on request.
where d is the debt/GDP ratio, i is the nominal interest expense as a share of GDP, g is the real growth rate of the economy, p is the primary balance, excluding interest expense, as a share of GDP.
Data and references used include:
  • National sources and OECD collected via Haver Analytics

  • IMF data from Mauro, P., Romeu, R., Binder, A., & Zaman, A. (2016, December 31). A modern history of fiscal prudence and profligacy. IMF. https://www.imf.org/en/Publications/WP/Issues/2016/12/31/A-Modern-History-of-Fiscal-Prudence-and-Profligacy-40222

  • International Monetary Fund. (2015). Public Finances in Modern History [Dataset]. https://www.imf.org/external/datamapper/datasets/FPP

  • Reinhard Rogoff Dataset from Reinhart, C., & Rogoff, K. (2011). From financial crash to debt crisis. The American Economic Review, 101(5), 1676–1706. https://doi.org/10.1257/aer.101.5.1676

  1. 1 ^ Debt dynamics are also affected by stock adjustments, ranging from accounting classification to nominal debt restructuring; however, we set these aside in our analysis, and allow any such changes to be captured in the residual term.

Investors should consider this report as only a single factor in making their investment decision. For Reg AC certification and other important disclosures, see the Disclosure Appendix, or go to www.gs.com/research/hedge.html.