Borrowing costs surged in the wake of the Fed’s tightening campaign. We recently showed that the headwind for larger companies that will have to refinance their maturing debt at higher interest rates in coming years should be manageable. But how much should we worry about the impact on small businesses, which are generally more vulnerable to funding stresses and other economic shocks?
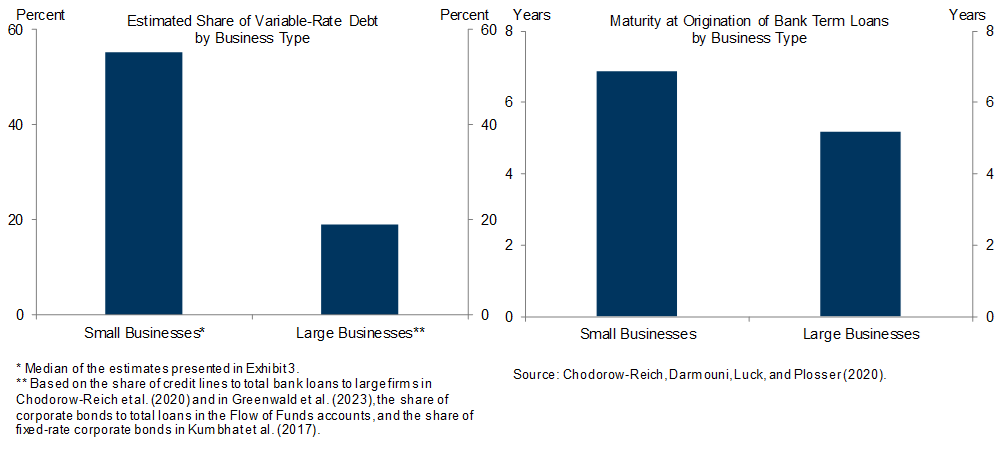
Small business financing differs from that of large corporations in two important ways. First, small businesses spend a larger share of revenues on interest payments—we estimate around 6% for small and 2% for large businesses in 2021. Second, while the average maturity of small and large business debt appears to be roughly similar, economic research finds that small business debt has a bimodal maturity profile: roughly half consists of credit lines, short-term loans, and other floating-rate debt (vs. 20% for large businesses), while the other half consists of term loans with 7-year average maturities when issued (vs. 5½-year for large firms).
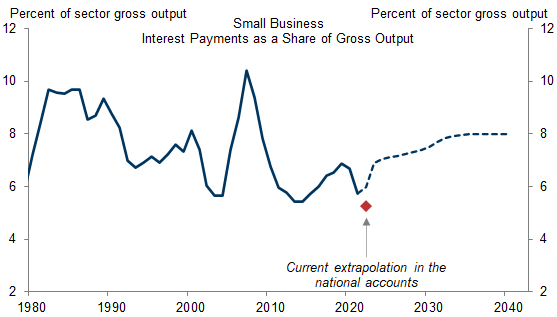
We forecast total small business interest expense by combining a top-down projection for floating-rate payments with a forecast for the fixed-rate segment using loan-level data from the Small Business Administration. We estimate that higher rates will increase the interest burden for small businesses by just over 1pp by 2024, from roughly 5.8% of revenues in 2021 to around 7% in 2024. Under our current rates forecasts, we forecast this share would increase further to just under 8% as term loans gradually mature—above the pre-pandemic share of 6.8% but similar to that of the mid-1990s.
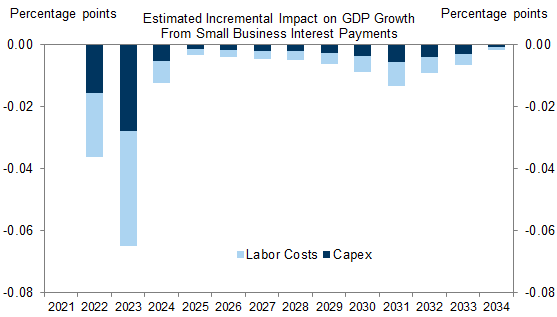
Combining these interest cost headwinds with our standing estimates of the modest sensitivity of employment and capital spending to interest rates, we estimate that the GDP growth drag from small business borrowing costs will peak this year at just 0.1pp. In our baseline, we forecast this growth headwind will wane in 2024 before rising modestly later in the decade as term loans are refinanced.
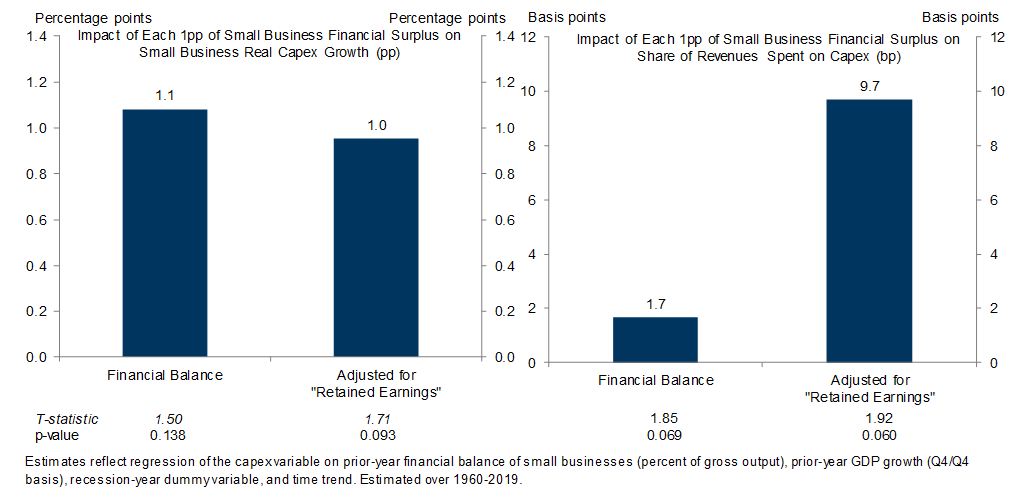
Moreover, we expect the strong financial footing of small businesses to partially offset the hiring and investment drag from higher interest payments. We estimate that the small business sector is running a financial surplus worth 9.1% of sector revenues and 2.5% of economywide GDP. This indicator is a statistically significant predictor of business investment and argues for a tailwind to capex growth of as much as +4pp in the sector. The sector’s balance sheet is healthy as well, with cash ratios and net worth ratios both near 40-year highs and interest income set to rise roughly 0.4pp cumulatively as a share of revenues, reflecting higher short-term interest rates.
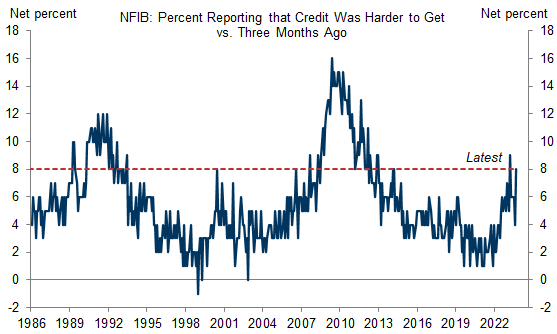
Where could we be wrong? One risk is that small businesses prove more sensitive to interest costs because of difficulty developing new banking relationships and difficulty accessing alternative sources of financing. Still, the share of businesses reporting that credit was harder to get relative to a few months ago stands at 8%—higher than before the pandemic but in line with the average share in the early 1990s.
The Impact of Higher Rates on Small Businesses
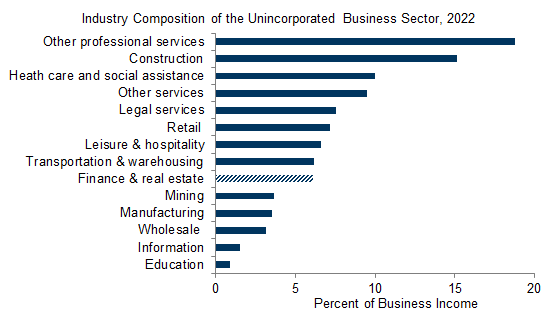
Exhibit 1: Professional and Personal Services, Construction, and Health Care Account for the Majority of the Small Business Sector
Twin Peaks: Characteristics of Small Business Debt
Exhibit 2: Small Businesses Spend a Larger Share of Revenues on Interest Than Corporations
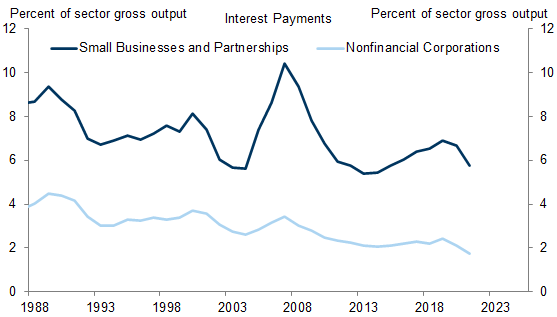
Exhibit 3: Roughly Half of Small Business Debt Has a Floating Rate
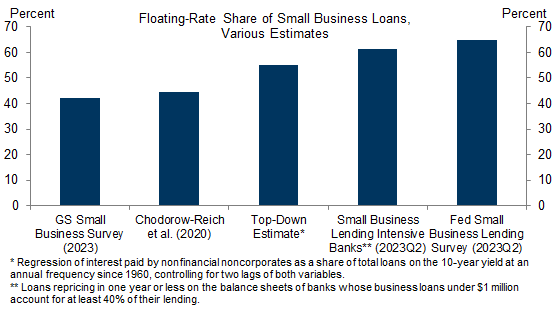
Exhibit 4: Small Business Debt Exhibits a Bimodal Maturity Profile, With Half of Loans Repricing Quickly but the Rest Repricing Every 7 Years
How Much Will Interest Costs Rise for Small Businesses?
Exhibit 5: We Estimate That Refinancing Maturing Term Loans Will Increase Small Business Interest Expense on These Loans by 25-30% Over the Next Decade
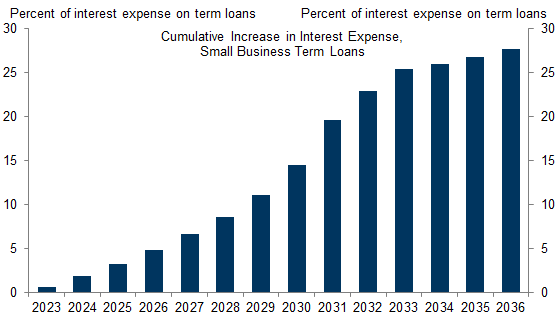
Exhibit 6: We Estimate That Small Business Interest Payments Are Likely to Increase to Around 7% of Revenues by 2024, Then Gradually Rise to Around 8%
GDP Effects of Higher Rates for Small Businesses
Exhibit 7: We Expect the Growth Drag From Higher Interest Expense by Small Businesses to Peak This Year at Just 0.1pp, Decline in 2024, and Rise Modestly Later as Term Loans Are Refinanced
Small Business Profits: Not Just Passing Through
Exhibit 8: The Private Sector as a Whole Can Finance Its Own Spending and Investment—Unlike in 2000 and 2006
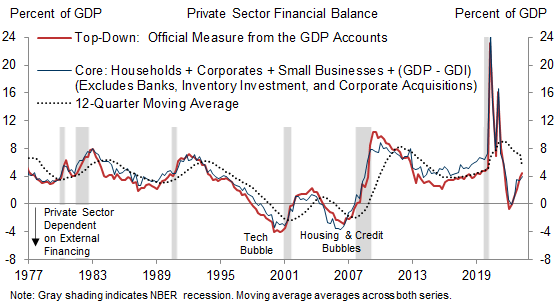
Exhibit 9: The Small Business Financial Balance Is Healthier Than Normal—Particularly When Considering the Elevated Flow of Profits That Could Be Reinvested
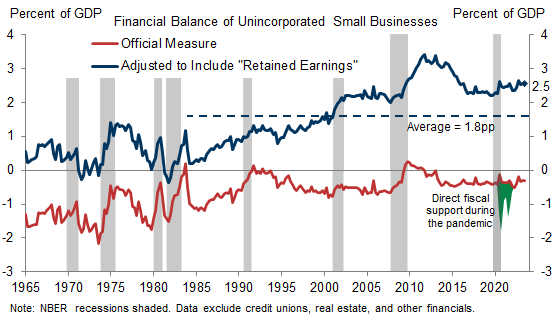
Exhibit 10: The Favorable Financial Balance and Strong Profit Levels of the Small Business Sector Should Help Offset the Capex Headwinds from Higher Interest Rates
Strong Balance Sheets Are an Additional Buffer
Exhibit 11: Strong Balance Sheets and Rising Interest Incomes Will Also Help Offset These Borrowing Cost Headwinds
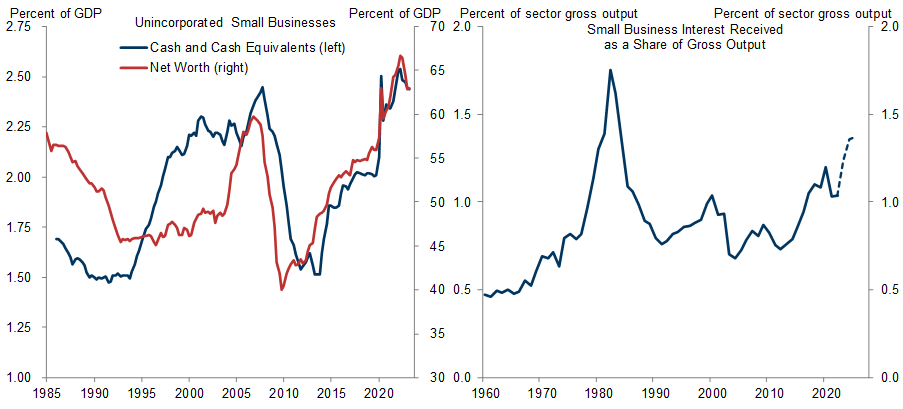
Exhibit 12: The Share of Small Businesses Reporting That Credit Was Harder to Get Relative to a Few Months Ago Stands at 8%, Higher Than Before the Pandemic but in Line With the Early 1990s
Manuel Abecasis
Spencer Hill
Appendix
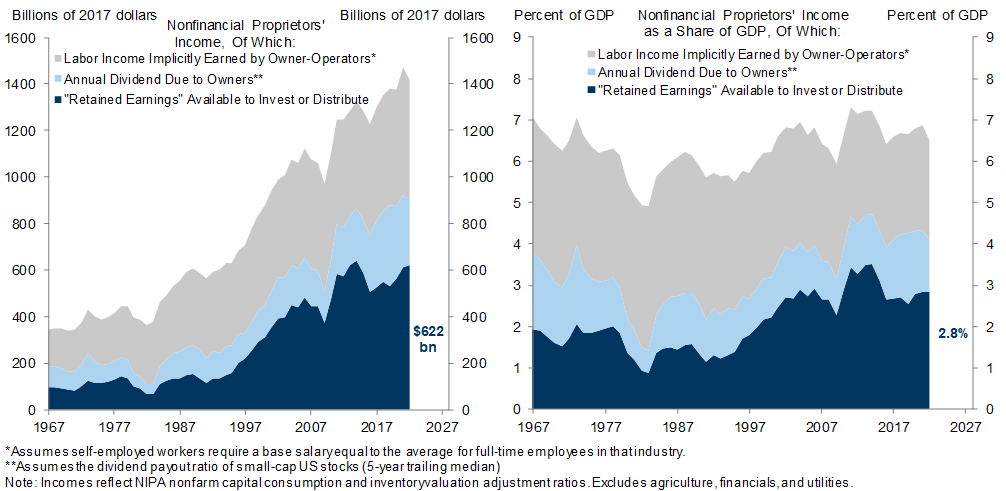
Appendix: The National Accounts Assume That Small Business Profits “Pass Through” to Households, but a Subset of This Income Could Be Retained to Support Capex and Hiring—and Is Statistically Predictive of Future Growth
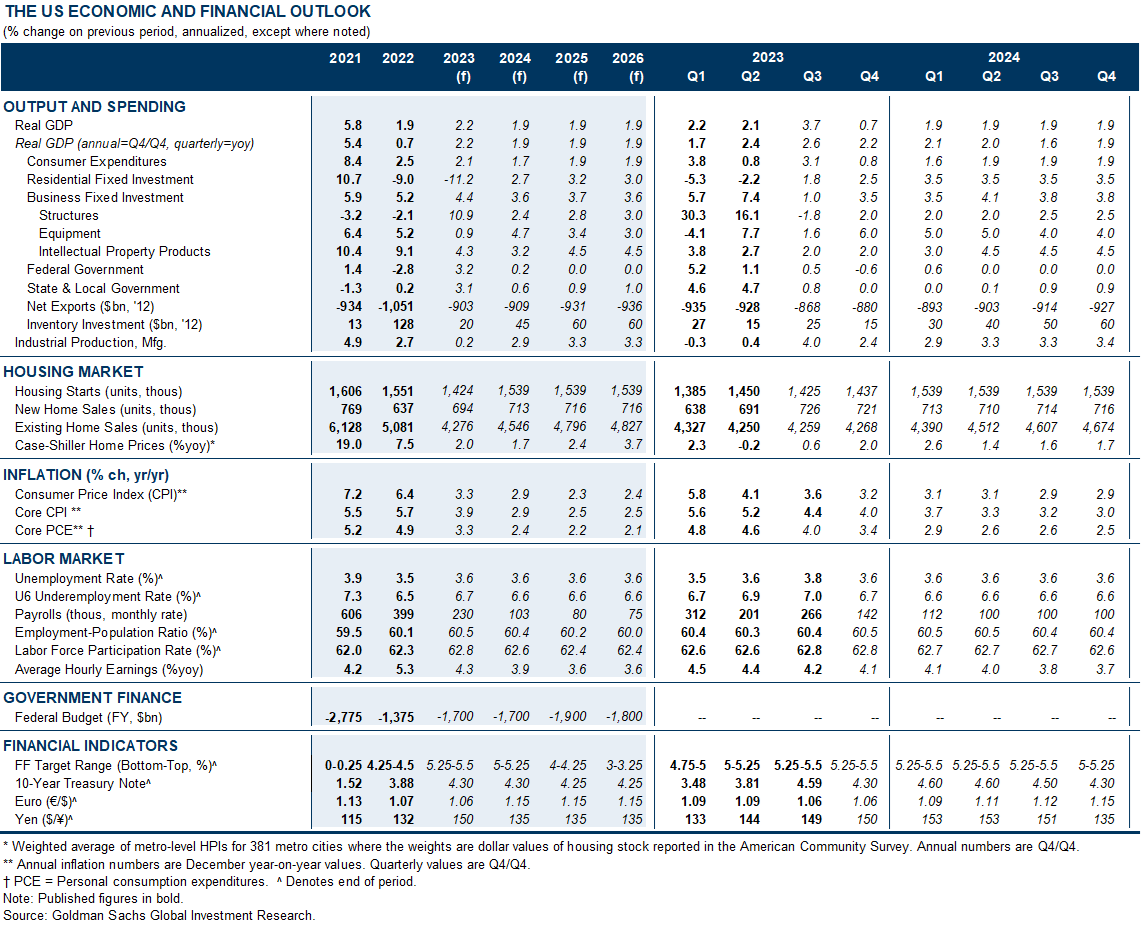
The US Economic and Financial Outlook
- 1 ^ Because the source data on interest payments by small businesses in the national accounts is only available with a long lag, the 2022 reading is a very preliminary extrapolation, which will eventually be replaced with actual tax data in 2024. Currently, the extrapolation implies unusually low interest payments, even though interest rates increased markedly in 2022 and a meaningful share of small business debt reprices quickly. We instead assume that small business interest payments rose in 2022 based on their typical relationship with interest rates. The NIPAs extrapolations imply that small business interest payments as a share of gross output declined by 0.5pp in 2022, from 5.7% to 5.2%, and that the effective interest rate on small business loans (interest payments as a share of outstanding loans) also declined by roughly 0.5pp, from 8.5% to 8.1%.
- 2 ^ Our strategists expect the long-end of the Treasury yield curve to remain elevated and credit spreads to narrow only modestly over the medium-term.
- 3 ^ See John Graham, “Presidential Address: Corporate Finance and Reality,” 2022.
- 4 ^ When balances are high and positive, the level of spending and investment is low relative to income, and households and firms can increase outlays without the need to borrow or draw down asset holdings. In contrast, with low or negative financial balances, firms will exhaust internal funding sources relatively sooner, requiring leverage or equity issuance to fund growth and the risks and costs that come with it.
- 5 ^ The official measure indicates a financial deficit of totaling 0.3% of GDP in Q2, compared to -1.8% in 2000, -0.6% in 2006, and slightly stronger than -0.4% on average over 1985-2019.
- 6 ^ This base salary represents the labor compensation required by proprietors for their time and effort—small business owners do not work for free, and the opportunity cost of each hour spent at their firm is the wage they would otherwise earn as an employee at another firm. We assume a base salary for each self-employed individual equal to the industry-level average for full-time employees (shown by the grey series in the Appendix). Analogously, the imputed dividend payment rewards their capital contribution—after all, small business owners could have invested their assets in the stock market or in another private enterprise. We estimate this dividend payment by assuming the earnings payout ratio of small-cap US stocks (S&P 600, 5-year trailing median; light blue series in the Appendix).
- 7 ^ We do not test the impact on employment growth due to data unavailability.
- 8 ^ Relatedly, the ratio of credit-market debt to net worth in the sector is near 25-year lows, at 43.0% in Q2 compared to 48.8% in 2019 and 60.8% in 2010 (Flow of Funds data).
- 9 ^ Both on average and in particular today given tight bank credit and volatile financial markets.
Investors should consider this report as only a single factor in making their investment decision. For Reg AC certification and other important disclosures, see the Disclosure Appendix, or go to www.gs.com/research/hedge.html.